Transforming observational data and theoretical isochrones into the ACS/WFC Vega-mag system00footnotemark: 0††thanks: Based on observations with the NASA/ESA Hubble Space Telescope, obtained at the Space Telescope Science Institute, which is operated by AURA, Inc., under NASA contract NAS 5-26555.
Abstract
We propose a zero-point photometric calibration of the data from the ACS/WFC on board the Hubble Space Telescope, based on a spectrum of Vega and the most up to date in-flight transmission curves of the camera. This calibration is accurate at the level of a few hundredths of a magnitude. The main purpose of this effort is to transform the entire set of evolutionary models by Pietrinferni et al. (2004) into a simple observational photometric system for ACS/WFC data, and make them available to the astronomical community. We provide the zero points for the most used ACS/WFC bands, and give basic recipes for calibrating both the observed data and the models.
We also present the Colour Magnitude Diagram (CMD) from ACS data of 5 Galactic globular clusters, spanning the metallicity range [Fe/H], and provide fiducial points representing their sequences from several magnitudes below the turnoff to the red giant branch tip. The observed sequences are compared with the models in the newly defined photometric system.
keywords:
techniques: photometric – stars: imaging – Hertzsprung-Russell (HR) diagram.1 INTRODUCTION
After two and a half years of operation, the Advanced Camera for Surveys (ACS) on board HST has collected a huge number of observations of stellar systems, and produced a growing database of colour magnitude diagrams (CMDs) and luminosity functions. In order to be able to exploit fully the information contained in these data sets, and to extract a number of fundamental parameters we are interested in, such as metal content, ages, distances, mass functions, etc, we need to compare the observations with theoretical models. The basic requirement for this comparison is the conversion of stellar models into the ACS photometric observational domain. This conversion is the purpose of the present paper. We have used the most up to date information on the ACS specifications to define a natural, in-flight photometric system and to transform the Pietrinferni et al. (2004) models into the same system. While it is foreseeable that the ACS photometric calibration will improve somewhat as more standard fields are studied and cross compared, the in-flight transmission efficiency curves are now reasonably well established and we would not expect them to change very much. It therefore makes sense to provide a conversion of theoretical stellar models into the observational domain so that more quantitative and qualitative interpretations can be made of observations.
It is worth mentioning that most astronomical photometric investigations are based on some “standard” photometric system. Here, by standard, we mean a photometric system that has been widely used for a long time in different observatories (e.g., the Johnson-Kron-Cousins, Strömgren, Thuan-Gunn, etc systems, see, e.g., Landolt-Börnstein 1982), and possibly defined by a number of standard stars well distributed in the sky, whose flux has been carefully measured. The calibration to a standard system is sometimes the only way to interpret properly the collected data, e.g. when we need to compare our photometric sequences with others collected with different instruments or at different epochs, or with standard results from theoretical models. Still, it must be clearly stated that when the transmission curves of the equipment used to collect the observations are rather different from those of any existing standard system, the transformation of the data to a standard system is difficult, and can be unreliable, particularly for extreme stars (i.e., extreme colours, unusual spectral type, high reddening, etc).
A good example of a problem that one can encounter in using even slightly different filter sets at the same telescope is given in Momany et al. (2003).
Many of the ACS filters differ substantially from the “standard” filters, and the high photometric precision possible with ACS makes the systematic differences more significant. Thankfully, the filter and instrumental response are better characterized for ACS than they are for the typical ground-based observatory, so that it is possible to avoid standard systems altogether and compare the data and the model in the same system: the observational domain. All that is required for this is to determine an empirical zeropoint for each filter by observing a reference star with a well-characterized spectrum in order to characterize accurately the throughput and response of the detector for each filter. The theoretical models can then be integrated over the same spectral response and compared directly with the data. Such a procedure for comparing models with data is far preferable to the typical procedure of converting both models and data into a “standard” system.
Therefore, we calculated a set of empirical zero points that will allow direct comparison of observational data and theoretical models. We have based our calibration on the reference spectrum of Vega, and so we will refer to our photometric system as the “ACS Vega-mag system”. In our derivation of zero points, we used the in-flight sensitivity, measured by Sirianni et al. (2002, and Sirianni 2003, private communication).
In this paper we have focused our attention on the Wide Field Channel (WFC) of the ACS, but the same procedure can be used to measure the photometric zero points for the High Resolution Channel (HRC).
In the next Section, we describe briefly the total transmission curves, the procedure followed to obtain the zero points, and give the aperture corrections. In Section 3, we briefly describe the adopted stellar evolution models, our procedure to transform the models into the observational plane, and the method used to take into account interstellar absorption. In Section 4 we give the zero points and the formulæ to convert both the theoretical tracks and the observed data to the ACS Vega-mag photometric system. Section 5 describes the HST archive data used to test the models, and shows, as an example, how these data have been photometrically calibrated and compared with our models in the ACS Vega-mag plane. Conclusions follow in Section 6 together with instructions on how to download the transformed models.
2 DEFINING THE ACS VEGA-MAG PHOTOMETRIC SYSTEM
In this section, we define our photometric system and will refer to it as the ACS(/WFC) Vega-mag system.
2.1 Total transmission of the HSTWFC/ACS
The first step toward the definition of our photometric system is to calculate the total transmission curves, T() for each individual band. These are the products of the individual transmission curves, t, for 5 different terms.
In detail, the t are: the transmission curve of the window of the dewar, the transmission curve of the filters, the reflectivity of the WFC/ACS mirrors (3 mirrors), an average of the two CCD quantum efficiencies111 These curves are available at the STSCI web-site http:// www.stsci.edu /hst /acs /analysis /reference_files/ wfc_synphottable_list.html. and the transmission curve of the Optical Telescope Assembly (OTA) of HST222 This last component has been obtained from the web-site ftp:// ftp.stsci.edu /cdbs /cdbs2 /comp /ota/ tabulated in the file hst_ota_007_syn.fits. . In order to outline our procedure, we consider two commonly used filters, F606W and F814W. We will extend the results to other filters in Section 4. All the individual transmission curves are shown in Fig. 1, where two thick lines show the total system transmissions for the two considered filters.
The transmission curves measured in the laboratory differ significantly from those found on-orbit (Sirianni et al. 2002). In the following we will use only the on-orbit adjusted total transmission curves obtained by Sirianni et al. (private communication, paper in preparation 2004). The uncertainities for these total transmission curves are within 0.5% (De Marchi et al. 2004333ISR ACS 2004-08, published after the submission of the present work., Sirianni et al. in preparation 2004).

2.2 The Determination of Zero Points
We describe below the procedure used to define the zero points of the system.
We have used the spectrum of Vega from ftp:// ftp.stsci.edu/ cdbs/ cdbs2/ grid/ k93models/ standards/ vega_reference.fits. Details of this spectrum can be found at http://www.stsci.edu/ instruments/ observatory/ PDF/ scs8.rev.pdf; hereafter it will be denoted as , in units .
The integrated flux of the assumed spectrum of Vega under the total transmission curve of the filter F606W instrument is:
This number is the quantity that theoreticians will need to rescale their models to the photometric system we adopt (see Sec. 4).
The estimated number of expected photo-electrons () is:
where the photon energy is given by
Therefore, for Vega, the counts detected by the system in digital numbers (DN) would be:
where is the effective collecting area of the telescope (45,239 cm2, with the secondary obscuration already accounted for), and GAIN is the conversion factor from e- to DNs.
At this point, we can define the zero point of our magnitude system in the F606W band by imposing for the magnitude of Vega (with the assumed spectrum):
For simplicity, we have defined this zero point for GAIN 1 .
Since FLT images provided by STSCI are already in photo-electrons (e-) rather than in DNs (note that DRZ images are given in e- s-1) hereafter, to avoid any confusion, we will not consider the GAIN, and we will refer to rather than to .
In an analogous way we can define the zero point of the F814W band:
and in a similar way for all the other filters.
2.3 Calibration of the Observations
The formula that observers should use to calibrate their observations into our WFC/ACS Vega-mag system magnitudes in the F606W band is:
where exptime is the exposure time, and is the aperture correction. In the next section we discuss in detail the aperture correction, which we will always treat as a positive quantity to be subtracted. This calibration is intended for the officially calibrated DRZ images which are already corrected for: flat field, dark, bias, and geometrical distortion.444 The images are still affected, at least by CTE, and charge diffusion (see Riess & Mack, ISR 2004-06, and Krist, ISR 2003-06). In Section 5.1 we use FLT images, and describe how we linked our photometry for those images to the officially corrected DRZ images.
2.4 Aperture Corrections
Breathing of the telescope tube, the complex optical system, and charge diffusion induce temporal and spatial variation of the core of the point-spread function (PSF), such that the -ring ratio of the diffraction figure changes considerably across the chip and at a minor level with orbital phase.
For these reasons, we choose to refer our zero points to an infinite aperture. That makes it easier for those studying surface photometry of extended sources to calibrate their magnitudes to this system. The aperture corrections for extended sources are null, being the Zero Points of the system referred to an infinite aperture:555 Note, that this is really only true for infinite extended sources, or sources larger than the widest part of the PSF halo.
On the other hand, in practice all the energy of a point source is contained within ( 80 pixels), and within ( 10 pixels). In dense environments, where crowding makes an aperture correction to an infinite aperture impossible, one has to rely on the in-flight encircled energy.666 This is tabulated at the STSCI web-site: http:// www.stsci.edu /hst/acs/analysis/ reference_files/ wfc_synphottable_list.html This means that one has to correct the instrumental magnitude (for example the PSF-fitted magnitude) to the magnitude at a specified aperture by adding a , and then sum an additional quantity , obtained from the tabulated encircled energy in order to link the magnitudes to the infinite aperture for which we have calculated the Zero Points.
In summary,
In Table 1 we give the corrections to be added to the zero points for two circular apertures of radius (6 pixels) and (as in Holtzman et al. 1995) and for the different filters. For clarity, we also report in Tab. 1 the correction to zero points for an infinite aperture, which is zero by definition.
| F435W | 0.000 | 0.095 | 0.132 |
|---|---|---|---|
| F475W | 0.000 | 0.084 | 0.120 |
| F502N | 0.000 | 0.078 | 0.114 |
| F550M | 0.000 | 0.076 | 0.110 |
| F555W | 0.000 | 0.076 | 0.110 |
| F606W | 0.000 | 0.079 | 0.115 |
| F625W | 0.000 | 0.080 | 0.118 |
| F658N | 0.000 | 0.079 | 0.123 |
| F660N | 0.000 | 0.079 | 0.123 |
| F775W | 0.000 | 0.078 | 0.123 |
| F814W | 0.000 | 0.079 | 0.130 |
For point sources, the correction should be estimated in each individual image, remembering that the smaller the aperture (), the more the photometry is affected by the problems mentioned at the beginning of this section (i.e. spatial variability of the PSF and charge diffusion). See Section 5.2 for uncertainties on the values of .
Moreover, there appears to be a second-order effect which depends on the colour of the stars and on the filter used (Sirianni, private communication, paper in preparation). In practice, the present calibration is useful only if the degree of accuracy desired by the observers is no better than 2-3 hundredths of a magnitude. However, taking into account all the problems of ACS, it seems hard to achieve a much higher accuracy. It should be noted that the photometric stability of WFPC2 was certainly not any better than this, but the higher precision of WFC/ACS makes systematic errors (on the zero points) the dominant source of error in the final photometry.
We have decided not to deal with the two filters: F850LP and F892N, because they are much more problematic (see Sirianni, in preparation).
3 TRANSFORMING THE STELLAR MODELS INTO THE ACS VEGA-MAG SYSTEM
3.1 The Stellar Evolution Models
In this work we adopt the stellar-evolution model database in Pietrinferni et al. (2004); for a detailed description of the models, as well as a comparison with other stellar model libraries available in the literature, we refer the interested reader to this reference. For the purposes of this paper, we briefly list the main characteristics of this model library.
Evolutionary tracks are available for up to 41 mass values at each of 10 selected initial chemical compositions. The minimum mass considered is roughly , while the maximum value is always equal to . The whole set of evolutionary computations has been used to compute isochrones for a large age range, from Myr to Gyr, covering all stellar evolution phases from the Zero Age Main Sequence up to the first thermal pulse on the Asymptotic Giant Branch or to C ignition. For each chemical composition, a Zero Age Horizontal Branch (ZAHB) locus, as well as post-ZAHB evolutionary tracks were also calculated for a large range of masses, by employing the He-core mass and chemical profiles in the H-rich envelope of the Red Giant Branch (RGB) progenitor having an age at the He-flash of the order of Gyr.
The set of models has been computed for metallicities in the range for both a scaled-solar mixture and an -enhanced mixture ([/Fe]0.4; paper in preparation).
The adopted reference scaled-solar heavy element mixture is from Grevesse & Noels (1993). As for the He-abundance, the models employ a primordial mass fraction of =0.245 , based on the estimates by Cassisi et al. (2003, see also Salaris et al. 2004) obtained from the -parameter method applied to a large sample of Galactic globular clusters (GGCs). This value is in fair agreement with recent independent determinations of the cosmological baryon density from the WMAP results (Spergel et al. 2003). To reproduce the initial solar He-abundance obtained from an appropriately calibrated solar model, an He enrichment ratio has been used (Pietrinferni et al. 2004).
All models have been computed with outer boundary conditions obtained by integrating the atmospheric layers with the Krishna-Swamy (1966) relationship. Superadiabatic convection is treated according to the Cox & Giuli (1968) formalism of mixing-length theory (Böhm-Vitense 1958), and the mixing-length parameter has been fixed by the solar calibration () and kept constant for all masses during all evolutionary phases; mass loss is included by employing the Reimers formula (Reimers 1975) with the free parameter set to 0.4.
At each chemical composition, models have been computed with and without overshooting from the convective cores during the main sequence (MS) phase. In the former case, for masses larger than 1.7, where is the extension of the overshooting region in units of the local pressure scale height. For stars less massive than , , while in the intermediate range varies according to the relation . This choice allows a smooth variation of the isochrone turn-off (TO) morphology, and a smooth decrease to zero of the convective core mass. This parametrization also provides a good match to the TO morphology in the CMD of Galactic open clusters of different ages. Induced overshooting and semi-convection during the central He-burning phase are accounted for following Castellani et al. (1985).
Radiative opacities from the OPAL tables (Iglesias & Rogers 1996) for temperatures larger than K, and from Alexander & Ferguson (1994) for lower temperatures have been employed, supplemented by opacities for electron degenerate matter computed following Potekhin (1999). The relevant energy loss rate from plasma-neutrino processes comes from Haft, Raffelt & Weiss (1994), whereas for all other processes the reader is referred to Cassisi & Salaris (1997); the nuclear reaction rates are from the NACRE database (Angulo et al. 1999), with the exception of the 12CO reaction, in which case the more accurate recent determination by Kunz et al. (2002) has been adopted. Electron screening is treated according to Graboske et al. (1973).
The accurate Equation of State (EOS) by A. Irwin has been used. An exhaustive description of this EOS is in preparation (Irwin et al. 2004) but a brief discussion of its main characteristics can be found in Cassisi et al. (2003). This EOS covers the full stellar structure for the whole evolutionary phase and mass range spanned by the model database; in Pietrinferni et al. (2004) and Bahcall, Serenelli & Pinsonneault (2004) it is shown that this EOS and the latest version of the OPAL EOS (Rogers 2001) provide almost identical results in the case of the Sun. The accuracy and reliability of the present evolutionary scenario has been successfully tested in Cassisi et al. (2003), Riello et al. (2003) and Salaris et al. (2004) in the regime of Galactic globular clusters, and by Pietrinferni et al. (2004) in the regime of field stars and open clusters. Cassisi et al. (2003) and Pietrinferni et al. (2004) have also compared our adopted set of theoretical isochrones with other existing isochrone databases widely cited in the current literature. This comparison provides an estimate of the present uncertainties in stellar evolution models due to different choices for the stellar input physics (see also Chaboyer 1995). The main conclusions of this exercise are summarized below.
Isochrones for typical globular cluster ages (of the order of 10 Gyr) show a remarkable consistency for the prediction of the Main Sequence location and Turn Off luminosity at a given initial chemical composition, whereas the Red Giant Branch effective temperature and Zero Age Horizontal Branch brightness display values that differ by amounts of 100-200 K and 0.1 mag, respectively. Globular cluster ages estimated from the difference between Turn Off and Horizontal Branch brightness would consequently be uncertain by 10 (Chaboyer 1995 determined a similar uncertainty, of the order of 15%).
Isochrones for ages lower than 4-5 Gyr show again consistent Main Sequence locations, but differing Turn Off luminosities, effective temperatures, and Helium burning luminosities, due mainly to the uncertain treatment of the overshooting from the Main Sequence stars’ convective cores. These uncertainties cause variations in the estimated age of stellar populations within this age range, of at most 30 %. Also in this age range red giants’ effective temperatures show a spread of 100-200 K.
3.2 The Transformation to the Observational Plane
Here we describe the procedure we have followed to transform our models into the ACS Vega-mag system defined in Sect. 2.
We computed ACS colour indices by using the homogeneous set of ODFNEW model atmospheres and synthetic fluxes777Available at http:// wwwuser.oat.ts.astro.it/ castelli/ grids.html. (Castelli & Kurucz 2003) computed with the Kurucz ATLAS9 code. We generated grids of indices for the following values of [Fe/H]: 0.5, 0.2, 0.0, 0.5, 1.0, 1.5, 2.0, 2.5.
In each grid point, ranges from 3500 to 50,000 K, from 0.0 to 5.0 and the microturbulent velocity is 2.0 km s-1. We tabulated for each and gridpoint the BCV bolometric correction, the magnitude, and the colour indices , , , , , , and . The ACS magnitudes were computed by using the WFC/ACS transmission curves described in Sect. 2.1, while we adopted the passband from Bessel (1990).
We adopted for Vega and set all colour indices () to zero, so that the Vega ACS magnitudes would be equal to 0.00 in all passbands. The Vega model and flux are the ATLAS9 model and the ATLAS9 flux from Castelli & Kurucz (1994) with parameters 9550 K, 3.95, [M/H]0.5, 2 km s-1. Note that this model has been built specifically to reproduce the observations of the spectrum used in Sect. 2.2. The absolute zero-point for the magnitude was fixed by adding the constant 21.10 mag to the computed for Vega (Bessell, Castelli & Plez 1998).
In Table 2 we show an example of the theoretical isochrones transformed into the ACS Vega-mag photometric system. The header of the isochrone table provides information about the number of lines in the file (), the total metallicity , the abundance by mass of metals () and helium (), and the corresponding age in billions of years, . The content of the columns in the following lines is the following (from left to right): 1) the initial mass of each star, 2) the current mass at the specified age (computed accounting for mass loss - see previous section), 3) the logarithm of the surface luminosity in solar units, 4) the logarithm of the effective temperature, 5) the ACS magnitude, 6) the ACS magnitude, 7) the ACS magnitude, 8) the ACS magnitude, 9) the ACS magnitude, 10) the ACS magnitude, 11) the ACS magnitude.
The entire set of transformed isochrones, as well as the ZAHB and post-ZAHB evolutionary tracks can be retrieved from the following URL: http:// www.te.astro.it/BASTI/index.php.
| Isochrone by Pietrinferni - Cassisi - Salaris - Castelli 2004 Standard Model |
| Scaled solar model & transformations for ACS (Castelli 2004) |
| , , , , |
| .5000000000 | .4999030025 | -1.20676 | 3.62790 | 9.540 | 9.063 | 8.418 | 8.024 | 7.693 | 7.069 | 6.982 |
| .5011654487 | .5011233468 | -1.20259 | 3.62829 | 9.525 | 9.048 | 8.405 | 8.012 | 7.681 | 7.059 | 6.972 |
| .5023308974 | .5023308974 | -1.19841 | 3.62868 | 9.510 | 9.034 | 8.392 | 8.000 | 7.670 | 7.049 | 6.962 |
| … | … | … | … | … | … | … | … | … | … | … |
| .9066248329 | .6047402926 | 2.89310 | 3.60793 | -0.175 | -0.871 | -1.635 | -2.045 | -2.382 | -3.053 | -3.153 |
| .9066266265 | .6037663031 | 2.92275 | 3.60503 | -0.190 | -0.899 | -1.675 | -2.093 | -2.435 | -3.116 | -3.218 |
| .9066284200 | .6026715201 | 2.95336 | 3.60202 | -0.204 | -0.926 | -1.715 | -2.143 | -2.490 | -3.181 | -3.285 |
3.3 Reddening in the WFC/ACS Vega-mag system
Following the recipe and the motivations given by Holtzman et al. (1995) we also computed the interstellar absorption in the WFC/ACS bands as a function of . By using the extinction curve from Table 1 in Mathis (1990) for we computed for different values of the interstellar reddening at the wavelengths of the ATLAS9 flux, the corresponding reddened fluxes and the reddened WFC/ACS magnitudes. The extinctions in the WFC/ACS filters were obtained as differences between the reddened and unreddened magnitudes.
Tables 3 and 4 give the values of the for a cool star and a hot star respectively. We give these values for the main filters, F435W, F475W, F555W, F606W, F625W, F775W, and F814W. We note how these values are very close to those tabulated by Holtzman et al. (1995) for WFPC2’s similar filters.
| K, , , , | ||||||||||||||||||||||||||||||||||||||||||||||||||||||||||||||||||||||||||||||||||||||||||||||||||||||||||||||||||||||||||||||||||||||||||||||||||||||||||||||||||||||||||||||||||||||||||||||||||||||||||||||||||||||||||||||||||||||||||||||||||||||||||||||||||||||||||||||||||||||||
|
| K, , , , | ||||||||||||||||||||||||||||||||||||||||||||||||||||||||||||||||||||||||||||||||||||||||||||||||||||||||||||||||||||||||||||||||||||||||||||||||||||||||||||||||||||||||||||||||||||||||||||||||||||||||||||||||||||||||||||||||||||||||||||||||||||||||||||||||||||||||||||||||||||||||
|
4 ACS VEGA-MAG SYSTEM ZERO POINTS
Table 5 lists the zero points for the ACS Vega-mag system in other useful pass-bands; the zero points for all the other filters can be easily obtained following the recipes outlined above.
We note that this calibration is linked to the chosen spectrum of Vega. These zero points are probably accurate to 2–3 hundredths of a magnitude, and can (and hopefully will soon) be updated, once more accurate data on the ACS performance is available.
The main sources of systematic error in the calibration of the observations are: residuals in correction for CTE, flat fielding, aperture corrections, charge diffusion, and the encircled energy which seems to depend on stellar colour (Sirianni, private communication). Still, the lack of any other official and complete photometric calibration of the ACS, useful for the comparison with stellar models, has led us to calculate and publish this calibration.
| filter | F435W | F475W | F502N | F550M | F555W | F606W |
|---|---|---|---|---|---|---|
| 25.785 | 26.168 | 22.338 | 24.861 | 25.718 | 26.391 | |
| (filter) | 2.0994 | 2.7611 | 0.075320 | 0.69396 | 1.6028 | 2.7591 |
| filter | F625W | F658N | F660N | F775W | F814W | —– |
| 25.722 | 22.381 | 21.342 | 25.254 | 25.492 | —– | |
| (filter) | 1.3687 | 0.059770 | 0.022895 | 0.72740 | 0.87198 | —– |
In summary, photometric observations can be transformed into the ACS/WFC Vega-mag system defined in this paper by applying the following relation:
| (1) |
Where can assume the values: , , or . Note that the last two positive quantities in Eq. 1 are subtracted.
Models can be transformed into the observational plane of the same system by applying:
| (2) |
Here the meaning of , and are clear from the discussions in previous sections. In Sect. 5.2 we give a practical example of how to calibrate the observations.
Our Zero points agree well with those presented in the recent ISR by De Marchi et al. (2004-08).888 http:// www.stsci.edu/ hst/ acs/ documents/ isrs/ isr0408.pdf. The only differences are due to a different choice of spectrum of Vega (Sirianni private comunication). Nevertheless, for broad filters the Zero points agree within 0.005 mag.
5 COMPARISON OF MODELS WITH OBSERVATIONS
5.1 Observations and Data Reduction
In order to give a practical example of our procedures and to provide a useful test for our models, we used archival WFC observations of 5 Galactic globular clusters (GO-9453, PI: Brown), which span a wide range in metallicity (). The data are summarized in Table 6. They consist of 1 short, 1 intermediate, and 1 (relatively) long exposure, in both F606W and F814W filters, for each cluster.
We carried out the photometry with algorithms based on the effective point-spread function (ePSF) fitting procedure described by Anderson & King (2000). We obtained the ePSF from a set of images from a different project using the same filters, since the dithering of GO-9453 images was unsuitable to constrain the ePSF shape (Anderson & King, 2000).
The resampling present in the DRZ images provided by STSCI does not allow the use of the ePSF method, limiting the precision of the output photometry. We therefore performed our fitting photometry using FLT images. These images, affected by geometrical distortion, have been flat-fielded to preserve surface brightness, but not flux. Therefore, we must multiply each pixel by its projected area to obtain a proper flux for each star.
We find slight differences of flux-scaling between our corrected FLT images and the corresponding DRZ images (on the order of 1% or so). Since it is the DRZ images that have been carefully calibrated via the STSCI pipe-line, we should convert any photometry measured on FLT images into the corresponding infinite-aperture fluxes in the DRZ images. The photometry has been calibrated as described in the previous sections.
5.2 An Example: Calibration of the 47Tuc Photometry
For the GO-9453 47Tuc data, the zero point of the long exposures has been used to calibrate the intermediate and short ones in both F606W (for which the exposure time is 70s) and F814W filters (for which the exposure time is 72s, see Table 3). We determined the zero-point difference between our PSF-fitting photometry and aperture photometry with a aperture for each filter. The differences are , and . To these we need to add the aperture corrections. According to Table 1: (equal for the two filters, at this apertures). In summary, from Eq. (1):
[Note: 1) is simply the instrumental magnitude (some codes, such as DAOPHOT, add a constant value of 25 to the instrumental magnitude to avoid negative numbers); 2) the adopted normalization of the fitting magnitude is taken into account by the aperture correction ; 3) the sign of the last two quantities in each equation is negative.]
The calibrated CMDs are presented in Fig. 2.
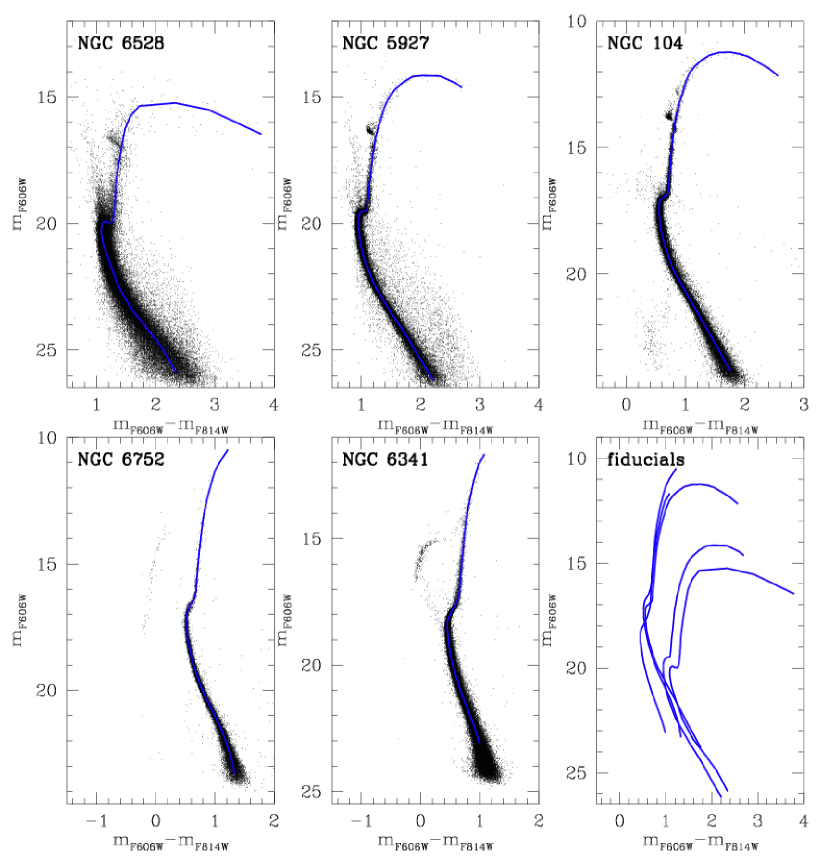
Superposed on the observed CMD are the fiducial lines of the MS, SGB, and RGB. The fiducial points which define them have been determined by eye and are given in Table 7. Note that, due to the differential reddening in the field, the fiducial lines in the cases of NGC 6528 and NGC 5927 are poorly defined.
These fiducial points can be used as a reference to compare against those measured for other globular clusters or galaxies whose stars are resolved (Brown et al. 2003).
| Cluster | F606W data | F814W data |
|---|---|---|
| NGC 6528 | 4s, 50s, 450s | 1s, 20s, 350s |
| NGC 5927 | 2s, 30s, 500s | 0.7s, 15s, 340s |
| NGC 104 | 0.5s, 6s, 70s | 0.5s, 5.5s, 72s |
| NGC 6752 | 0.5s, 4s, 40s | 0.5s, 4s, 45s |
| NGC 6341 | 0.5s, 5s, 90s | 0.5s, 6s, 100s |
| NGC 6528 | ||||||||||||||||||||||||||||||||||||||||||||||||
|
| NGC 5927 | ||||||||||||||||||||||||||||||||||||||||||||||||||||||||||||||||||
|
| NGC 104 | ||||||||||||||||||||||||||||||||||||||||||||||||||||||||||||||||||||||||||||||||||
|
| NGC 6752 | ||||||||||||||||||||||||||||||||||||||||||||||||||||||||||||||||
|
| NGC 6341 | ||||||||||||||||||||||||||||||||||||||||||||||||||||||||||||||||||||||
|
5.3 Comparison with the Models
In this section we compare the theoretical models transformed to the ACS Vega-mag system with observed CMDs.
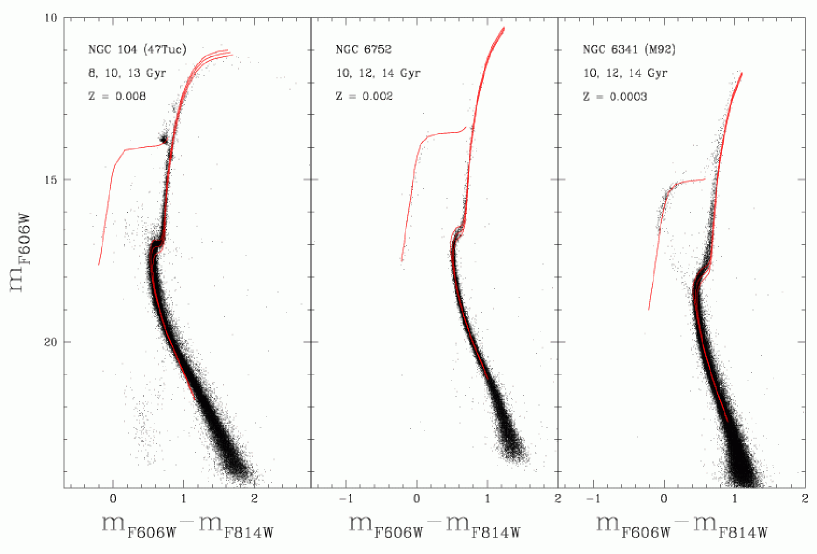
Figure 3 displays our adopted -enhanced isochrones and ZAHBs compared with the observed CMDs of the GGCs 47 Tuc (NGC 104), NGC 6752, and M92 (NGC 6341). These clusters span a wide metallicity range (). We selected these clusters for the comparison because of their very low extinction and lack of differential reddening.
In the following discussion, in order to make the comparison with the values in the literature more straightforward, we give the reddening and the apparent distance modulus in the band (). The comes from as adopted in the best fitting by interpolation of the values in Table 3. The comes from the best fitting distance modulus in the F606W band (): , where .
In the case of 47 Tuc we used -enhanced () isochrones with (Z0.008), a value in very good agreement with spectroscopic measurements (see, e.g., Percival et al. 2002, Gratton et al. 2003); the best match is obtained for an apparent distance modulus , an age of 10 Gyr, and a reddening (the 8 and 13 Gyr isochrones are also shown). These values of distance modulus and reddening are consistent with empirical determinations by Percival et al. (2002) and Gratton et al. (2003).
The quality of the fit is satisfactory along most of the isochrone, worsening at the redder end of both the RGB and MS. The deviation of the lower part of the sequence from the models for intermediate-metallicity clusters is well known (see Bedin et al. 2001).
For NGC 6752 we have employed our isochrones with 1.26 (Z0.002), a value close to the estimate by Rutledge et al. (1997) with their calibration of the CaII triplet index on the GGC Carretta & Gratton (1997) metallicity scale. We obtain a best match with 13.25, an age of 12 Gyr and 0.04 (the 10 and 14 Gyr isochrones are also shown).
Again, the reddening agrees with independent empirical estimates (e.g. Gratton et al. 2003), whereas the distance is slightly longer than the MS-fitting estimates (Carretta et al. 2000, Gratton et al. 2003). These empirical estimates employ a metallicity 0.2 dex lower than our adopted value; it is interesting to note, judging from the numerical experiment performed by Carretta et al. (2000, their Fig. 5), that their empirical MS-fitting distance would come into agreement with our value if our assumed metallicity is used in their MS-fitting technique.
Had we used our isochrones for 1.57 (Z0.001) and a value close to the metallicity estimate by Rutledge et al. (1997) obtained calibrating the calcium index on the Zinn & West (1984) metallicity scale, the quality of the fit to the RGB location would be worse (isochrone too blue), the age older by 1 Gyr, 0.02 mag higher and 0.07 mag larger.
The comparison with the M 92 (NGC 6341) CMD has been performed using isochrones with [Fe/H]2.1 (Z0.0003), a value in fair agreement with the estimate by Carretta & Gratton (1997) (). The best agreement is achieved for an age of 12 Gyr, 0.04 and (the 10 and 14 Gyr isochrones are also shown).
6 SUMMARY
In this paper we have proposed a simple zero-point photometric calibration of the ACS/WFC data, based on a model spectrum of Vega and the most up to date in-flight transmission curves of the ACS camera. We have named this new in-flight system the WFC/ACS Vega-mag photometric system. The proposed calibration is accurate at the level of a few hundredths of a magnitude. We give the basic recipes to calibrate both the observed data and the models, and present a set of models by Pietrinferni et al. (2004) already transformed into the new ACS Vega-mag system.
Since the primary purpose of this investigation is to make available to the public a complete set of stellar models and isochrones transformed to the ACS Vega-mag system, we have developed the following web site where all models and isochrones can be retrieved: http:// www.te.astro.it /BASTI /index.php.
We show CMDs for 5 Galactic globular clusters, spanning a metallicity range [Fe/H]; these CMDs have been obtained from ACS observations, calibrated to the ACS Vega-mag system, and used to test our models. We also give the fiducial points representing their RGB, SGB, and Main Sequence from the red giant branch tip to several magnitudes below the TO. These CMDs and fiducial points will be useful for the study of the old stellar populations in other stellar systems (Brown et al. 2003).
Acknowledgments
We are very thankful to Marco Sirianni for providing us with the ACS/WFC transmission curves, and also for discussions. We thank the anonymous referee for useful suggestions, James Manner for a careful reading of the manuscript, and Phil James for polishing it. This work has been partially supported by the Agenzia Spaziale Italiana and by the Ministero dell’Istruzione, Università e Ricerca under the program PRIN2003.
References
- (1) Alexander D. R., Ferguson J. W., 1994, ApJ, 437, 879
- (2) Anderson J., King I. R., 2000, PASP, 112, 1360
- (3) Angulo C., Arnould M., Rayet M., et al. (NACRE Collaboration), 1999, Nucl. Phys. A, 656, 3
- (4) Bahcall J. N., Serenelli A. M., Pinsonneault M., 2004, ApJ, submitted, (astro-ph/0403604)
- (5) Bedin L. R., Anderson J., King I. R., Piotto G., 2001 ApJ, 560, L75
- (6) Bessell M. S., 1990, PASP, 102, 1181
- (7) Bessell M. S., Castelli F., Plez B., 1998, A&A, 333, 231
- (8) Böhm-Vitense E., 1958, Z. Astrophys., 46, 108
- (9) Brown. T. et al., 2003, ApJ, 592, L17
- (10) Carretta E., Gratton R. G., 1997, A&AS, 121, 95
- (11) Cassisi S., Salaris M., 1997, MNRAS, 285, 593
- (12) Cassisi S., Salaris M., Irwin A. W., 2003, ApJ, 588, 862
- (13) Cassisi S., Castellani V., degl’Innocenti S., Weiss A., 1998, A&AS, 129, 267
- (14) Castellani V., Chieffi A., Pulone L., Tornambé A., 1985, ApJ, 296, 204
- (15) Castelli F., Kurucz R. L., 1994, A&A 281, 817
- (16) Castelli F., Kurucz R. L., 2003, Proceed. of IAU Symp. 210, Modelling of Stellar Atmospheres, eds. N. Piskunov et al., poster A20 on the enclosed CD-ROM, (astro-ph/0405087)
- (17) Chaboyer B., 1995, ApJL, 444, 9
- (18) Cox J. P., Giuli R. T., 1968, in ‘Principles of Stellar Structure’, Gordon & Breach, London, Vol. II
- (19) De Marchi G., Sirianni M., Gilliland R., Bohlin R., Pavlosky C., Jee M., Mack J., van der Marel R. & Boffi F. Instrument Science Report ACS 2004-08
- (20) Graboske H. C., Dewitt H. E., Grossman A. S., Cooper M. S., 1973, ApJ, 181, 457
- (21) Gratton R. G., Bragaglia A., Carretta E., Clementini G., Desidera S., Grundahl F., Lucatello S., 2003. A&A, 408, 529
- (22) Grevesse N., Noels A., 1993, in Origin and Evolution of the Elements, ed. N. Prantzos, E. Vangioni-Flam, M. Cassé (Cambridge: Cambridge Univ. Press), 14
- (23) Haft M., Raffelt G., Weiss A., 1994, ApJ, 425, 222
- (24) Holtzman J. A., Burrows C. J., Casertano S., Hester J. J., Trauger J. T., Watson A. M., Worthey G., 1995, PASP, 107, 1065
- (25) Krishna-Swamy K. S., 1966, ApJ, 145, 174
- (26) Krist J., Instrument Science Report ACS 2003-06
- (27) Kunz R., Fey M., Jaeger M., Mayer A., Hammer J. W., Staudt G., Harissopulos S., Paradellis T., 2002, ApJ, 567, 643
- (28) Iglesias C. A., Rogers F. J., 1996, ApJ, 464, 943
- (29) Landolt-Börnstein 1982, Numerical Data and Functional Relationships in Science and Technology, vol.2, Astronomy and Astrophysics
- (30) Mathis J. S., 1990, ARA&A, 28, 37
- (31) Momany Y., Cassisi S., Piotto G., Bedin L. R., Ortolani S., Castelli F., Recio-Blanco A., 2003, A&A, 407, 303
- (32) Percival S. M., Salaris M., van Wyk F., Kilkenny D., 2002, ApJ, 573, 174
- (33) Pietrinferni A., Cassisi S., Salaris M., Castelli F., 2004, ApJ, in press, (astro-ph/0405193)
- (34) Potekhin A. Y., 1999, A&A, 351, 787
- (35) Reimers D., 1975, Mem. Soc. R. Sci. Líege, 8, 369
- (36) Riello M. et al. 2003, A&A, 410, 553
- (37) Riess A. & Mack J. Instrument Science Report ACS 2004-006
- (38) Rogers F. J., 2001, Contrib. Plasma. Phys., 41, 179
- (39) Rutledge G. A., Hesser J. E., Stetson P. B. 1997, PASP, 109, 907
- (40) Salaris, M., Riello M., Cassisi S., Piotto G., 2004, A&A, 420, 911
- (41) Sirianni M., De Marchi G., Gilliland R., Bohlin R., Pavlovsky C., Mack J., 2002, HST Calibration Workshop 2002, ed. S. Arribas, A. Koekemoer, B. Whitmore (Baltimore: STScI), p. 13
- (42) Sirianni, M., Jee, M., Ford, H., Illingworth, G., Clampin, M., Hartig, G., De Marchi, G., Gilliland, R., Benitez, N., Blakeslee, J., Mack, J., Martel, A., and McCann W.J. 2004, submitted to PASP
- (43) Spergel D. N., Verde L., Peiris H. V. et al., 2003, ApJS, 148, 175
- (44) Zinn R., & West M. J., 1984, ApJS, 55, 45