Intermediate Scale Structures in BL Lac objects
Abstract
The parsec-scale total intensity structures of BL Lac objects share many characteristics with quasars: e.g. well-collimated jets and superluminal motion. However, the jets of BL Lac objects appear to fade much more quickly than those in quasars and on VLA scales many BL Lacs have structures comparable to those of low luminosity (FR I) radio galaxies, in which kpc-scale flow speeds are non-relativistic.
The region between parsec and kiloparsec scales is therefore one of transition in BL Lac objects. We have carried out VLBI observations of a small sample of BL Lac objects at frequencies between 2.3 GHz and 327 MHz in order to investigate this transition region. Preliminary results for two of these sources are presented here.
Coherent structures are detected in these sources out to a distance of several tens of parsecs. We find evidence for significant changes in jet structure on scales of a few tens of milliarcseconds, both in terms of the orientation and collimation of the jets.
1 Introduction
BL Lac objects are a sub-class of extragalactic radio sources exhibiting highly variable polarized radio emission and are distinguished from optically violently variable quasars by their weak optical line emission (equivalent width less than 5 Å, Stickel et al., 1993).
The parsec (pc) and kpc scale jets of BL Lac objects are often misaligned and the kpc scale emission is typically more diffuse. This indicates that the jet has become decollimated between the milliarcsecond (mas) and arcsec scales. There is evidence in some BL Lac objects for significant total intensity and polarized flux density on scales intermediate to the mas and arcsec resolution provided by VLBI and VLA observations respectively (Gabuzda et al., 1994). Further, the pc scale jets of BL Lac objects exhibit inferred magnetic fields which tend to be perpendicular to the direction of the jet motion (e.g. Gabuzda et al., 1999 and references therein), while on arcsecond scales the magnetic field is often aligned with the jet (Kollgaard et al., 1992). The region over which these changes take place lies on scales between those accessible to high-frequency ( GHz) VLBI and more conventional interferometers such as the VLA, and has therefore been little explored to date.
In order to investigate these changes of structure with scale, we have carried out observations at frequencies of 2.3 GHz, 1.7 GHz, 610 MHz and 327 MHz with the VLBA. At the lower frequencies more diffuse jet emission should become more dominant allowing us to trace the development of the jet on larger scales.
Linear sizes and luminosities have been calculated using km s-1 Mpc-1, .
2 Observations
The observations took place on 13th December 1999 using all ten elements of the VLBA in a dual polarization mode at a recording rate of 128 Mb s-1. The data were correlated at the VLBA correlator in Socorro, New Mexico. The observing frequencies were 2.3 GHz, 1.7 GHz, 610 MHz and 327 MHz. The 2.3 GHz and 1.7 GHz data were processed in full polarization mode, but the polarization maps are not presented here. The a priori calibration and self-calibration of the data were performed using the standard programmes in the NRAO Astronomical Image Processing Software (AIPS) package.
In total, a small sample of 5 objects were observed, maps for two of which are presented here.
3 Results
The observed sources were inferred to have significant flux density on intermediate scales from a comparison of their flux densities in previous VLA and VLBI observations at a frequency of 5 GHz. The expected 5 GHz intermediate scale flux densities of the two sources are presented in Table 1. For both of these sources we have been able to image significant emission on larger scales than has been reported in previous observations at higher frequencies.
3.1 1219+285
1219+285 lies in the centre of an elliptical galaxy at a redshift of 0.102 (Weistrop et al., 1985). This source is essentially unresolved to the VLA D array (Kollgaard et al., 1992). The VLBI jet extends to the east of the core and a number of superluminal components have been identified (Gabuzda et al., 1994).
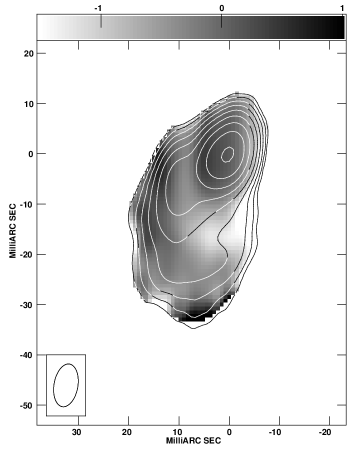
The images in Figures 1 to 4 show a large diffuse extension towards the south roughly perpendicular to the known VLBI jet. There is an apparent change in jet direction visible in the 2.3 GHz data. It is possible that the jet is changing direction from an easterly to a southerly direction and finally in a westerly direction, while also becoming more diffuse. If the jet is curving towards the line of sight then it is also possible that this more diffuse emission from the southern part of the source represents emission from the end of a highly projected jet. However, it is also possible that there is a qualitative change in the jet structure and that the jet itself is becoming diffuse and decollimated. It is also of note that there is a region of enhanced brightness and relatively flat spectral index (perhaps resulting from free-free absorption of a steep spetctrum jet, see Figure 5) in approximately the position that the jet direction apparently begins to change from an easterly to a southerly direction. This may be indicative of an interaction between the jet and the surrounding medium which results in the jet changing direction. Further analysis of the associated polarization data should provide more information on this point.
The expected intermediate scale flux density from comparison of VLA and VLBI images is 0.22 Jy at 5 GHz. The 2.3 GHz image presented here detects approximately 0.11 Jy outside the region which was observed in the previous 5 GHz VLBI observations (Gabuzda et al., 1994). Even allowing for spectral index effects, this represents a large fraction of the missing 5 GHz flux density, although it also suggests that there is significant emission on still larger scales than these observations are sensitive to. It is interesting that no significant new emission becomes visible in the lower frequency 610 and 327 MHz images when compared with the 1.7 and 2.3 GHz images. The sources appear essentially unresolved at these lower frequencies.
At the redshift of this object, 1 mas pc. The luminosity detected in the new, extended structure in this observation is W Hz-1.


3.2 0735+178
No emission lines have yet been identified in the optical spectrum of 0735+178, though a lower limit to the redshift of 0.424 is provided by a pair of absorption lines (Carswell et al., 1974). VLBI images of this source show a compact core and a jet that extends to the northeast (e.g. Gabuzda et al., 1992) while arcsecond scale VLA images reveal a point source (Ulvestad et al., 1983; Kollgaard et al., 1992). 8, 22 and 43 GHz VLBI images reveal a jet out to approximately 10 mas with two sharp apparent bends of 90∘ within 2 mas of the core. It also appears that there was a dramatic change in the trajectory of the jet within the first few mas between 1992 and 1995 (Gómez et al., 1999; Gómez et al., 2001). This could be interpreted either as a precessing jet nozzle or more likely as a result of pressure gradients in the external medium through which the jet propagates (Gómez et al., 2001).
The images presented here show, for the first time, coherent structures in this source on scales of several tens of mas. The sharp twists close to the core reported at higher frequencies are not seen here owing to the low resolution, but the jet appears to turn from its initial easterly direction towards the south at a distance of about 30 mas from the core. The beginning of this bend is apparent in the 2.3 GHz, 1.7 GHz and 610 MHz images. In the 327 MHz image there is a suggestion of emission 100 mas due south of the core which may indicate that the jet continues on its southerly path after the initial turn at 30 mas from the core, although the detection is not strong enough to confirm this.
The flux density in the previously undetected structures, beyond 10 mas from the core, is 0.122 Jy, which, after accounting for the spectral index effects, represents a very large fraction of the predicted intermediate scale flux at 5 GHz of Jy (Gabuzda et al., 1994).
At the lower limit for the redshift of this object, 1 mas pc. The luminosity detected in the new, extended, structure in this observation is therefore W Hz-1.


4 Discussion
It has been suggested that BL Lac objects are low luminosity (FR I) radio galaxies orientated such that Doppler boosting enhances their apparent brightness (e.g. Browne 1983). If this model is valid, the extended structure in BL Lacs should have a similar radio power to that found in the extended structure of FR I radio galaxies. The FR I/FR II luminosity division is – W Hz-1 at 1.4 GHz (Bridle, 1984). Allowing for a spectral index of , this would correspond to a 2.3 GHz division at approximately – W Hz-1.
For the two objects presented here the detected intermediate scale flux density was a large fraction of that expected from the discrepancy between previous 5 GHz VLA and VLBI images. In the case of 0735+178, this may well account for almost all of the intermediate scale “missing” flux. The intermediate scale flux detected for 1219+285 is somewhat less than the predicted intermediate scale flux which means that more flux may lie on larger scales than are probed in this observation.
The luminosity of the intermediate scale emission detected in 1219+285 is W Hz-1. This emission appears to be rather diffuse, and might be associated with a plume-like structure formed by the disruption of the well-collimated parsec-scale jet seen closer to the core. Even if all of this emission is associated with a diffuse unbeamed component, it is at the lower end of the transition region between FR I and FR II radio sources, and so does not pose a problem for associating the diffuse emission in this galaxy with FR I structure.
The intermediate scale flux density detected in 0735+178 appears to be associated with a well-collimated jet, and is therefore likely to be significantly Doppler beamed. For this reason, it is probably not significant that the observed intermediate scale luminosity is above the FR I limit.
5 Conclusions
-
1.
In the two sources presented here, coherent structures extend out to projected distances of pc from the core before disruption.
-
2.
In one case, 1219+285, diffuse – possibly plume-like – emission was detected.
-
3.
The luminosity detected in the intermediate scale structure of 1219+285 presented here was found to be at the lower end of the FR I/FR II luminosity division. 0735+178 had a luminosity in the extended structure above this division, but as the emission appears to be associated with a jet rather than a diffuse component this does not necessarily imply that the source contains FR II extended structure.
Acknowledgements.
The National Radio Astronomy Observatory is operated by Associated Universities Incorporated, under cooperative agreement with the NSF.References
- Bridle (1984) Bridle A. H., 1984, AJ, 89, 979
- Browne (1983) Browne I., 1983, MNRAS, 204, 23
- Carswell et al. (1974) Carswell R., Strittmatter P. A., Williams R. D., Kinman T. D., Serkowski K., 1974, ApJ, 190, L101
- Gabuzda et al. (1992) Gabuzda D. C., Cawthorne T. V., Roberts D., Wardle J., 1992, ApJ, 388, 40
- Gabuzda et al. (1994) Gabuzda D. C., Mullan C., Cawthorne T. V., Wardle J., Roberts D., 1994, ApJ, 435, 140
- Gabuzda et al. (1999) Gabuzda D. C., Pushkarev A., Cawthorne T. V., 1999, MNRAS, 307, 725
- Gómez et al. (2001) Gómez J.-L., Guirado J. C., Agudo I., Marscher A. P., Alberdi A., Marcaide J. M., Gabuzda D. C., 2001, MNRAS, 328, 873
- Gómez et al. (1999) Gómez J.-L., Marscher A. P., Alberdi A., Gabuzda D. C., 1999, ApJ, 519, 642
- Kollgaard et al. (1992) Kollgaard R., Wardle J., Roberts D., Gabuzda D. C., 1992, ApJ, 104, 1687
- Parma et al. (1987) Parma P., Fanti C., Fanti R., Morganti R., de Ruiter H., 1987, A&A, 181, 244
- Stickel et al. (1993) Stickel M., Fried J., Kühr H., 1993, A&AS, 98, 393
- Ulvestad et al. (1983) Ulvestad J. S., Johnston K. F., Weiler K. W., 1983, ApJ, 266, 18
- Weistrop et al. (1985) Weistrop D., Shaffer D., Hintzen B., Romanishin W., 1985, ApJ, 292, 614