Optical and Radio emission from BL Lac objects: long-term trends and structural changes
Abstract
Optical light curves of bright BL Lac objects, in particular those having the SED synchrotron peak at frequencies lower than 1014 Hz, are characterized by long-term trends with time scales of a few decades. These variations are probabily not related to fast perturbations moving down the jet, which have a much faster evolution, but more likely to slow changes of other physical or geometrical parameters, for example the jet direction. In these cases we can expect changes of the inner jet structure detectable with VLBI imaging. Recent literature results are reviewed and discussed in this context.
1 Introduction
BL Lacertae objects are AGNs characterized by a Spectral Energy Distribution (SED) having a non-thermal emission over the entire electromagnetic spectrum. The typical SED shows two broad peaks, one at lower frequencies generally explained by Synchrotron Radiation (SR) from relativistic electrons moving along a jet closely aligned to the observer’s line of sight (Blandford and Rees 1978), and one at higher frequencies originated by Inverse Compton radiation (ICR) from the same electron population. Padovani and Giommi (1995) classified BL Lac objects in two groups based on the maximum frequency of SR peak. The sources with in the range Hz are called Low-Energy peaked BL Lacs (LBL), those with Hz are named High-Energy peaked BL Lacs (HBL).
LBL sources generally show large variations in their emission over a wide range of time scales from minutes to years. Their fast variability, high apparent luminosity and a brigthness temperature exceeding the Compton limit (Kellermann and Pauliny-Toth 1969) imply relativistic boosting, defined by the Doppler beaming factor , where is the bulk Lorentz factor of the electrons in the jet and the angle to the observer’s line of sight. A good estimate of is relevant to understand the physics of BL Lacs. Furthermore, can change during the source life time implying large variations of the mean apparent flux ().
Optical emission in LBL sources is thought to be the high frequency tail of the SR component. Therefore, one can expect to observe a correlation with changes observed in the radio band. When historic optical light curves are available, it is found that variations can also occur over time scales of several decades. Large flux changes with much shorter time scales are typically superposed to these long term trends. In particular, the secular variations can be reasonably associated with changes in the structure and/or direction of the inner jet. VLBI images are then very useful to obtain informations on the evolution of the Doppler factor .
In this contribution we present the possible correlation between changes in the optical luminosity as observed for LBL sources and the variability observed in their VLBI radio structures. Many of these sources are also important targets for the coming space missions for high energy astrophysics like and .
2 Optical historic light curves and monitoring
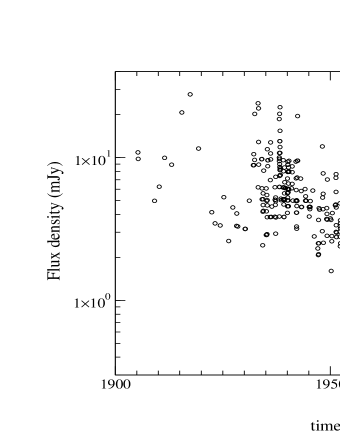
Historic light curves of BL Lac objects can be obtained only from photographic plate archives. They are usually not well sampled over the maximum time interval of about a century. An example is the light curve of OQ 530 shown in Fig. 1 (Massaro et al. 2004a). Photographic magnitudes were obtained by Miller (1978) from the Harvard archive and have been corrected to match the photometric band (Nesci and Massaro 1999). Note the long term trend with a mean decreasing rate of about 15-20% in ten years.
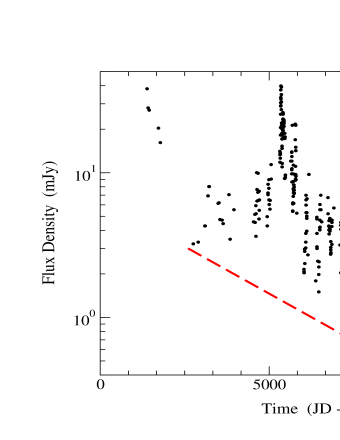
For the well known source OJ 287 the analysis of the historic data indicated the existence of recurrent large flares with a period of 11.95 years (Sillanpää et al. 1988) confirmed by the outburst observed in 1994. A photometric light curve of OJ 287 in the , covering the past 30 years, is shown in Fig. 2. Note, in addition to the main oubursts of 1982 and 1994, the decreasing trend up to Spring 1999 when the source luminosity reached its minimum. After that epoch the brightness of OJ 287 started to increase at a rate higher than that of the decreasing part. These long term trends have been indicated in Fig. 2 by the dashed tick line drawn following the local minima. Note also that the highest flux level reached by OJ 287 in the outburst of 1994 is about one third of that of 1982 maximum and seems roughly proportional to the mean flux. If the periodic recurrence of these oubursts will be confirmed in future, the next one, expected for 2006, could reach a flux comparable or even higher than that of 1982.
Another well studied source is ON 231 (Massaro et al. 2001). Its behaviour was characterised by an increase of the mean brightness after a minimum in the early seventies culminated in a very strong outburst in April-May 1998 (Massaro et al. 1999). After that event the mean source luminosity slowly declined, continuing to show changes greater than one magnitude (Tosti et al. 2002).
The amount of available data on variability of bright LBL objects has largely increased in the past ten years thanks to the use of small aperture telescopes equipped with CCD detectors. It is now simple to make these instruments fully automatic obtaining a very high observational efficency. Automatic optical monitoring provided very well sampled light curves for several sources (see for instance http://astro.fisica.unipg.it/PGblazar/tabella2000.htm). They provide prompt information on the onset of active phases, important to trigger observations from space X- and -ray observatories. The best known case is that of BL Lac itself which, after a rather quiescent phase, in 1997 showed a very intense activity characterized by a very high luminosity and a large intraday variability.
In the radio band LBL objects are also variable but generally not so violently variable as in the optical. Monitoring observations in the GHz range are important to search for correlations between optical and IR data, useful to investigate the radiative life times of relativistic electrons. The most continuous radio monitoring programs have been carried out for several years by the groups of the University of Michigan (http://www.astro.lsa.umich.edu/obs/radiotel/radiotel.html) and of the Metsahövi Radio Observatory (http://kurp-www.hut.fi/quasar/; Ciaramella et al. 2004).
3 The Spectral Energy Distribution
To better understand the link between the optical and the radio emission in LBL sources it is important to have a good description of the broad band spectral properties of the SR. Non-thermal spectra are generally well fitted by single power laws over frequency intervals of the order of one decade. However, on wider intervals power law models fail to reproduce the observed mild curvature. Landau et al. (1986) showed that the spectra of some BL Lac objects from radio to the optical and UV ranges are represented by a parabola in lograrithmic coordinates
| (1) |
better than an exponential cut-off. Here the SED curvature is described only by the parameter . This spectral law has been used successfully to fit the X-ray SEDs for the HBL sources Mkn 421 and Mkn 501 (Massaro et al. 2004b,c) in a variety of luminosity states. This implies that the electron spectra also show a similar distribution, which can be obtained from statistical acceleration mechanisms when the probability for a particle to remain inside the acceleration region decreases with the energy of the particle itself. Alternatively, when the particle energy remains below a critical value the acceleration probability is constant and therefore the resulting spectrum is given by a power law and changes into a log-parabola when the accleration probabilty decreases. The resulting SR spectrum can be then approximated by
| (2) |
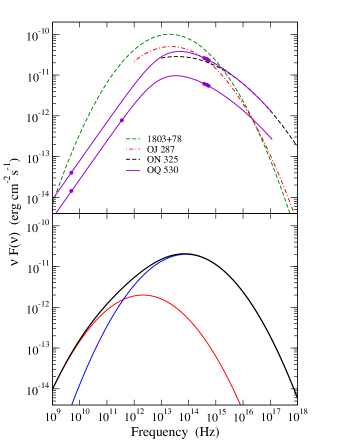
Some spectra of the SR observed from LBL objects are plotted in the upper panel of Fig. 3. Equation (2) has been used for the two spectra of OQ 530, while Equation (1) for the remaining sources.
Another interesting possibility is that presented in Fig. 3 (lower panel) in which there are two SR components peaking at different frequencies. The two spectra were computed using the same values of as the electron populations were accelerated by similar processes. They could be originated in different regions along the jet and evolve with different time scales. Simultaneous broad band observations may not provide enough information to distinguish the two components, while variability studies can give the most useful information.
4 VLBI imaging
VLBI imaging of BL Lac objects is important because we can obtain direct information on the evolution of the inner jet structure. Furthermore, polarisation measurements allow us to know the orientation of the magnetic field (see for instance Gabuzda et al. 1999, 2004). At the typical distances of bright BL Lacs objects, say , the VLBI angular resolution at 5 GHz corresponds to distances of few parsecs. As a consequence, only structure changes involving time scales of years can be detected. Images at higher frequencies (say 43 GHz) are very useful to investigate the variations on shorter time scales. However, observations at lower frequencies are needed to define the spectral behaviour. Savolainen et al. (2002) applied a model for the time evolution of radio flares of a blazar sample, including some LBL objects, observed at 22 and 43 GHz. Their analysis was successful in describing events with typical time scales of one-two years. They showed that in more than 50% of the sources, a new VLBI component appeared in the jet after a total flux density flare. Usually these components brighten and decay within 0.15 mas of the radio core. This result supports the interpretation that flares are originated by a sudden energy injection from the core. Subsequent shocks propagate in the jet and are associated with superluminal components. For faster variations, like those frequently observed in the optical for LBL sources which evolve on time scale of a month or even shorter, new components emerging from the core cannot be easily seen. They are likely exhausted before they can reach an angular separation large enough to be resolved out by VLBI.
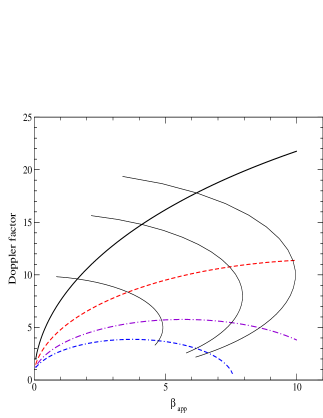
Long term optical trends are likely originated by different and more regular processes. An interesting possibility is that of a precessing jet, which implies a change of and consequently of the Doppler factor . One can expect to observe a relation between the superluminal velocity of the new born components and the observed total core luminosity. This relation is shown in Fig. 4 where the Doppler factor is plotted as a function of (Blandford and Königl 1979). For smaller than about 8∘, an increase of would imply a higher superluminal velocity corresponding to a fading of the luminosity and . Of course, it is not easy to separate such an effect from those due to short time changes. Dense radio-optical and VLBI monitorings (typically twice a year) are here required.
Evidence for a precessing jet nozzle in BL Lacertae has been recently found by Stirling et al. (2003) using a series of VLBA high resolution and polarisation images at 43 GHz taken from March 1998 to April 2001. They estimated a period of 2 years. There is a very large amount of optical data on this source, in particular after the large outburst of 1997, however, a complete analysis has not been carried out. Fan et al. (1998) analysed the historic light curve of BL Lacertae and found several recurrence times (one of them of about 2 years). Further investigations to confirm this result, in particular on the phase of the periodic changes, are necessary. Furthermore, this analysis would be useful to understand if the spectrum of the SR observed in the optical extends to the radio band or if it is generated by a different component.
EVN images at 5GHz of OQ 530, recently presented by Massaro et al. (2004a), show a bright radio core and a rather weak jet. Optical and radio light curves are charaterized by a low luminosity phase at the beginning of 1999 and they start to brighten later on. Simultaneous optical and radio observations (February 1999 and June 2001) indicate a similar increase of the core flux in the band and at 5 GHz (Fig. 3 in Massaro et al. 2004a) consistent with a unique SR emission component.
An interesting point to rise discussing the structure of BL Lac objects (and more in general for blazars) is the presence of stationary components detected near the core. In the extensive VLBI monitoring at 22 and 43 GHz on a sample of 42 -ray loud blazars, including 11 LBL objects Jorstad et al. (2001) and Marscher et al. (2002) found stationary components within a distance of 2 mas from the core in 27 sources. They proposed that those components could be associated with a standing hydrodynamical compression. In such a case some components may appear blended in a single feature without a significant proper motion making it difficult to detect superluminal motion in the inner part of the jet.
Finally it is worth to mention the case of ON 231 (Massaro et al. 2001; Mantovani & Massaro, this conference) were a component not previously detected was observed on the opposite side of the jet with respect to the radio core. Again, the change of the direction of the jet, occurring after the Spring 1998 optical flare, was considered as a possible explanation for such unusual structure.
5 Conclusions
The next ten years will be very interesting for the astrophysics of BL Lac objects. These sources and Flat Spectrum Radio Quasars, grouped together in the Blazar class, are charaterized by a strong and variable non-thermal emission. For this reason they are the most numerous extragalactic -ray sources and are also well detected in the IR range. The majority of the 208 sources detected by (Bennett et al. 2003) are indeed blazars (Giommi & Colafrancesco 2004).
Two high sensitivity space observatories, well suited to observe BL Lac objects, will be operative in the next three years: for rays above 30 MeV and (30 GHz – 857 GHz). It is expected that at least a few thousands sources will be detected. It is important at this stage to select a sample of target sources planning a monitoring programme both in the radio and optical bands. In particular, it will be very useful to plan for a monitoring programme with high resolution radio interferometers to obtain detailed information on milli-arcsecond scale structural changes and brightness variations of the broad-band synchrotron emission.
Optical variability plus VLBI imaging can also be useful to verify the unified scheme model for BL Lac objects. According to that interpretation, the relativistic effects are relevant when the angles between the jet direction and the observer’s line of sight are small. When this angle increases the source becomes fainter, its variability time scale becomes longer and, at large angles the source should appear as a FRI radiogalaxy (Ghisellini et al. 1993). Some BL Lac objects are rather faint in the optical while their radio flux is relatively high. The synchrotron peak frequency of these sources is rather low, Hz. We will refer to them as Very Low energy peaked BL Lac objects, (shortly VLBL). In the unification scenario VLBL objects could have Doppler factors smaller than that of typical LBL sources. Their behaviour should be intermediate between these sources and FRI radio galaxies. Unfortunately, too few data and images are available for this ’class’ of objects. Therefore no firm conclusions can be at present derived. It will be then useful to plan coordinated observational programs for a sample of VLBL objects to investigate their main properties. In particular, simultaneous broad band observations are needed to have information on the SED and VLBI observations the detect superluminal motions of the jet components to estimate the Doppler factor.
Acknowledgements.
We are grateful to Paolo Giommi, Roberto Nesci, Matteo Perri and Gino Tosti for useful comments and discussions.References
- [2003] Bennett C.L. et al. 2003, ApJS 143, 97
- [1978] Blandford R.D., Rees M.J. 1978, Phys. Scripta 17, 265
- [1979] Blandford R.D., Königl A. 1979, ApJ 232, 34
- [2004] Ciaramella A., Bongardo C. et al. 2004, A&A 419, 485
- [1998] Fan,J.H., Xie G.Z. et al. 1998, ApJ 507, 173
- [1999] Gabuzda D.C., Pushkarev A.B., Cawthorne T.V. 1999, MNRAS 307, 725
- [2004] Gabuzda D.C., Murray E., Cronin P. 2004, MNRAS 351, 89
- [1993] Ghisellini G., Padovani P. et al. 1993, ApJ 407, 65
- [2004] Giommi P., Colafrancesco S. 2004, A&A 414, 7
- [2001] Jorstad S.G., Marscher A.P. et al. 2001, ApJS 134, 181
- [1969] Kellerman K.I., Pauliny-Toth I.I.K. 1969, ApJ 155, L71
- [1986] Landau R., Golisch B. et al. 1986, ApJ 348, 14
- [2002] Marscher A.P., Jorstad S.G. et al. 2002, ApJ 577, 85
- [1999] Massaro E., Maesano M. et al. 1999, A&A 342, L59
- [2001] Massaro E., Mantovani F. et al. 2001, A&A 374, 435
- [2004] Massaro E., Mantovani F. et al. 2004a, A&A 423, 935
- [2004] Massaro E., Perri M. et al. 2004b, A&A 413, 489
- [2004] Massaro E., Perri M. et al. 2004c, A&A 422, 103
- [1978] Miller H.R. 1978, ApJ 223, L67
- [1999] Nesci R., Massaro E. 1999 Proc. ”Treasure-Hunting in Astronomical Plate Archives”, (P. Kroll, C. La Dous, H.-J. Brauer eds.), Sonneberg,p. 111
- [1995] Padovani P., Giommi P. 1995, ApJ 444, 567
- [2003] Perri M., Massaro E. et al. 2003, A&A 407, 453
- [2002] Savolainen T., Wiik K. et al. 2002 A&A 394, 851
- [1988] Sillanpää A., Haarala S. et al. 1988, ApJ 325, 635
- [2003] Stirling A.M., Cawthorne T.V. et al. 2003, MNRAS 341, 405
- [2002] Tosti G., Massaro E. et al. 2002, A&A 395, 11