Blue and IR Light Curves of the Mysterious Pre-Main Sequence Star V582 Mon (KH 15D) from 1955 to 1970
Abstract
In recent years, an increasing number of publications have been addressed to the peculiar and mysterious pre-main sequence star V582 Mon, also known as KH 15D. This extraordinary T Tauri star, located in the young star cluster NGC 2264, appears as to be an eclipsing variable. In the present paper, we report a unique and self-consistent set of light curves in the blue and near-infrared bands, spanning a 15-year interval (epoch 1955-1970). Our photometric data show clearly the beginning of the eclipse stage occurred in early 1958 in the blue, and perhaps around four years later in the infrared. The light curve period turns out to be the same reported by recent observations (about 48.3 days), so that no evidence for a period change results. On the other hand, in our data the light curve shape appears as sinusoidal and is therefore different from the one displayed today. The photometric behaviour, determined with time-series and colour-index analysis, suggests that V582 Mon (KH 15D) could be initially surrounded by an accretion disk/torus seen edge-on, with subsequent thin dust formation at the beginning of the blue radiation absorption. The dust could then aggregate into larger particles providing the transition between selective and total absorption, accompanied with eclipsing variability in the infrared. The minima of the periodic light curve become deeper due to the increasing dimension and number of dust grains, and then flattens due to a contraction in the disk.
keywords:
stars: individual (V582 Mon) — stars: individual (KH 15D) — stars: variables: other — stars: pre-main sequence — stars: circumstellar matter — techniques: photometric — stars: planetary systems: protoplanetary disks1 Introduction
The variable star V582 Mon ( was discovered by Badalian & Erastova (1972). It is classified as a type INS (i.e. Orion variable with rapid light changes: up to mag in 1–10 days) in the GCVS (Kholopov, 1985). This star was re–discovered as an eclipse variable by Kearns & Herbst (1998) during a systematic study of young star variability in the region of the cluster NGC 2264.
![[Uncaptioned image]](/html/astro-ph/0412259/assets/x1.png)
|
The star, named 15D in a list of 209 objects (Kearns et al., 1997), appeared as an eclipsing variable with an amplitude of about 3 mag in the (Cousins) band, with a period of 48-49 days. This was a unique case among the very young stars observed as discussed by Kearns et al. (1997). The star is also designated as n. 150 in the list of Park et al. (2000) and as n. 391 in the list of Flaccomio et al. (1999).
The depth (3.5 mag) and the long duration of the eclipse (about 40% of each cycle, which lasts for 48.4 days) rule out a companion star as the cause of this event (Hamilton et al., 2001; Herbst et al., 2002). Polarization levels of 2% observed at half eclipse and observed out of the eclipse (Agol et al., 2004), would imply that the obscuring material is composed of rather large particles.
|
In order to explain these phenomena, two hypotheses were formulated: 1) a double star obscured in different ways by circumstellar matter; 2) a single star surrounded by a peculiarly warped or ridged proto-planetary disk. In the second case, the light of the star is periodically intercepted by this dusty ridge orbiting around the star in a plane placed edge-on with respect to the line of sight.
Actually, there is a large consensus that the eclipses are caused by circumstellar material, but it is not clear what is the composition and the spatial distribution of this material.
![[Uncaptioned image]](/html/astro-ph/0412259/assets/x3.png)
|
Theories include an edge-on circumstellar disk with a mass density wave or a disk deformation induced by a proto-planet (Hamilton et al., 2001; Herbst et al., 2002; Winn et al., 2003; Agol et al., 2004), an orbiting vortex of solid particles (Barge & Viton, 2003), and an asymmetric common envelope (Grinin & Tambovtseva, 2002). V582 Mon (KH 15D) is quite unique and extremely interesting because the fortuitous alignment may allow us to study the circumstellar (or even protoplanetary) processes, and because the eclipse provides a natural ”coronagraph” that can be used to map out the environment of the underlying T Tauri star (Hamilton et al., 2003; Agol et al., 2004; Deming, Charbonneau, & Harrington, 2004). In fact, this object should be a weak-line T Tauri star, still accreting matter from a circumstellar disk and endowed with a well-collimated bipolar jet (Hamilton et al., 2001). High resolution near-IR spectroscopy revealed the presence of prominent molecular hydrogen emission probably due to shock excitation of the ambient gas by a bipolar outflow from the circumstellar disk (Deming, Charbonneau, & Harrington, 2004). As evidence of this hypothesis, there is also the observation of Tokunaga et al. (2004), who revealed clearly an H2 emission filament next to the central star. Furthermore, spectro-polarimetric observations suggest that the star is completely eclipsed, so that the flux during the eclipse is entirely due to scattered light. The scattering should be due to large dust grains (m) similar to the interplanetary grains that scatter the zodiacal light (Agol et al., 2004). Recent high-resolution spectroscopic monitoring showed that V582 Mon is a single-line spectroscopic binary (Johnson et al., 2004). A model of gradual opaque-screen occultation was proposed by Winn et al. (2004), and a model with an eccentric binary that is encircled by a vertically thin, inclined ring of dust and gas was suggested by (Chiang & Murray-Clay, 2004) in order to explain the available historical light curve prior to the present work.
The light curve of V582 Mon (KH 15D) from 1967 to 1982, based on the Asiago Observatory infrared plates, displays a periodic alternation between bright and faint states with a constant period of 48.35 days (Johnson & Winn, 2004). An international observation campaign during 2001-2002 showed clearly a periodic variability recurring with a period of days (Herbst et al., 2002). Observations during six seasons from 1995 to 2001 showed again a periodical variability like an eclipsing binary, with a period of days (Hamilton et al., 2001). On the other hand, the analysis of the Harvard College Observatory archival plates from 1913 to 1951 showed that there was no variability, and the deep eclipses observed today did not occur in the first half of the 20th century (Winn et al., 2003). In that work, the need for further, more recent archival images was underlined, as they might have shown the onset of eclipses.
In our paper, we present the results of the analysis of the plate images obtained by one of us (PM) during 15 years in a systematic study of the variability of young stars in the cluster NGC 2264. The data presented and discussed here pertain to the star V582 Mon (KH 15D) and concern the observations performed in the blue () and near-infrared () bands between October 13, 1955 and March 1, 1970. With these data, it is possible to determine when and how the eclipse phenomenon occurred, its first evolution, and the subsequent dramatic variations.
2 Observations
The field of the young cluster NGC 2264 was photographed in the winter season 1955-56 with the 0.6m Loiano (Bologna, Italy) and the 1.2m Asiago (Vicenza, Italy) telescopes. These observations led to the discovery of 33 new variable stars, studied jointly with the other known 78 variable stars (Rosino, Grubissich, & Maffei, 1957). In this systematic study, V582 Mon (KH 15D) was not detected as a variable star.
In the subsequent years, the search was extended by PM to the neighboring region of this cluster. In 15 years, 183 blue and 99 photographic infrared plates were obtained, with five different telescopes. Table 1 shows the distribution of the photographic material collected. The number of plates used does not include some bad plates (e.g. scratched, or partially lighted, or with a covering halo due to the bright star in the field), and it does not comprise few underexposed plates (in which the magnitude of the variable star was much fainter than the limit-magnitude of the plate). Hence these latter plates (about ten in ) were not useful to set meaning upper limits.
The merit of the material used in this work lays in its uniformity. In the blue, an emulsion 103a-O without filter was used. In the photographic-infrared, an emulsion I-N hypersensitized with an RG5 filter was used. The I-N/RG 5 combination transmits the spectral range 6800-8800 Å, and has a transmission curve similar to the 7000-9000 Å bandpass of the Cousins band. Moreover, a large fraction of the plates (about 60%, see Tab. 1 and Tab. 2) were obtained with the 0.60m Loiano reflector and the 0.90/0.65m Asiago Schmidt telescope, having the same focal length (210 cm) and almost the same focal ratio (f/3.50 and f/3.23 respectively).
The irregular variability of the studied stars required a high frequency in the plate collection. As a consequence, for V582 Mon (KH 15D), a series of long duration observations (except for the seasonal, weather and full-moon interruptions) are available, in the years when the star began to show its variability and during the first evolution phases. For the first years this is true especially for the blue plates; for the subsequent years also in the infrared ones.
The magnitudes of comparison stars were taken from the blue photoelectric and photographic sequences of Walker (1956), after removing stars that appeared variable afterwards. The calibrations curves were constructed using the best two plates among the five ones obtained with the Schmidt telescope of the Hamburg-Bergedorf Observatory. The infrared comparison sequence was assembled using stars having a know colour index (Walker, 1956) by means of the transformation formulae given by Allen (1955), taking care to choose only the non-reddened stars from the colour-colour-diagram vs .
The magnitudes of V582 Mon (KH-15D) were determined through visual estimates with respect to its closest comparison stars. A stereoscopic Zeiss microscope at low and variable magnification was used. This method allows a comparison of the measurememts obtained with different telescopes. For example, in the plates obtained with the Loiano reflector, the star falls in a region affected by coma, however the eye can perform a good estimation when comparison stars of comparable coma are chosen. On the basis of the thousands of magnitude estimations done with the above mentioned instruments, we estimate the mean errors in the magnitude estimations are: mag for the 0.6m Loiano reflector plates, mag for the 1.2m Asiago reflector plates, and mag for the two 0.50/0.40m and 0.90/0.65m Asiago Schmidt telescope plates respectively.
3 Data Analysis and Results
Part of the analysis of the plates taken around NGC 2264 was published in Maffei (1966a, b). The detailed study of the more than 200 variable stars identified in the area of NGC 2264 (about one square degree) is an ongoing project. At present, this effort has been devoted to the variable V582 Mon (KH-15D).

|
|
|

|

|

|

|
The infrared plates obtained with the two Asiago Schmidt telescopes were made available to J. A. Johnson, who analyzed the data and published a first set of results in Johnson & Winn (2004).
As shown in Tables 1 and 2, the blue light curve is better sampled. However for the years 1967-70, the number of useful plates is nearly equal for the two colours, since after the positive results obtained with the first observations in the infrared, PM decided to take both blue and IR images for every available observing night.
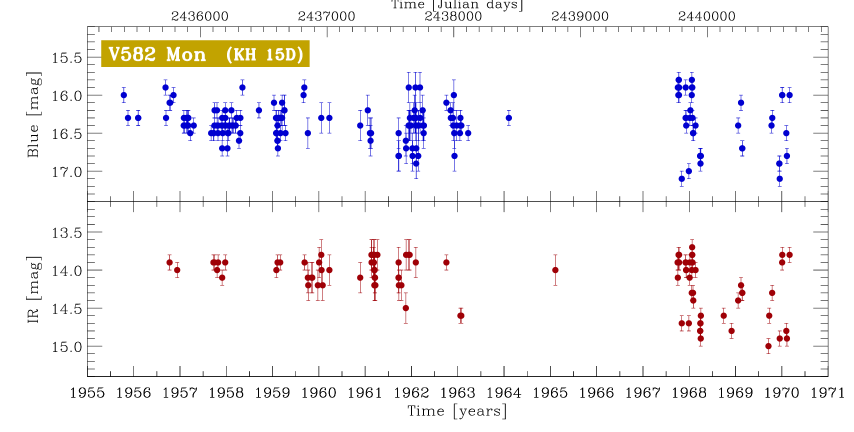
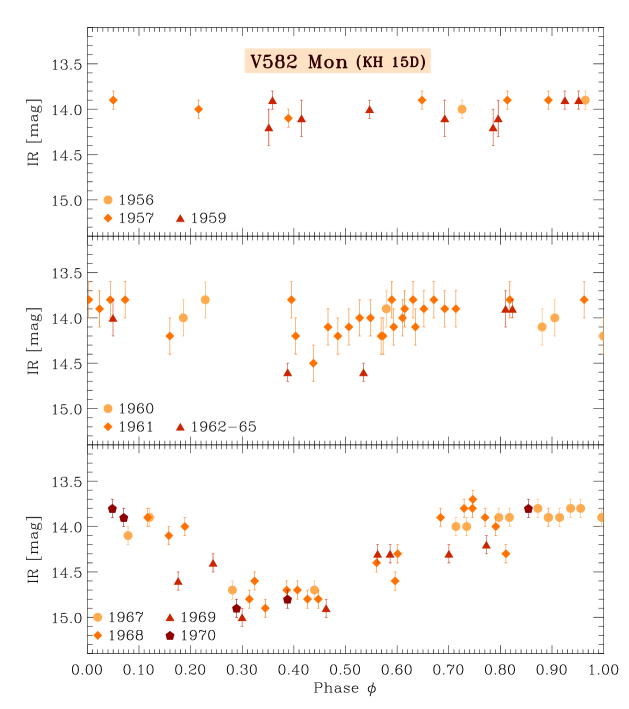
In the blue, V582 Mon appears with a constant magnitude from 1955 to 1957 (Fig. 1). The first clear sign of a significant weakening (0.4 mag) was observed on January 8, 1958. In the infrared, the star appeared with constant magnitude in the subsequent 4 years, and a first sure weakening (0.5 mag) is observed on November 16, 1961 (Fig. 1).
3.1 Temporal Analysis
In addition to the classical phase analysis, the temporal analysis of the data was carried out using well tested and robust techniques suitable for an unevenly sampled time series: the Lomb-Scargle periodogram (LSP), the first order structure function (SF), the discrete auto-correlation function (DACF), and the phase dispersion minimization (PDM) method . These methods allow to investigate quantitatively the statistical temporal structure of variability, the auto-correlations, and the existence of characteristic time scales and periodicity.
The SF is equivalent to a power spectrum calculated in the time domain. It provides information on the type of variability and the range of the characteristic time scales that contribute to the fluctuations (see, e.g. Rutman, 1978; Simonetti, Cordes, & Heeschen, 1985). Steep drops in the SF indicate small variance and provide the signature of possible characteristic time scales, while the slope in the log-log representation gives the value of the power law spectrum index, and thus the nature of the variability. The DACF allows to investigate the level of auto-correlation in unevenly sampled data sets (see, e.g. Edelson & Krolik, 1988; Hufnagel & Bregman, 1992) without any interpolation. The number of points per time bin can vary greatly in the DACF, but data bins by equal population can be built together with Montecarlo estimations for peaks and uncertainties as in the Fisher -transformed DACF (ZDACF, Alexander, 1997). The LSP is a technique analogous to the Fourier analysis for discrete unevenly sampled data trains, useful to detect the strength of harmonic components with a certain angular frequency (see, e.g. Scargle, 1982; Horne & Baliunas, 1986). Finally, the PDM method (see, e.g. Stellingwerf, 1978; Jurkevich, 1971) seeks to minimize the variance of the data at constant phase with respect to the mean value of the light curve. The PDM method has no preference for a particular periodical shape, it incorporates all the data directly into the test statistic and it is thus well suited to small and randomly spaced samples. A value is statistically significant when the PDM drops near zero.
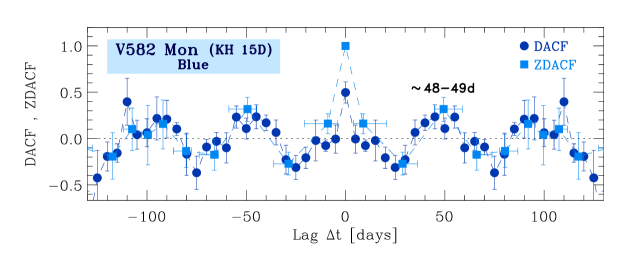
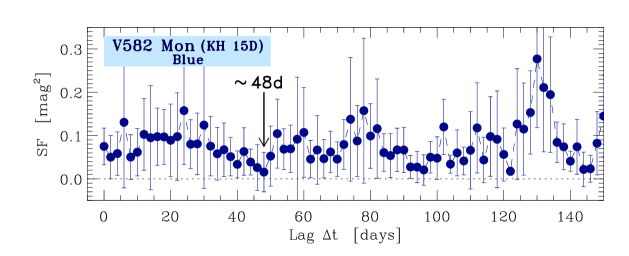
In Fig. 2 we plot the LSP, DACF and ZDACF, SF, and PDM for the blue light curve data in the best sampled interval JD 2436102 (1957.725) to JD 2438111 (1963.225). The timescale corresponding to the significative peak is days for the LSP. The DACF and ZDACF also show a weak (value ) peak for a time lag at around 48-49 days. Both the SF and the PDM show a drop around the same value.
The apparently stable periodicity of the fluctuation is first observed in 1958. The period is in good agreement with that found in recent years with well sampled data. On the other hand the blue light curve does not display any characteristic timescale or periodical feature before 1958 (Fig. 3), reinforcing the evidence for a beginning of the eclipses around the first months of 1958.
The temporal analysis of the infrared light curve for 1957-1963 does not show any significant feature above statistical fluctuations in the LSP, DACF, SF, and PDM plots (upper panel of Fig. 4), which indicates no corresponding variability and periodicity in the infrared in these years. We believe that the variability occurred only some years later (possibly about 4 years later) in the infrared based on the periodical behaviour in the IR displayed in the last interval of our light curve (lower panel of Fig. 4), and by the colour analysis in Par. 3.4.
3.2 Blue Light Curve
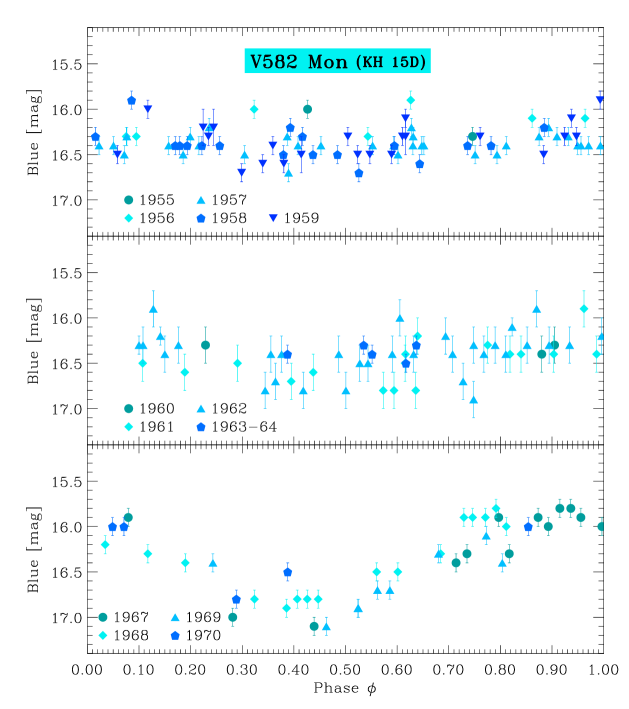
After the first weakening, the variability amplitude increased until about 1.2 mag from the end of 1967 to the beginning of 1970. Applying the phase periodical analysis, the maximum probability period is 48.5 days, very similar to the ephemeris outlined by Herbst et al. (2002). The phase light curve constructed with the observations from 1967 to 1970, adopting the ephemeris of Herbst et al. (2002), shows a marked regularity.
Figure 5 shows the optical blue magnitude light curve of V582 Mon (KH 15D) as a function of the phase for our data. All the data points reported in the plot are real observations. The eclipses appear clearly to start at the end of the 1950s.
|
The periodic variability in the subsequent years up to the 1970 seems rather sinusoidal, with slow decreasing and increasing stages and no evident plateaus, contrary to more recent observations. A phase shift of the light curve minimum was found in the infrared also by Johnson & Winn (2004).
3.3 Infrared Light Curve
The same behaviour is displayed by the infrared magnitude light curve in Fig. 6. In the photographic infrared (similar to the band as mentioned above) after the first weakening the amplitude increases, beginning in 1968, by 1.2 mag. The minima are coincident with those observed in the blue. The phase-constructed light curve shows a flat minimum in the years 1967-1970, similar to that observed in 1995, however it represents a smaller fraction of the period (0.2) than in the more recent data (0.4). The observed maximum does not appear as a pronounced plateau, as seen in recent observations. In addition, the transition between minimum and maximum values is much slower (0.2 against 0.07 in phase units); the infrared light curve is better described by a sinusoidal function rather than by a step-like structure, as observed in 1996-2002.
The infrared maximum appears approximatively at the same level as in recent years. We do not see a clear weakening, as instead suggested recently in the infrared magnitudes measured in the real Cousin band. We must however cautiously underline that the two photometric systems are not identical. On the other hand, the variability amplitude increased from 1 mag to 3 mag.
|
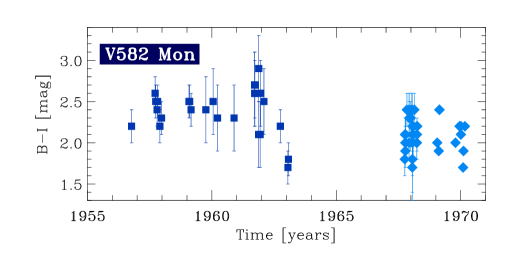
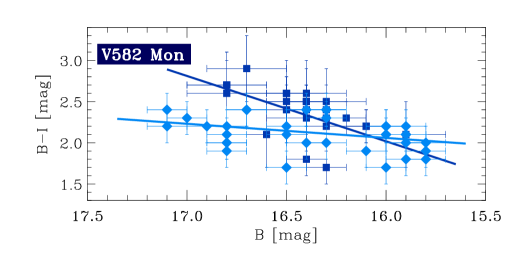
3.4 Colour Indexes
The suggested 4-year difference in starting times between the blue and the IR periodicity is supported by the analysis of the colour indexes. For the calculation of the the index, we selected only the data from the two bands which were coincident within an interval of 1 day. Figure 7 shows the behaviour of the colour index in time as well as the correlation with the blue brightness, which fact confirms and underlines our finding that the beginning of the infrared variability occurred some years later (possibly 4-years) after that in the blue. In fact, the index shows a colour excess and a variability for 1955-1963, while it tends to remain constant in subsequent years (Fig. 7 upper panel). Moreover, the scatter plot versus shows a steeper trend for the 1955-1963 data, implying that the star became redder while fainter during these years. We point out that there are several parallel B and I observations within one day, to support this hypotheses. Only in the subsequent years (1967-1970) does the behaviour of the colour index not depend on the source brightness, implying that the star shows the same periodical behaviour in the blue and infrared bands.
|
|
4 Discussion and Conclusions
We have presented the results of a long-term series of observations of the variable star V582 Mon (KH 15D) in the cluster NGC 2264, performed in the blue and near-infrared bands between October 13, 1955 and March 1, 1970. This set of homogeneous data in two colours is unique to our knowledge for this period and reveals the start of the eclipse phase of V582 Mon in the two colours.
The analysis of our data provides the following important results:
-
1.
in the blue, the star showed the first magnitude variations at the beginning of 1958;
-
2.
in the near infrared, the first magnitude variation was observed roughly 4 years later;
-
3.
over the above 4 year period the star showed an infrared excess, at least around minima.
-
4.
the period did not change;
-
5.
the shape of the light curve appears different from the present one, i.e. a sinusoidal function rather than a curve with flat minima and maxima, as in Kearns & Herbst (1998).
A possible model to explain these characteristics and their evolution would be the following. Until 1958, V582 Mon (KH 15D) was surrounded by an edge-on disk or gaseous torus, which did not cause variations in the brightness. Subsequently, thin dust, able to absorb the blue radiation (but not the IR radiation) began to form, distributed as a sort of “banana” as in the model proposed by Barge & Viton (2003), but with nearby, or extended thinner edges as indicated by the absence of a flat maximum. Afterwards the dust aggregated into larger particles, and the selective absorption became total absorption. Due to the increasing number and dimension of the dust grains, the observed minima deepen. At the same time, the “banana” dust cloud (or its denser part) contracted, creating wider, flattened minima and steeper variations of the brightness to reach the actual shape and values of the light curve (Winn et al., 2004). This suggests the presence of a body or agglomerate of dust and/or stones less extended but denser and with sharper edges.
These hypotheses imply that in the last 40 years we have observed the birth of a giant planet near the star, as that discovered (with other techniques) in other nearby stars (see, e.g. Butler, 2003; Marcy & Butler, 1998). More likely, we advance the notion of the formation of a blob of material, from which one or more planets could form, or that could dissolve or evolve in an unforeesable way. This is supported by the fact that V582 Mon (KH 15D) is a pre-main sequence star, i.e. in formation. Our data does not exclude other models. In any case, any proposed model must take into account the non-variability prior to 1958, the progressive increase of the absorption, the interval of 4 years separating the beginning of the blue and infrared variability and above all, the transformation from a sinusoidal light curve to an actual step-like structure characterized by flat maxima and minima. We believe that the evolution of this unique and peculiar stellar object must be followed in the future with several different instruments, and in particular with the same photometric and spectroscopic techniques used in the past.
5 Acknowledgments
The authors wish to thank the referee W. Herbst for very useful
comments that helped to improve this work.
M. Busso (Perugia University) and W. J. Burger (INFN-Perugia) are
gratefully acknowledged for their contribution in the final
revision of the paper.
References
- Alexander (1997) Alexander, T. 1997, in Astronomical Time Series, Eds. Maoz, Sternberg & Leibowitz, Dordrecht: Kluwer, p. 163
- Allen (1955) Allen, C. W. 1955, Astrophysical Quantities, London: Athlone, 180
- Agol et al. (2004) Agol, E., Barth, A. J., Wolf, S., Charbonneau, D. 2004, ApJ, 600, 781
- Badalian & Erastova (1972) Badalian, H. S. Erastova, L. K. 1972, Soobshch. Byurakan Obs. n. 44
- Barge & Viton (2003) Barge, P. Viton, M. 2003, ApJ, 593, L117
- Bryden et al. (2000) Bryden, G., Różyczka, M., Lin, D. N. C., Bodenheimer, P. 2000, ApJ, 540, 1091
- Butler (2003) Butler, P., in Placet and Life: the Emerging Science of Astrobiology, Baross, J. Sullivan, W. eds., Cambridge Univ. Press
- Chiang & Murray-Clay (2004) Chiang, E. I. & Murray-Clay, R. A. 2004, ApJ, 607, 913
- Deming, Charbonneau, & Harrington (2004) Deming, D., Charbonneau, D., Harrington, J. 2004, ApJ, 601, L87
- Edelson & Krolik (1988) Edelson, R. A., Krolik, J. H. 1988, ApJ, 333, 646
- Flaccomio et al. (1999) Flaccomio, E., Micela, G., Sciortino, S., Favata, F., Corbally, C., Tomaney, A. 1999, A&A, 345, 521
- Grinin & Tambovtseva (2002) Grinin, V. P. Tambovtseva, L. V. 2002, Astronomy Letters, 28, 601
- Johnson & Winn (2004) Johnson, J. A. Winn, J. N. 2004, AJ, 127, 2344
- Johnson et al. (2004) Johnson, J. A., Marcy, G. W., Hamilton, C. M., Herbst, W., Johns-Krull, C. M. 2004, AJ, 128, 1265
- Jurkevich (1971) Jurkevich, I. 1971, Ap&SS, 13, 154
- Hamilton et al. (2003) Hamilton, C. M., Herbst, W., Mundt, R., Bailer-Jones, C. A. L., Johns-Krull, C. M. 2003, ApJ, 591, L45
- Hamilton et al. (2001) Hamilton, C. M., Herbst, W., Shih, C., Ferro, A. J. 2001, ApJ, 554, L201
- Herbst & Hamilton (2003) Herbst, W. Hamilton, C. M. 2003, ASP Conf. Ser. 294: Scientific Frontiers in Research on Extrasolar Planets, 231
- Herbst et al. (2002) Herbst, W., Hamilton, C.M., Vrba, F.J., Ibrahimov, M.A., Bailer-Jones, C.A.L., Mundt, R., Lamm, M., Mazeh, T., Webster, Z.T., Haisch, K.E., et al. 2002, PASP, 114, 1167
- Horne & Baliunas (1986) Horne, J. H., Baliunas, S. L. 1986, ApJ, 302, 757
- Hufnagel & Bregman (1992) Hufnagel, B. R., Bregman, J. N. 1992, ApJ, 386, 473
- Kearns & Herbst (1998) Kearns, K. E. Herbst, W. 1998, AJ, 116, 261
- Kearns et al. (1997) Kearns, K. E., Eaton, N. L., Herbst, W., Mazzurco, C. J. 1997, AJ, 114, 1098
- Kholopov (1985) Kholopov, P. N. (editor) 1985, General Catalogue of Variable Stars 4th edition, vol.1,2, Moscow: NAUKA
- Maffei (1967) Maffei, P. 1967, ApJ, 147, 802
- Maffei (1966a) Maffei, P. 1966a, Mem. Soc. Astron. Italiana, 37, 459
- Maffei (1966b) Maffei, P. 1966b, Mem. Soc. Astron. Italiana, 37, 475
- Marcy & Butler (1998) Marcy, G.W., Butler, R.P. 1998, ARA&A, 36, 57
- Park et al. (2000) Park, B., Sung, H., Bessell, M. S., & Kang, Y. H. 2000, AJ, 120, 894
- Rosino, Grubissich, & Maffei (1957) Rosino, L., Grubissich, C., Maffei, P. 1957, Contributi Oss. Astrofis. di Asiago n. 82
- Rutman (1978) Rutman, J. 1978, Proc. IEEE, 66, 1048
- Scargle (1982) Scargle, J. D. 1982, ApJ, 263, 835
- Simonetti, Cordes, & Heeschen (1985) Simonetti, J. H., Cordes, J. M., & Heeschen, D. S. 1985, ApJ, 296, 46
- Stellingwerf (1978) Stellingwerf, R. F. 1978, ApJ, 224, 953
- Tokunaga et al. (2004) Tokunaga, A. T., Dahm, S., Gässler, W., Hayano, Y., Hayashi, M., Iye, M., Kanzawa, T., Kobayashi, N., Kamata, Y., Minowa, Y., et al. 2004, ApJ, 601, L91
- Walker (1961) Walker, M. F. 1961, ApJ, 133, 438
- Walker (1956) Walker, M. F. 1956, ApJS, 2, 356
- Winn et al. (2004) Winn, J. N., Holman, M. J., Johnson, J. A., Stanek, K. Z., Garnavich, P. M. 2004, ApJ, 603, L45
- Winn et al. (2003) Winn, J. N., Garnavich, P. M., Stanek, K. Z., Sasselov, D. D. 2003, ApJ, 593, L121