The two sided parsec scale structure of the Low Luminosity Active Galactic Nucleus in NGC 4278
Abstract
We present new Very Long Baseline Interferometry observations of the LINER galaxy NGC 4278. The observations were taken with the Very Long Baseline Array (VLBA) and a single antenna of the Very Large Array (VLA) at 5 GHz and 8.4 GHz and have a linear resolution of pc. Our radio data reveal a two sided structure, with symmetric -shaped jets emerging from a flat spectrum core. We fit the jet brightness with gaussian components, which we identify from a previous observation taken five years before. By comparing the positions of the components in the two epochs, we measure motions between and mas, corresponding to apparent velocities , and to ages in the range years. Assuming that the radio morphology is intrinsically symmetric and its appearance is governed by Doppler beaming effects, we find that NGC 4278 has mildly relativistic jets (), closely aligned to the line-of-sight (). Alternatively, the source could be oriented at a larger angle and asymmetries could be related to the jet interaction with the surrounding medium. We also present new simultaneous VLA observations between 1.4 and 43 GHz, and a 5 GHz light curve between 1972 and 2003. The radio spectrum can be fit by a relatively steep power-law (). We find significant variability at 5 GHz. All these arguments indicate that the radiation from NGC 4278 is emitted via the synchrotron process by relativistic particles accelerated by a supermassive black hole. Despite a much lower power, this is the same process that takes place in ordinary radio loud AGNs.
1 Introduction
Although objects hosting an Active Galactic Nucleus (AGN) represent only a small fraction of the total number of extragalactic sources, there is growing evidence that a low level of nuclear activity is a common feature among galaxies. Objects presenting a spectral signature of such activity include low-ionization nuclear emission-line region (LINERs, Heckman, 1980), low luminosity Seyfert galaxies, and “transition nuclei”, i.e. nuclei with spectra intermediate between LINERs and HII regions. These objects are grouped under the name of low luminosity active galactic nuclei (LLAGN, see Ho, Filippenko, & Sargent, 1997).
Dynamical searches and stellar kinematics have yielded strong evidence for the existence of compact dark objects of mass to (Kormendy & Richstone, 1995; Magorrian et al., 1998) in virtually all bulge-dominated galaxies. These are most likely in the form of super massive black holes (SMBHs); however, what is still unknown is the state of the SMBH, and the reason why they are so often quiescent. In the light of these findings, the debate over the physical processes that are responsible for the “activity” in LLAGN has been a major issue in recent years. These galaxies may host a scaled down version of the more powerful AGN, with an accreting super massive black hole rendered under-luminous because of a low accretion rate and/or low radiative efficiency. Alternatively, the activity might be related to stellar processes (e.g., Shields, 1992; Filippenko & Terlevich, 1992; Alonso-Herrero et al., 2000).
Along with hard X-ray data (e.g. Ho et al., 2001; Terashima et al., 2002), radio observations are a useful tool to discriminate between an AGN and a starburst powered nucleus. VLA observations with arcsecond (Filho, Barthel, & Ho, 2000, 2002) or subarcsecond (Nagar et al., 2000, 2002) resolution have successfully revealed the presence of a compact radio core in most LINERs and low luminosity Seyferts, with the non-detections likely caused by limits in sensitivity only. The corresponding brightness temperatures are K, which are consistent with a non-thermal origin. The spectral index of these radio cores is typically flat – a well-known signature of synchrotron self-absorbed emission (Nagar, Wilson, & Falcke, 2001).
High angular resolution Very Long Baseline Interferometry (VLBI) observations yield more conclusive evidence: all (16/16) LLAGNs in a flux density and distance limited sample possess milliarcsecond compact cores, as revealed with the VLBA at 6 cm (Falcke et al., 2000; Nagar et al., 2002). This implies brightness temperatures K, which definitely rule out any explanation based on thermal processes, and point directly to synchrotron emission from the base of a parsec scale jet. Indeed, the five sources with the brightest cores have parsec scale jets. Furthermore, high frequency radio spectra can be used to discriminate between pure ADAF (Advection Dominated Accretion Flows, Narayan & Yi, 1995) models and non-thermal jets (Di Matteo et al., 1999; Di Matteo, Carilli, & Fabian, 2001; Anderson, Ulvestad, & Ho, 2004).
The nearby elliptical galaxy NGC 4278 has been investigated in detail at most wavebands. In the optical, HST observations reveal a central point source and a large distribution of dust located north-northwest of the core (Carollo et al., 1997). Ionized nuclear gas typical of a LINER is found in this galaxy (Goudfrooij et al., 1994), possibly associated with an external ring of neutral hydrogen in PA 135∘ (Raimond et al., 1981).
Radio continuum observations of NGC 4278 on kpc scale have been carried out at frequencies between 5 GHz and 43 GHz, revealing a compact source (Di Matteo, Carilli, & Fabian, 2001; Nagar, Wilson, & Falcke, 2001; Nagar et al., 2000). At 1.4 GHz, both the FIRST (Becker, White, & Helfand, 1995) and the NVSS (Condon et al., 1998) data confirm that the source is compact. Only at 8.4 GHz, at a resolution of mas, is NGC 4278 slightly resolved into a two-sided source with an extension to the south (Wilkinson et al., 1998). Compactness and a flat radio spectrum suggest that the radio emission is non-thermal, and in this respect the emission from NGC 4278 seems to be very similar to that of powerful radio loud AGNs, such as QSO and BL Lacs; however, the total radio luminosity of the source is only W Hz-1, i.e. at least two orders of magnitude less than those powerful objects.
On parsec scales, early VLBI experiments at 18 cm and 6 cm have revealed a core dominated structure, with an elongated feature extending to the north-west and possibly to the south on scales of some 10 mas (Jones, Terzian, & Sramek, 1981; Jones, Sramek, & Terzian, 1982; Schilizzi et al., 1983; Jones, Wrobel, & Shaffer, 1984). More recent observations with the VLBA at 6 cm have yielded a dramatic improvement in our knowledge of this source: Falcke et al. (2000) reveal an extended core and an elongated region to the southeast on scales of a few milliarcsecond; Giovannini et al. (2001), thanks to more short spacings provided by a VLA antenna in addition to the full VLBA, have detect emission on the opposite side of the core as well. However, the discrepancy in the total flux density [ vs. mJy] is more than the simple addition of a VLA antenna can justify; it is possible that the source may be variable or simply that there have been problems in the calibration of the flux density scale. Bondi et al. (2004) also detect a trace of two-sided emission, although heavily resolved. Finally, VLBA phase-referenced observations have succeeded in detecting the source on sub-pc scale even at 43 GHz, where it shows only a core and a hint of low level emission to the north (Ly, Walker, & Wrobel, 2004).
In the present paper, we consider new VLBA observations at two frequencies (5 GHz and 8.4 GHz), taken on 2000 August 27. We compare the new 5 GHz image to previous images and discuss the morphology and the motion of components. Furthermore, the 8.4 GHz data provide a favorable combination of resolution and sensitivity, constraining the brightness temperature and the location of the central black hole.
We describe the new observations in §2 and present the results in §3. A discussion is given in §4, and the main conclusions are summarized in §5. Throughout this paper, we adopt for the Hubble constant a value of 71 km s-1 Mpc-1; however, since NGC 4278 has a direct distance measurement of 14.9 Mpc (Tonry et al., 2001; Jensen et al., 2003), we do not make use of its redshift (), which is affected by proper motion in a galaxy group. At the distance of NGC 4278, 1 mas corresponds to a linear scale of 0.071 pc. We define the spectral index following the convention that .
2 Observations and Data Reduction
2.1 VLBA observations
We observed NGC 4278 with an 11 element VLBI array composed of the NRAO Very Long Baseline Array (VLBA) and a single 25 m VLA antenna for 10 hours. The observing run was performed on 2000 August 27, switching between 5 GHz (with 4 IFs at 4971.49, 4979.49, 4987.49, 4995.49 MHz) and 8.4 GHz (8405.49, 8413.49, 8421.49, 8429.49 MHz). Sixteen channels per IF and full polarization data were recorded. Short scans on 3C279 were taken in order to find fringes, and several observations of OQ208 were repeated at different hour angles in order to calibrate the polarization leakage terms. J1310+3220 and J1751+0939 were also observed to perform checks on the amplitude and polarization calibration.
The correlation was carried out at the AOC in Socorro. The distribution tapes were read into the NRAO Astronomical Image Processing System (AIPS) for the initial calibration. We followed the same scheme for the data reduction of both 5 GHz and 8.4 GHz data-sets. As a first step, we corrected our data using the accurate position information obtained by Ly, Walker, & Wrobel (2004) in a phase-referenced experiment with the VLBA at 43 GHz (RA 12h 20m 06s.825429, Dec ). We then performed the usual calibration stages (removal of instrumental single band delay, and the delay, and bandpass calibration) using scans on 3C279.
After flagging bad data, we obtained good models for the calibrators, which we used to improve the amplitude calibration for the entire data-set. Finally, we removed the instrumental polarization leakage using OQ208. A single-source file for NGC 4278 was then created by averaging the frequency channels and IFs and exported into Difmap (Shepherd, Pearson, & Taylor, 1994, 1995) for editing and self-calibration.
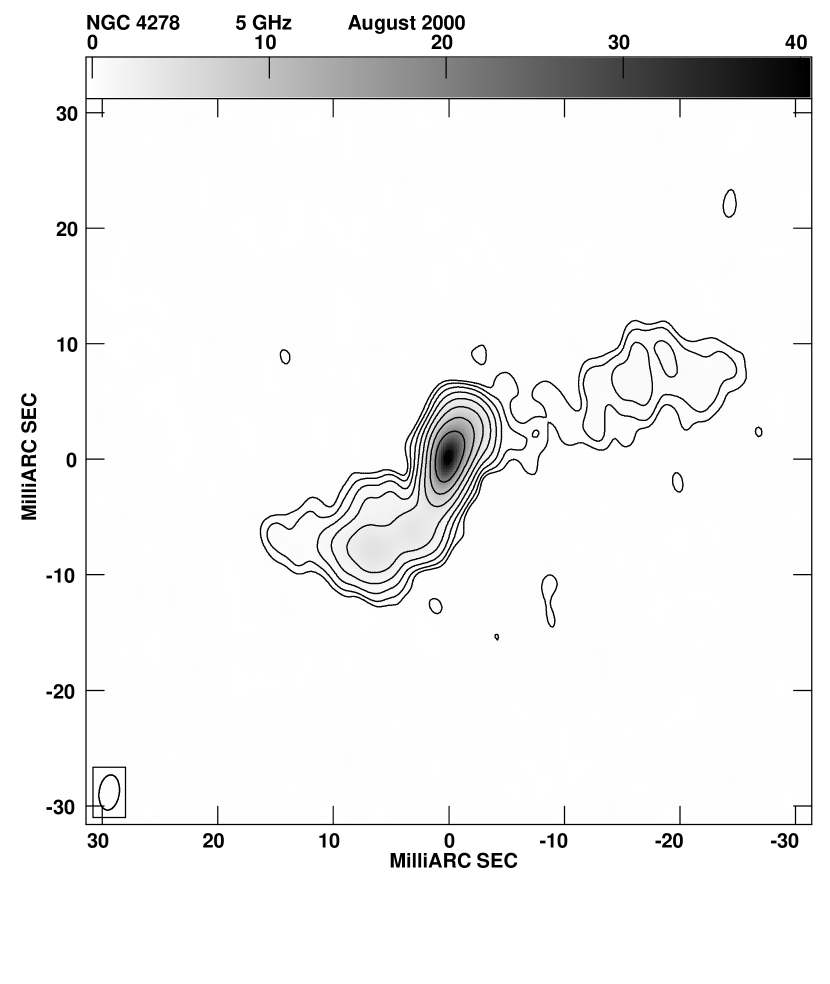
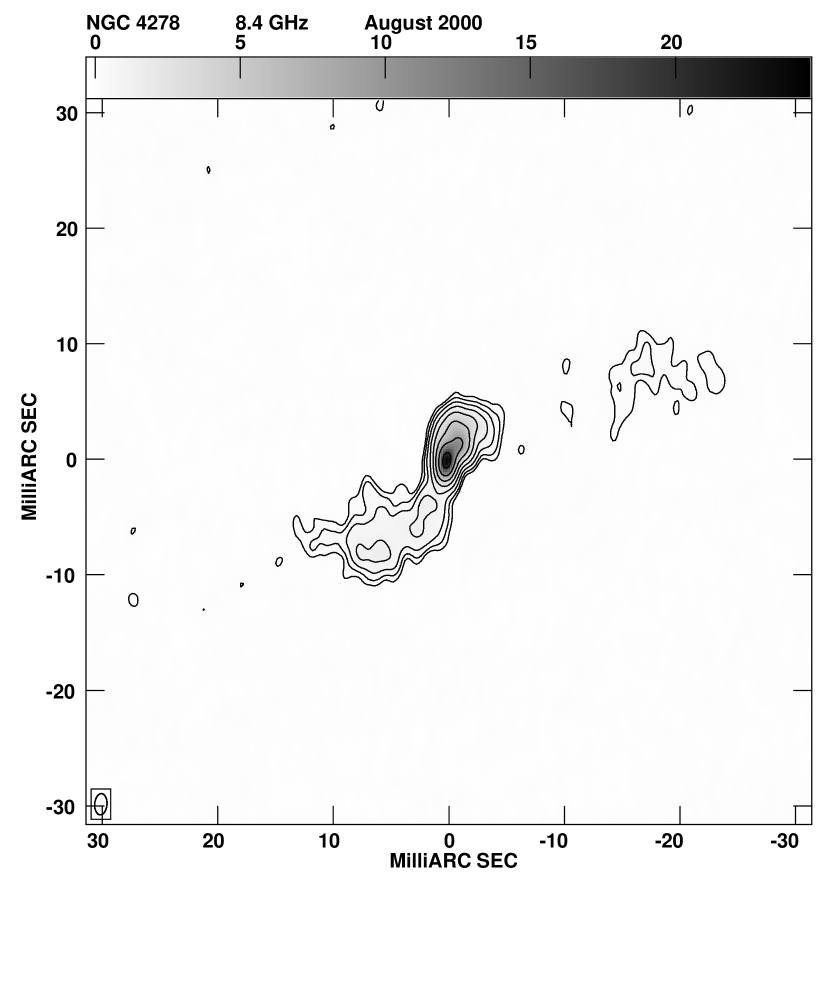
Thanks to a good calibration and position information, we could obtain final images with only a few iterations of phase self-calibration. One cycle of amplitude self-calibration with a long solution interval (30 minutes) has also been performed before obtaining the final data. Total intensity images with natural weights are presented in Figs. 1 and 2, and the most relevant parameters are summarized in Table 1. Stokes ’Q’ and ’U’ images were also made.
The final calibrated datasets are not suitable for a direct combination into a spectral index map. Different observing frequencies correspond to different coverage of the -plane and this could introduce spurious results in a spectral index map. Therefore we selected an annulus in the -plane, consisting of only baselines in the range 0.9 M M. We also tapered the data at 100 M in and 60 M in in order to account for the more elliptical coverage of the 5 GHz data. After this processing, the images have a resolution of 3.2 mas 1.9 mas in PA and were combined to produce the spectral index map using the AIPS task COMB.
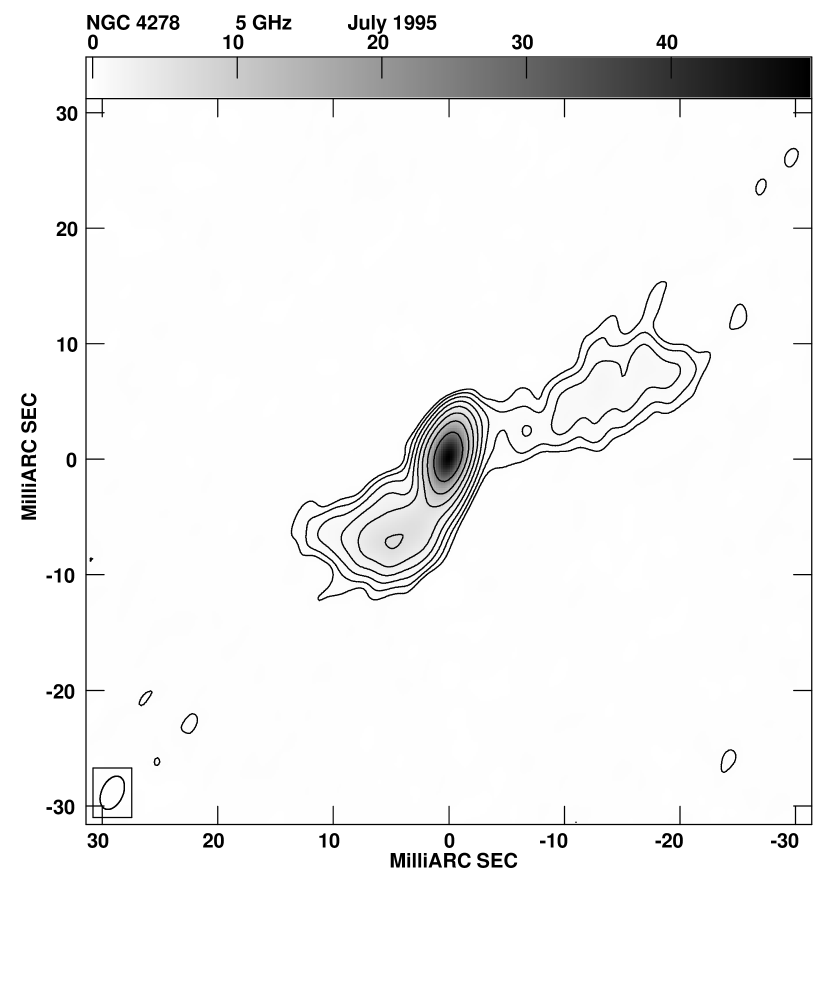
We also re-analyzed VLBA+Y1 5 GHz data obtained in 1995 (July 22), taking advantage of the new position (Ly, Walker, & Wrobel, 2004). The position used in the original correlation was off by more than one arcsecond from the actual position of the source. This resulted in exceedingly large delays which caused a lot of failures in the fringe fitting process. The new accurate positional information allows us to recover a large fraction of useful data, resulting in a significantly improved, high fidelity image. We present and briefly discuss the results from the reprocessed data in Sect. 3.2.
2.2 VLA observations
New VLA observations were taken at 1.4, 5.0, 8.4, 15, 22, and 43 GHz in A configuration on 2003 August 17 and reduced in AIPS following standard procedures. 3C 286 was used to set the flux density scale. Phase referencing to the nearby calibrator 1221+282 failed at high frequencies due to bad weather (rain). Thus, we only have an upper limit at 43 GHz and the value at 22 GHz is more uncertain than at lower frequencies – we estimate a fractional error of 2% up to 8.4 GHz, of 5% at 15 GHz, and of 10% at 22 GHz.
3 Results
3.1 VLBA on 27 August 2000
The final images reveal a source dominated by a central compact component, with emission coming from either side. To the southeast, a jet-like feature extends for mas in PA 155∘ (measured north to east), then progressively bends into PA 100∘. In total, the jet is almost 20 mas long, which corresponds to pc. On the opposite side, the main component is slightly elongated to the north in the 5 GHz map, and the 8.4 GHz data clearly show a secondary component in PA . Then, this jet-like feature bends to the west turning into a diffuse, uncollimated, low brightness region.
In total, the source extends over milliarcsecond, i.e. about 3 parsecs. Given its morphology and dimension, NGC 4278 meets all requirements for the classification as a Compact Symmetric Object (CSO), except that it is under-luminous compared to most known CSOs (Readhead et al., 1994; Peck & Taylor, 2000).
The total flux density measured in our images is 120 mJy at 5 GHz and 95 mJy at 8.4 GHz. If we compare these values with those obtained with the VLA (162 mJy and 114 mJy, respectively, see Table 5), we find about a 20-25% difference, which can be ascribed to the VLBA resolving out some extended emission, probably in the western region. The monochromatic luminosity at 1.4 GHz is W Hz-1, and W Hz-1 at 8.4 GHz.
The visibility data are well fit by a five component model at both frequencies. The position and dimension of the components are illustrated in Fig. 3; our choice for labeling the components is based on their most likely epoch of ejection, as discussed in § 3.3. Table 2 shows the relevant parameters for all components, re-referenced to the central component . To compute positional uncertainties for the components, we repeated the modelfit on the ’LL’ and ’RR’ correlations independently; the semi-dispersion of the results is taken as a error on the position of each component. This yields mas for components and , 0.01 mas for and 0.34 mas for . In Columns 7 and 8 we report the flux density at 5 and 8.4 GHz respectively, and in Column 9 we compute the spectral index. Besides being the most compact feature, component presents also the flattest spectral index () and its identification with the core is straightforward.
Finally, no polarized signal is detected from our data. Both the images in Stokes ’Q’ and ’U’ are purely noise-like, with on source noise levels of 66 and 63 Jy/beam at 5 GHz and of 62 and 60 mJy/beam at 8.4 GHz, respectively. Based on the on-source noise in the ’Q’ and ’U’ images, we place a limit on any polarized signal for the source at Jy/beam at 5 GHz and Jy/beam at 8.4 GHz ( values). At the position of the brightest component in the total intensity images, this corresponds to a fractional polarization of at 5 GHz and at 8.4 GHz.
3.2 VLBA on 22 July 1995
The reprocessing of the July 1995 data has yielded a significant improvement over the previously published results. The new image (Fig. 4) is in good agreement with the data taken at 5 GHz in 2000, showing a central compact component and jet-like features in the same position angle. The overall morphology of the source is similar to that shown in Giovannini et al. (2001) and we confirm the reality of the emission coming from the northwest. However, the noise level has improved by over a factor of 6 (65 vs 400 Jy) and the flux density scale is more consistent with both our new observations as well as the results presented in Falcke et al. (2000) and Bondi et al. (2004). The resulting total flux density is 135 mJy.
The same five component model that fits the 2000 epoch data has been applied to this data set as well, allowing for the components to change in flux density and position. The resulting fit is good (reduced -squared of 0.98) and is presented in Table 3. Uncertainties are computed in the same way as for epoch 2000.652, and are 0.13, 0.11, 0.09, and 0.56 mas for , , and , respectively.
An independent fit with only four components has also been tried, and fits the data almost as well as the five component model (reduced -squared of 1.00): components S2, S1, and N2 are maintained in both models, while and can actually be fitted with one Gaussian only (). However, this model gives a less accurate representation of the core region, with the component too extended (3.2 mas 1.3 mas) to match the size of the compact core. We also note that if is removed from the model for the 2000.652 epoch data, any following iteration of the fitting algorithm will reintroduce it at the expense of .
3.3 Component motion and variability
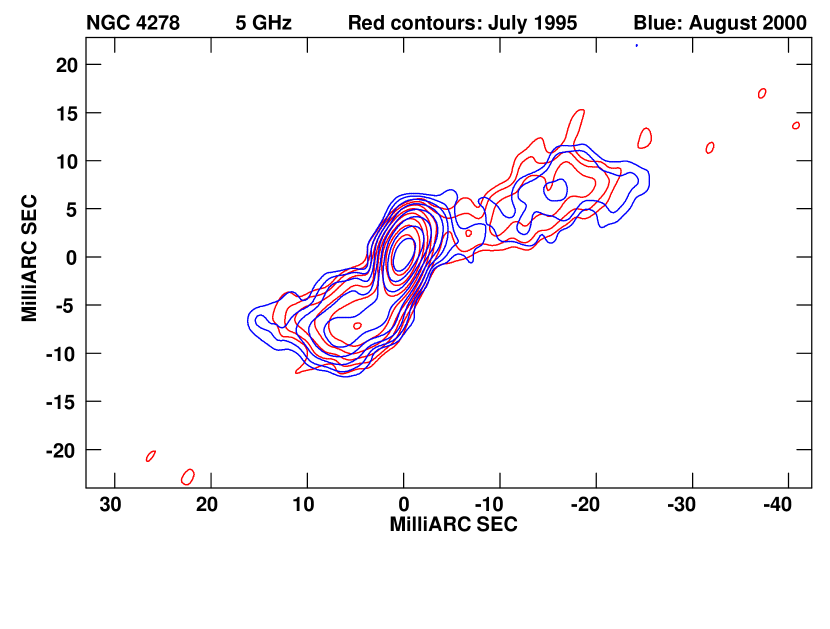
If we compare data taken at the same frequency in different epochs, we can get information on the evolution of the source. A first comparison can be made by directly overlaying the contours at the same frequency from the two epochs (Fig. 5). Before overlaying them, we have convolved the two images with the same restoring beam. We also plot the same contours, regardless of the lower noise level of the 2000.652 image. This guarantees that any difference is due to a real change in the source structure and not simply to the better sensitivity of one observation.
The overlay is suggestive of a displacement of the northwest low level emission, moving away from the core. Minor differences can be seen also in the core region and in the southeastern jet. In general, the blue 2000.652 contours trace the emission in a region more extended than the red 1995.551 ones. This behavior can be better quantified if we consider the relative motion of the components identified by the modelfit process. Taking the position of the core (component ) as a reference, and assuming it is fixed, we have compared the position of the other components. We report the results in Table 4: column (1) labels the components, columns (2) and (3) give the relative motion over the five years in polar coordinates (distance in mas, angle in degrees); columns (4) and (5) report the apparent velocity in mas yr-1 and units of , respectively; finally, the corresponding kinematic age is given in column (6). The radial distance of each component has increased over the five years lag between the observations. The motion is larger on the northwestern side; in particular, the largest displacement is found for component . The corresponding apparent velocities are given in Column (5), with the fastest component moving at .
Assuming that the apparent velocity is constant for each component, we derive ages as reported in column (6). and have ages that are consistent, and they could have been ejected together about 25 years before epoch 2000.652. is the oldest component, and its counterpart in the main jet is not detected, probably because it is too distant and extended. Finally, is the youngest component, ejected only three years before our first epoch of observations; it is likely that a corresponding component has emerged in the counterjet but is still confused with the core. Note that the core is the only component whose flux density is larger in 2000.652 than in 1995.551.
Finally, we can compare the total flux density detected in the two epochs. Our data indicate a variation of the total flux density of about 10%, with the source being less powerful in the second epoch. Note that Falcke et al. (2000) report a value of 87.3 mJy; however, that observation was performed without the addition of a VLA antenna, which results in a lack of short spacings sensitive to low level emission. As a consequence, component and (partly) are resolved out, accounting for the difference in total flux density.
3.4 Spectral index
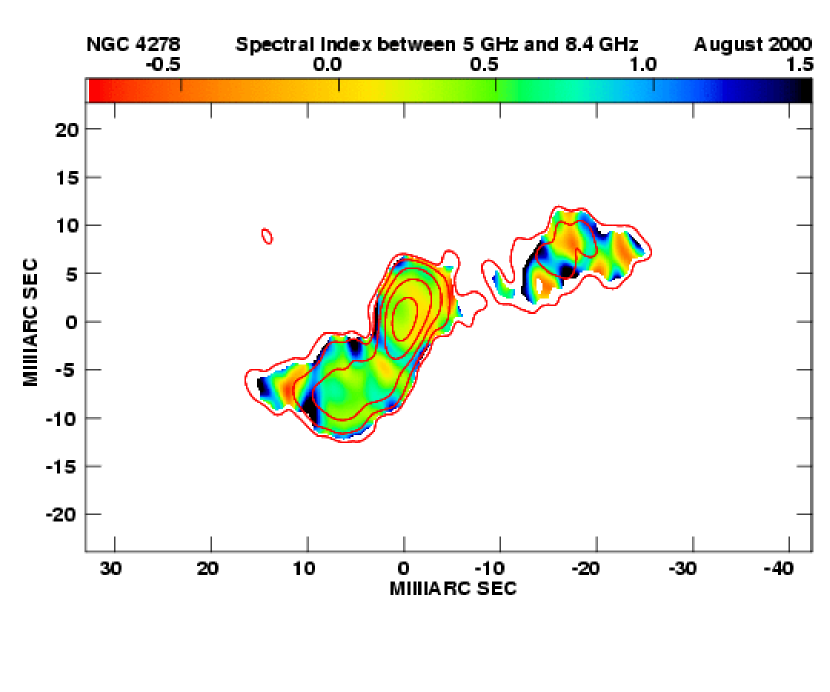
We now compare data taken at the same epoch but with different frequencies, in particular we present the map of the spectral index from 2000 August 27 (Fig. 6). The features of the spectral index map are in agreement with the single component values determined by the model-fit. The core region presents the flattest spectrum (), steepening along the southern jet (). An irregular spectral index pattern is found in regions with lower level emission, such as the outermost edge of the southern jet and the extended northern component N2. However, we can still determine an average spectrum for this region, which has .
4 Discussion
4.1 Jet orientation and velocity
Our images detect low level emission to the northwest of NGC 4278 with unprecedented resolution and sensitivity. We find, in the inner part of the jet, a compact component N3, and at a larger distance, mJy of flux density in the region N2. Thus, we classify NGC 4278 as a two-sided source, similarly to a few other LLAGN previously studied, e.g. NGC 4552 (Nagar et al., 2002), NGC 6500 (Falcke et al., 2000), and NGC 3894 (Taylor, Wrobel, & Vermeulen, 1998).
We are therefore faced with the puzzle of determining which of the jets is pointing toward us and the direction of the source main axis with respect to the line-of-sight. Although the southern jet looks more collimated, the total flux density is larger in the northern components than in the southern ones. The high resolution 8.4 GHz image (Fig. 2) clearly shows that the inner jet is brighter to the north than to the south. The apparent motion of the northern components are also larger than those of the southern ones. Finally, the 43 GHz image in Ly, Walker, & Wrobel (2004) shows a hint of emission only to the northwest of the core on scales 1 mas. We therefore argue that the main, approaching jet is the northern one.
4.1.1 Jet Asymmetries from Doppler Boosting
To estimate the orientation and intrinsic velocity of the jet, we initially consider a simple beaming model, which assumes that pairs of components are ejected simultaneously from the core with the same intrinsic velocity and brightness. We apply this model to the component pair /, which has been ejected simultaneously according to our motion measurements (§ 3.3), and we further assume that is the one on the approaching side. In this model, the ratio between the arm length and the proper motion of the two components are related by
From our modelfits we derive that and , so we estimate that . The arm length ratio corresponds to selecting the hatched area between the two solid lines in the -plane shown in Fig. 8. The dot-dash lines represent the possible combination of and resulting from the apparent separation velocity of the two components, which is expressed by the relation . Finally, since we measure motion on both sides and we know the source distance, we can directly solve for and (see e.g. Mirabel & Rodriguez, 1994); this corresponds to the dashed ellipse centered on , .
In principle, one could also consider the brightness ratio between the two components; however, as an effect of relativistic time dilation, we are watching the components at different stages of evolution. Since we know little about the time evolution of the jet components, this hinders the application of the brightness ratio constraint; in any case, a check that is possible and is consistent with our interpretation.
Based on the above analysis (Fig. 8), we find mildly relativistic velocities of (), and an orientation close to the line-of-sight (). The resultant Doppler factor is and the small viewing angle explains the bends visible in both jets as the amplification caused by projection effects of intrinsically small deviations, which are common in high power radio sources.
4.1.2 Jet Asymmetries from Interactions
As an alternate explanation to that proposed above, it is possible that the true radio morphology of NGC 4278 is influenced by more than relativistic beaming. For example, there may be significant interactions between the jet and the surrounding medium. This could explain the lower velocity for the components in the southern side of the jet and cause the flux density of to be enhanced. If this is the case, the task of identifying corresponding pairs of components either side of the core becomes confused. The radio source could then be oriented at a larger angle to the line-of-sight than we deduce from beaming arguments. In this scenario, the large bends visible in our images would be real and not amplified by geometrical effects, suggesting a strong interaction of the jets with the surrounding medium. The combination of a strong interaction with a dense medium and a low power core could well account for the small size of NGC 4278. It is unlikely, in any case, that more than mildly relativistic velocities are present in the jet of NGC 4278.
It is interesting to note that Nagar et al. (2002) have detected compact cores in LLAGNs almost exclusively in Type 1 objects. Among the possible explanations, they invoke the unified scheme, assuming that all LLAGNs have accreting black holes and that we only see radio emission in Type 1 objects because of beaming and/or obscuration. Our resulting viewing angle determined in §4.1.1 seems to support this picture; however, the Lorentz factor is not as high as in more powerful classic radio galaxies, where (Giovannini et al., 2001). Therefore, a source similar to NGC 4278 but oriented at , would have a similar Doppler factor , hence still be detectable. We note that if LLAGNs have low Lorentz factor (i.e. ), the Doppler factor does not depend strongly on the viewing angle and we should be able to see also sources oriented at large . The lack of raido cores in Type 2 LLAGN then may require alternative explanations such as free-free absorption by a torus.
4.2 History of emission
From the result of the modelfit, small to moderate apparent velocities () are found for the four jet components. Under the assumption of constant velocity, we derive that these components must have been ejected from the core between 8.3 and 65.8 years before epoch 2000.652 (see Column [6] in Table 4).
However, these jet components are not to be confused with the hot spots demarcating the end of the jet as found in more powerful CSOs (Owsianik & Conway, 1998; Peck & Taylor, 2000; Giroletti et al., 2003). Therefore, a kinematic estimate of the real age of the source is not possible, and that of can only be taken as a lower limit. The low brightness and large size of , as well as the non-detection of , suggest that components are continually ejected from the core, but soon disrupt, without being able to travel long distances and form kiloparsec-scale lobes.
We do not expect that this source will evolve into a kiloparsec-scale radio galaxy, but rather that it will only periodically inflate slowly, as visible in Fig. 5. The relatively low velocity jets discussed in § 4.1 cannot bore through the local ISM and escape, as demonstrated by the lack of hot spots which are prevalent in higher power CSOs. This behavior can be ascribed to a low power central engine, which cannot create highly relativistic jets.
In Fig. 9 we plot the flux density history for NGC 4278 at 6 cm using data taken at the Westerbork Synthesis Radio Telescope, the Green Bank 300 ft radio telescope and the VLA. A previous light curve was published by Wrobel & Heeschen (1991), to which we add 12 points, from observations obtained between 1972 and 2003. The light curve shows that the radio source is variable, prone to both outbursts and low states. A burst is certainly present around 1985, while in more recent years the source has been showing less activity.
It is difficult to connect the burst with the ejection of new components, both because of the uncertainties related to the age of a single component, and the possible time lag between component ejection and total flux density enhancement. It is clear however that the source presents a high degree of variability, most likely related to the presence of an active nucleus. This is an interesting result, suggesting that repeated observations of other LLAGN are desirable, given that few studies on this topic exist so far (Wrobel, 2000; Nagar et al., 2002).
4.3 The origin of energy in LLAGN
Thanks to its proximity, NGC 4278 makes an excellent laboratory to study the properties of LLAGNs and to explore the nature of the physical processes taking place. In particular, there are three important clues for solving the puzzle over the origin of the radio emission: (1) the shape of the radio spectrum; (2) the parsec-scale morphology, and (3) the brightness temperature of the VLBI core.
In 7 nearby galaxies studied by Di Matteo et al. (1999); Di Matteo, Carilli, & Fabian (2001), ADAF models are unsuccessful in fitting the high frequency radio spectra, and synchrotron radiation from non-thermal particles in jets must contribute significantly. Conversely, Anderson, Ulvestad, & Ho (2004) have revealed in six LLAGN VLBA spectral indexes that are remarkably flat or even slowly rising up to 43 GHz. Although these cores are still too luminous to be explained in terms of only radiation from an ADAF, the jet properties remain to be determined and successfully imaged in these sources.
In our case, the overall VLA spectrum can be fit by a power-law with an intermediate index (see §3.4). A possible steepening occurs above 22 GHz, which argues against the presence of an ADAF as significantly contributing to the total emissivity. A low frequency flattening/turnover may be present around 408 MHz, with mJy (Colla et al., 1972) and mJy (Douglas et al., 1996). Variability and resolution effects are also important in the study of the spectrum of this source and other AGN – for example, the flux density from the low brightness northwestern region was missed by Falcke et al. (2000), resulting in a flatter high-frequency spectral index. In any case, the radio spectrum between 151 MHz and 43 GHz is globally similar to that of more powerful radio loud AGN, i.e. to that of synchrotron emission from relativistic particles in a jet.
At higher frequencies, NGC 4278 possesses an optical central compact core which lies nicely at the low power end of the correlation between optical and radio core luminosity in FR I radio galaxies (Capetti et al., 2002). This correlation can be interpreted in terms of a common non-thermal synchrotron origin, with the radiation being produced in relativistic jets (Capetti & Celotti, 1999).
The parsec-scale morphology revealed by our VLBA images is clearly in agreement with this scenario, showing twin jets. This result and the high brightness temperature K are in agreement with similar findings from Nagar et al. (2002); therefore, we conclude that the emission from NGC 4278 and from similar LLAGNs originates in radio jets via the synchrotron process.
In this scenario, detection of polarized signals would be an interesting signature of the synchrotron process; indeed, VLA observations at 8.4 GHz have found weak linear polarization in NGC 4278 at a level of 0.34% and in other LLAGN, although the detection rates and percentage of linear polarization in these sources are lower than in more powerful AGNs (Bower, Falcke, & Mellon, 2002). Our new polarization data for NGC 4278 show that it is unpolarized on milliarcsecond scales, as also found by Bondi et al. (2004). This could be due to limits in sensitivity. Since synchrotron radiation is expected to have an intrinsically high percentage of linear polarization, one needs to invoke a significant amount of Faraday depolarization, or some other effect, to explain the low amount of linear polarization observed. Note that low or absent linear polarization is a characteristic of CSOs (Peck & Taylor, 2000; Giroletti et al., 2003), although recent observations have found exceptions to this rule (Gugliucci et al., 2004).
Finally, it is interesting to discuss the position of the central black hole responsible for the accretion and launch of the jets. Our observations allow us to image the nuclear region of NGC 4278 on scales of pc (1 mas = 0.071 pc). Based on the correlation between the black hole mass and the central velocity dispersion, we can estimate for NGC 4278. The relation takes the form , where km s-1 (Tremaine et al., 2002) and km s-1 (Barth, Ho, & Sargent, 2002). It follows that and that the Schwarzschild radius pc; therefore, our images probe scales of some .
5 Conclusions
We present new VLBA and VLA data for the nearby ( Mpc) LLAGN NGC 4278. Our new VLBA data show a two-sided emission on sub-parsec scales in the form of twin jets emerging from a central compact component ( K), in a similar way to that seen in more powerful radio loud AGNs. In agreement with this, the spectral index distribution for the radio source reveals a flat spectrum core region with steep spectrum jets on either side.
By comparison with previous observations, we discover proper motion for components in both jets over a five years time baseline. We find low apparent velocities () for the jet components and estimate the epoch of their ejection as years prior to our observations. Based on our analysis, we suggest that the north-west side is the approaching side, and that the jets of NGC 4278 are mildly relativistic with 0.75.
The central black hole in NGC 4278 is active and able to produce jets, which are responsible for the bulk of the emission at radio to optical frequencies in this LLAGN. However, the lifetime of the components of years at the present epoch, combined with the lack of large scale emission, suggests that the jets are disrupted before they reach kiloparsec scales.
The study of the flux density history at 6 cm between 1972 and 2003 shows significant variability () on time scales of a few years, which might be related to the ejection of new components. This subject needs to be explored for other LLAGNs as well, as it can give insights into the state of the central black hole in these sources.
References
- Alonso-Herrero et al. (2000) Alonso-Herrero, A., Rieke, M. J., Rieke, G. H., & Shields, J. C. 2000, ApJ, 530, 688
- Anderson, Ulvestad, & Ho (2004) Anderson, J. M., Ulvestad, J. S., & Ho, L. C. 2004, ApJ, 603, 42
- Barth, Ho, & Sargent (2002) Barth, A. J., Ho, L. C., & Sargent, W. L. W. 2002, AJ, 124, 2607
- Becker, White, & Edwards (1991) Becker, R. H., White, R. L., & Edwards, A. L. 1991, ApJS, 75, 1
- Becker, White, & Helfand (1995) Becker, R. H., White, R. L., & Helfand, D. J. 1995, ApJ, 450, 559
- Bondi et al. (2004) Bondi, M., Marchã, M. J. M., Polatidis, A., Dallacasa, D., Stanghellini, C., & Antón, S. 2004, MNRAS, 352, 112
- Bower, Falcke, & Mellon (2002) Bower, G. C., Falcke, H., & Mellon, R. R. 2002, ApJ, 578, L103
- Capetti & Celotti (1999) Capetti, A. & Celotti, A. 1999, MNRAS, 304, 434
- Capetti et al. (2002) Capetti, A., Celotti, A., Chiaberge, M., de Ruiter, H. R., Fanti, R., Morganti, R., & Parma, P. 2002, A&A, 383, 104
- Carollo et al. (1997) Carollo, C. M., Franx, M., Illingworth, G. D., & Forbes, D. A. 1997, ApJ, 481, 710
- Colla et al. (1972) Colla, G., et al. 1972, A&AS, 7, 1
- Condon et al. (1998) Condon, J. J., Cotton, W. D., Greisen, E. W., Yin, Q. F., Perley, R. A., Taylor, G. B., & Broderick, J. J. 1998, AJ, 115, 1693
- Di Matteo et al. (1999) Di Matteo, T., Fabian, A. C., Rees, M. J., Carilli, C. L., & Ivison, R. J. 1999, MNRAS, 305, 492
- Di Matteo, Carilli, & Fabian (2001) Di Matteo, T., Carilli, C. L., & Fabian, A. C. 2001, ApJ, 547, 731
- Douglas et al. (1996) Douglas, J. N., Bash, F. N., Bozyan, F. A., Torrence, G. W., & Wolfe, C. 1996, AJ, 111, 1945
- Ekers, Fanti, & Miley (1983) Ekers, R. D., Fanti, R., & Miley, G. K. 1983, A&A, 120, 297
- Falcke et al. (2000) Falcke, H., Nagar, N. M., Wilson, A. S., & Ulvestad, J. S. 2000, ApJ, 542, 197
- Ferrarese & Merritt (2000) Ferrarese, L. & Merritt, D. 2000, ApJ, 539, L9
- Filho, Barthel, & Ho (2000) Filho, M. E., Barthel, P. D., & Ho, L. C. 2000, ApJS, 129, 93
- Filho, Barthel, & Ho (2002) Filho, M. E., Barthel, P. D., & Ho, L. C. 2002, ApJS, 142, 223
- Filippenko & Terlevich (1992) Filippenko, A. V. & Terlevich, R. 1992, ApJ, 397, L79
- Gebhardt et al. (2000) Gebhardt, K. et al. 2000, ApJ, 539, L13
- Giovannini et al. (2001) Giovannini, G., Cotton, W. D., Feretti, L., Lara, L., & Venturi, T. 2001, ApJ, 552, 508
- Giroletti et al. (2003) Giroletti, M., Giovannini, G., Taylor, G. B., Conway, J. E., Lara, L., & Venturi, T. 2003, A&A, 399, 889
- Goudfrooij et al. (1994) Goudfrooij, P., Hansen, L., Jorgensen, H. E., & Norgaard-Nielsen, H. U. 1994, A&AS, 105, 341
- Gregory & Condon (1991) Gregory, P. C. & Condon, J. J. 1991, ApJS, 75, 1011
- Gregory et al. (1996) Gregory, P. C., Scott, W. K., Douglas, K., & Condon, J. J. 1996, ApJS, 103, 427
- Gugliucci et al. (2004) Gugliucci, N. E., Taylor, G. B., Peck, A. B., & Giroletti, M. 2004, ApJ, submitted
- Heckman (1980) Heckman, T. M. 1980, A&A, 87, 152
- Ho, Filippenko, & Sargent (1997) Ho, L. C., Filippenko, A. V., & Sargent, W. L. W. 1997, ApJS, 112, 315
- Ho et al. (2001) Ho, L. C., et al. 2001, ApJ, 549, L51
- Jensen et al. (2003) Jensen, J. B., Tonry, J. L., Barris, B. J., Thompson, R. I., Liu, M. C., Rieke, M. J., Ajhar, E. A., & Blakeslee, J. P. 2003, ApJ, 583, 712
- Jones, Terzian, & Sramek (1981) Jones, D. L., Terzian, Y., & Sramek, R. A. 1981, ApJ, 246, 28
- Jones, Sramek, & Terzian (1982) Jones, D. L., Sramek, R. A., & Terzian, Y. 1982, ApJ, 261, 422
- Jones, Wrobel, & Shaffer (1984) Jones, D. L., Wrobel, J. M., & Shaffer, D. B. 1984, ApJ, 276, 480
- Kormendy & Richstone (1995) Kormendy, J. & Richstone, D. 1995, ARA&A, 33, 581
- Langston et al. (1990) Langston, G. I., Heflin, M. B., Conner, S. R., Lehar, J., Carrilli, C. L., & Burke, B. F. 1990, ApJS, 72, 621
- Ly, Walker, & Wrobel (2004) Ly, C., Walker, R. C., & Wrobel, J. M. 2004, AJ, 127, 119
- Magorrian et al. (1998) Magorrian, J., et al. 1998, AJ, 115, 2285
- Mirabel & Rodriguez (1994) Mirabel, I. F. & Rodriguez, L. F. 1994, Nature, 371, 46
- Nagar et al. (2000) Nagar, N. M., Falcke, H., Wilson, A. S., & Ho, L. C. 2000, ApJ, 542, 186
- Nagar, Wilson, & Falcke (2001) Nagar, N. M., Wilson, A. S., & Falcke, H. 2001, ApJ, 559, L87
- Nagar et al. (2002) Nagar, N. M., Falcke, H., Wilson, A. S., & Ulvestad, J. S. 2002, A&A, 392, 53
- Narayan & Yi (1995) Narayan, R. & Yi, I. 1995, ApJ, 452, 710
- Owsianik & Conway (1998) Owsianik, I. & Conway, J. E. 1998, A&A, 337, 69
- Peck & Taylor (2000) Peck, A. B. & Taylor, G. B. 2000, ApJ, 534, 90
- Raimond et al. (1981) Raimond, E., Faber, S. M., Gallagher, J. S., & Knapp, G. R. 1981, ApJ, 246, 708
- Readhead et al. (1994) Readhead, A. C. S., Xu, W., Pearson, T. J., Wilkinson, P. N., & Polatidis, A. G. 1994, Compact Extragalactic Radio Sources, 17
- Schilizzi et al. (1983) Schilizzi, R. T., Fanti, C., Fanti, R., & Parma, P. 1983, A&A, 126, 412
- Shepherd, Pearson, & Taylor (1994) Shepherd, M. C., Pearson, T. J., & Taylor, G. B. 1994, BAAS, 26, 987
- Shepherd, Pearson, & Taylor (1995) Shepherd, M. C., Pearson, T. J., & Taylor, G. B. 1995, BAAS, 27, 903
- Shields (1992) Shields, J. C. 1992, ApJ, 399, L27
- Sramek (1975) Sramek, R. 1975, AJ, 80, 771
- Taylor, Wrobel, & Vermeulen (1998) Taylor, G. B., Wrobel, J. M., & Vermeulen, R. C. 1998, ApJ, 498, 619
- Terashima et al. (2002) Terashima, Y., Iyomoto, N., Ho, L. C., & Ptak, A. F. 2002, ApJS, 139, 1
- Tonry et al. (2001) Tonry, J. L., Dressler, A., Blakeslee, J. P., Ajhar, E. A., Fletcher, A. B., Luppino, G. A., Metzger, M. R., & Moore, C. B. 2001, ApJ, 546, 681
- Tremaine et al. (2002) Tremaine, S., et al. 2002, ApJ, 574, 740
- Wilkinson et al. (1998) Wilkinson, P. N., Browne, I. W. A., Patnaik, A. R., Wrobel, J. M., & Sorathia, B. 1998, MNRAS, 300, 790
- Wrobel (2000) Wrobel, J. M. 2000, ApJ, 531, 716
- Wrobel & Heeschen (1991) Wrobel, J. M. & Heeschen, D. S. 1991, AJ, 101, 148
| beam | beam | peak | total | ||||
|---|---|---|---|---|---|---|---|
| Epoch | Freq. | size | P.A. | noise | brightness | flux density | |
| (GHz) | (mas mas) | (∘) | (Jy beam-1) | (mJy beam-1) | (mJy) | (W Hz-1) | |
| 1995.551 | 5.0 | 3.0 1.8 | 65 | 49.5 | |||
| 2000.652 | 5.0 | 3.0 1.7 | 45 | 40.5 | |||
| 2000.652 | 8.4 | 1.8 1.0 | 50 | 24.6 |
| Component | ||||||||
|---|---|---|---|---|---|---|---|---|
| (mas) | (∘) | (mas) | (∘) | (mJy) | (mJy) | |||
| C | 0.00 | 0.0 | 0.99 | 0.48 | 26.6 | 31.5 | 28.0 | 0.2 |
| S2 | 2.57 | 162.0 | 1.65 | 0.36 | 76.4 | 7.5 | 3.0 | 1.8 |
| S1 | 8.51 | 142.8 | 7.39 | 0.50 | 68.3 | 28.0 | 20.8 | 0.6 |
| N3 | 1.96 | 25.1 | 3.23 | 0.74 | 39.0 | 45.4 | 36.6 | 0.4 |
| N2 | 18.46 | 67.7 | 11.17 | 0.45 | 71.9 | 8.7 | 6.3 | 0.6 |
Note. — Parameters of each Gaussian component of the model brightness distribution: , polar coordinates of the center of the component relative to an arbitrary origin, with polar angle measured from north through east; , major and minor axes of the FWHM contour; , position angle of the major axis measured from north through east; , flux densities; , spectral index between 5 and 8.4 GHz.
| Component | ||||||
|---|---|---|---|---|---|---|
| (mas) | (∘) | (mas) | (∘) | (mJy) | ||
| C | 0.00 | 0.0 | 0.99 | 0.48 | 26.6 | 26.7 |
| S2 | 2.13 | 164.8 | 1.65 | 0.36 | 76.4 | 10.8 |
| S1 | 7.85 | 142.6 | 6.00 | 0.58 | 71.1 | 32.8 |
| N3 | 1.32 | 12.1 | 2.86 | 0.46 | 23.4 | 52.5 |
| N2 | 14.80 | 64.7 | 12.51 | 0.32 | 67.5 | 13.5 |
Note. — Parameters of each Gaussian component of the model brightness distribution: , polar coordinates of the center of the component relative to an arbitrary origin, with polar angle measured from north through east; , major and minor axes of the FWHM contour; , position angle of the major axis measured from north through east; , flux density at 5 GHz.
| Component | age | ||||
|---|---|---|---|---|---|
| (mas) | (∘) | (mas yr-1) | () | (yrs) | |
| C | reference | ||||
| S2 | 148.7 | ||||
| S1 | 145.1 | ||||
| N3 | 66.3 | ||||
| N2 | 79.5 | ||||
| Frequency | Flux Density |
|---|---|
| (GHz) | (mJy) |
| 1.4 | |
| 5.0 | |
| 8.4 | |
| 15 | |
| 22 | |
| 43 |