Molecular Hydrogen Formation on Ice Under Interstellar Conditions
Abstract
The results of experiments on the formation of molecular hydrogen on low density and high density amorphous ice surfaces are analyzed using a rate equation model. The activation energy barriers for the relevant diffusion and desorption processes are obtained. The more porous morphology of the low density ice gives rise to a broader spectrum of energy barriers compared to the high density ice. Inserting these parameters into the rate equation model under steady state conditions, we evaluate the production rate of molecular hydrogen on ice-coated interstellar dust grains.
Subject headings:
dust— ISM; abundances — ISM; molecules — molecular processes1. Introduction
The formation of molecular hydrogen in the interstellar medium (ISM) is a process of fundamental importance in astrophysics because H2 helps the initial cooling of clouds during gravitational collapse and enters, either in neutral or ionized form, most reaction schemes that make other molecules (Duley & Williams, 1984; Williams, 1998). It was recognized long ago that H2 cannot form in the gas phase efficiently enough to account for its observed abundance (Gould & Salpeter, 1963). It was proposed that molecular hydrogen formation takes place on dust grains that act as catalysts allowing the protomolecule to quickly release the 4.5 eV of excess energy in a time comparable to the vibration period of the highly vibrationally excited state in which it is formed.
The process of H2 formation on grains can be broken up into a few steps as follows. An H atom approaching the surface of a grain has a probability to become adsorbed. The adsorbed H atom (adatom) resides on the surface for an average time (residence time) before it desorbs. In the Langmuir-Hinshelwood mechanism, the adsorbed H atoms quickly equilibrate with the surface and diffuse on the surface of the grain either by thermal activation or tunneling. Furthermore, atoms that are deposited on top of already adsorbed atoms are rejected. When two adsorbed H atoms encounter each other, an H2 molecule may form with a certain probability (Williams, 1968; Hollenbach & Salpeter, 1970, 1971; Hollenbach et al., 1971; Smoluchowski, 1981; Aronowitz & Chang, 1985; Duley & Williams, 1986; Pirronello & Averna, 1988; Sandford & Allamandolla, 1993; Takahashi et al., 1999; Farebrother et al., 2000).
The sticking probability of H atoms on dust grains was calculated using semi-classical methods. Quantum mechanical calculations of the mobility of H atoms on a polycrystalline water ice surface, showed that tunneling between adsorption sites, would provide H adatoms with sufficient mobility to guarantee efficient H2 formation even at 10 K (Hollenbach & Salpeter, 1970, 1971; Hollenbach et al., 1971). The steady state production rate of molecular hydrogen, (cm-3 s-1) was expressed by
| (1) |
where (cm-3) and (cm s-1) are the number density and the speed of H atoms in the gas phase, respectively, (cm2) is the average cross-sectional area of a grain and (cm-3) is the number density of dust grains. The parameter is the fraction of H atoms striking the grain that eventually form a molecule, namely , where is the probability that an H adatom on the surface will recombine with another H atom to form H2. The probability for an H atom to become adsorbed on a grain surface covered by an ice mantle has been calculated by Buch and Zhang (1991) and Masuda et al. (1998). They found that depends on the surface temperature and on the energy of the irradiation beam. For a surface at 10 K and beam temperature of 350 K, Masuda et al. (1998) obtained a sticking coefficient around 0.5.
Alternative mechanisms, which were shown to operate in selected experiments on well characterized crystalline surfaces, are the Eley-Rideal mechanism and the hot-atom mechanism. In the Eley-Rideal mechanism, an atom from the gas phase impinges on another atom, which is already adsorbed, and reacts with it before becoming thermally accommodated with the surface. This mechanism has been verified experimentally for D atoms on a Cu surface (Rettner & Auerbach, 1996). In the hot-atom mechanism (Harris & Kasemo, 1981), an atom lands on the surface and moves from site to site at super-thermal speed until it reacts with another atom (before it thermally accommodates with the surface). In this case, the atom might fail to give up all of its incoming kinetic energy, or it might use some of the energy gained in becoming confined to the surface to move across it at super-thermal energy. The two mechanisms can be distinguished experimentally by measuring the cross-section for the reaction or the energy carried away from the just-formed molecule (Zecho et al., 2002). The kinetic energy, as well as the vibrational and rotational states of the desorbed molecule, are expected to depend on the surface mechanism through which it was formed.
In the last few years, we have conducted a series of experiments to study the formation of molecular hydrogen on dust grain analogues under conditions relevant to astrophysical environments (Pirronello et al. 1997a, ; Pirronello et al. 1997b, ; Pirronello et al., 1999; Roser et al., 2002, 2003). The experiments used well collimated beams of hydrogen and deuterium atoms. The production of HD that occurs on the surface of a dust grain analogue was measured both during the irradiation with the beams and during a subsequent temperature programmed desorption (TPD) experiment. In this case, the temperature of the sample is raised quickly to either desorb particles (atoms and molecules) that got trapped on the surface or to enhance their diffusion and subsequent reaction and/or desorption. In order to disentangle the process of diffusion from the one of desorption, separate experiments were carried out in which molecular species were irradiated on the sample and then were induced to desorb.
In an earlier set of experiments, the formation of molecular hydrogen was studied on samples of polycrystalline olivine and amorphous carbon (Pirronello et al. 1997a, ; Pirronello et al. 1997b, ; Pirronello et al., 1999) and the results were analyzed using rate equation models (Katz et al., 1999; Cazaux & Tielens, 2002, 2004). In this analysis the parameters of the rate equations were fitted to the experimental TPD curves. These parameters are the activation energy barriers for atomic hydrogen diffusion and desorption, the barrier for molecular hydrogen desorption and the fraction of molecules that desorb upon recombination. Using the values of the parameters that fit best the experimental results, the efficiency of hydrogen recombination on the polycrystalline olivine and amorphous carbon surfaces was calculated for interstellar conditions. By varying the temperature and flux over the astrophysically relevant range, the domain in which there is non-negligible recombination efficiency was identified. It was found that the recombination efficiency is highly temperature dependent. For each of the two samples there is a narrow window of high efficiency along the temperature axis, which shifts to higher temperatures as the flux is increased. For the astrophysically relevant flux range the high efficiency temperature range for polycrystalline olivine was found to be between K, while for amorphous carbon it is between K.
More recently, these studies were extended to different forms of water ice, namely high density ice (HDI) and low density ice (LDI) (Manico et al., 2001; Roser et al., 2002; Hornekaer et al., 2003). In these experiments it was seen that the type of amorphous ice affects both the kinetics of molecular hydrogen formation and its efficiency. We then carried out a detailed analysis of the new data using a rate equation model in order to obtain useful physical parameters for the modeling of chemistry in dense interstellar clouds. Specifically, the parameters of the rate equation model are fitted to the experimental TPD curves. These parameters are the activation energy barriers for diffusion and desorption of hydrogen atoms and hydrogen molecules as well as the population ratios of different types of adsorption sites for molecular hydrogen. Using the values of the parameters that fit best the experimental results, the efficiency of hydrogen recombination on the amorphous ice surfaces is obtained for values of the hydrogen flux and the surface temperature pertinent to a range of interstellar conditions.
2. Review of Experimental Methods
The experimental apparatus and measurement techniques were most recently described in Vidali et al. (2004). Here we give a brief outline. The apparatus consists of an ultra-high vacuum (UHV) chamber pumped by a cryopump and a turbo-molecular pump (operating pressure in the low 10-10 Torr range). The sample is placed in the center of the UHV chamber and is mounted on a rotatable UHV compatible liquid helium continuous flow cryostat. By varying the flow of liquid helium and by using a heater located behind the sample, it is possible to change the temperature of the sample over a wide range. In the thermal desorption experiments, the temperature is raised quickly from around 10 K to about 30 K. Higher temperatures are obtained at slower rates, as when the sample temperature is raised to 90 K to change the structure of the ice (see below) or to desorb the ice layers. The temperature is measured by an iron-gold/chromel thermocouple and a calibrated silicon diode placed in contact with the sample.
Atoms are sent to the surface of the sample via two triple differentially pumped atomic beam lines aimed at this surface. Each has a radio-frequency cavity in which the molecules are dissociated, optionally cooled to 200 K by passing the atoms through a cold channel, and then injected into the line. Dissociation rates are typically in the 75 to 90 range, and are constant throughout a run. Estimated fluxes are as low as 1012 (atoms cm-2s-1) (Roser et al., 2002).
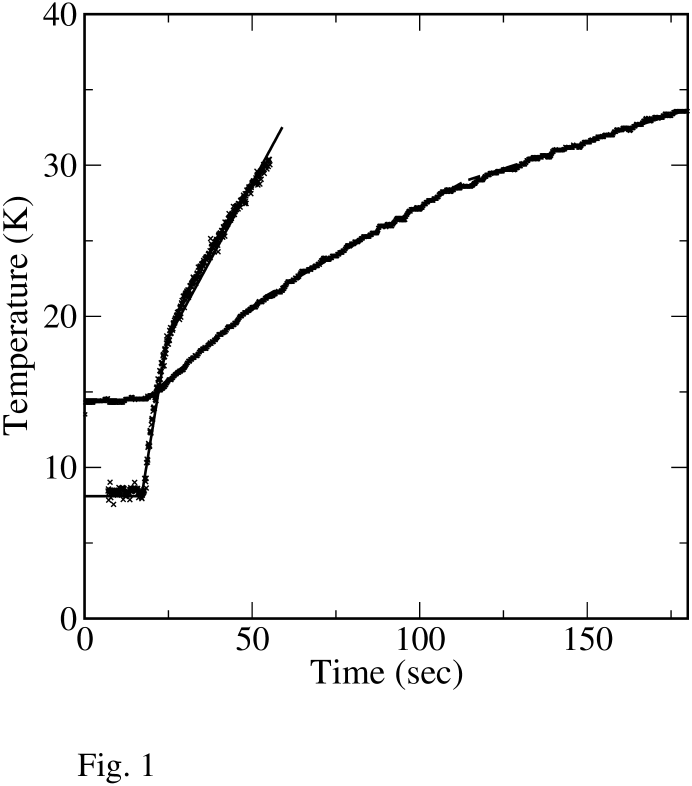
The experiment is done in two phases. First, beams of H and D atoms are sent onto the surface, at a constant irradiation rate , for a given period of time (from tens of seconds to tens of minutes) while the surface temperature is maintained at a constant value . At this time any HD formed and released is detected by a quadrupole mass spectrometer mounted on a rotatable flange in the main UHV chamber. In the second phase, starting at (the TPD phase), the irradiation is stopped and the sample temperature is quickly ramped at a rate ( 0.6 K/sec on average), and the HD signal is measured. The time dependence of the surface temperature, , during typical TPD experiments is shown in Fig. 1, and is approximated by a piecewise-linear fit. In the ideal case in which the heating rate is nearly constant, the time dependence of the flux and surface temperature can be approximated by
| (2a) | |||||
| (2b) | |||||
The HDI sample is prepared by directly depositing a measured quantity of water vapor via a stainless steel capillary placed in the proximity of the sample (a polished copper disk). Before deposition, the water undergoes repeated cycles of freezing and thawing to remove trapped gases. The sample is held at 10 K or lower during deposition and the deposition rate is 8 layers/sec, for a total thickness of the order of 1200 layers. This method of preparing the ice sample should produce a high density ice, or HDI (Jenniskens & Blake, 1994). The other phase, namely the low density amorphous ice or LDI, can be obtained from HDI by heating it. This transformation is gradual but irreversible and occurs over a broad temperature range starting from about 38 K. In our experiments, LDI is prepared by gradually heating the HDI to 90 K and holding the temperature at that value for at least 5 minutes. Then the sample is cooled down to 10 K. In the experiments analyzed here, the LDI sample was kept at a temperature between 9 and 11 K during the irradiation phase. During the TPD phase, care was exercised so that the sample didn’t reach a temperature close to or higher than 38 K (Roser et al., 2002; Vidali et al., 2004). Low and high density amorphous ice were shown to have similar characteristics and structure as interstellar ice mantles (Mayer & Pletzer, 1986; Jenniskens et al., 1995). The amorphous ice structure, which contains many pores with diameters ranging between 15-20 Å, can adsorb H2 molecules, that can diffuse into ice micro-pores where they can be trapped (Mayer & Pletzer, 1986; Langel et al., 1994).
3. Experimental Results
Irradiations with beams of H and D ("H+D" thereafter) were done both on LDI and HDI in order to explore the formation processes of HD molecules on these amorphous ice surfaces. In a separate set of experiments, beams of HD and D2 molecules were irradiated on the ice surfaces. The latter experiments do not involve formation of molecules. However, they allow us to isolate and better analyze some of the parameters relevant to the molecular formation processes explored directly in the former experiments. They also support our hypothesis that molecules that consist of different hydrogen isotopes behave quite similarly (although not exactly the same) as HD molecules and all of them could be treated by the same general rate equation model.
Using the methods described in the previous Section, the following experiments were carried out. The H+D irradiation runs were performed with different irradiation times (2, 4, 8, 12 and 18 minutes on LDI; 6, 8 and 18 minutes on HDI). The surface temperatures during irradiation were K in the LDI experiments and K in the HDI experiments. In the experiments with molecular beams the irradiation time was of 4 minutes. The surface temperatures during irradiation of HD and D2 on LDI were K and K, respectively. In Table 1 we present a list of the experimental runs analyzed in this paper. During the TPD runs, the sample temperature is monitored as a function of time. The time dependence of the sample temperature during typical temperature ramps is shown in Fig. 1 for LDI (solid line) and HDI (dashed line). The temperature ramps deviate from linearity but they are highly reproducible. The symbols show the experimental measurements and the lines are piecewise-linear fits. For the LDI experiments a good fit is obtained with two linear segments, with an average heating rate of K/sec over the whole ramp. For the HDI experiments a good fit is obtained with three linear segments, with an average heating rate of K/sec. Although the temperature ramps deviate from linearity, most of the structure of the TPD peaks takes place within a temperature range in which it is linear to a very good approximation. The analysis of the data is done using these temperature ramps, thus any possible effect of the deviation from linearity is taken into account. Such deviations are found to be minor.
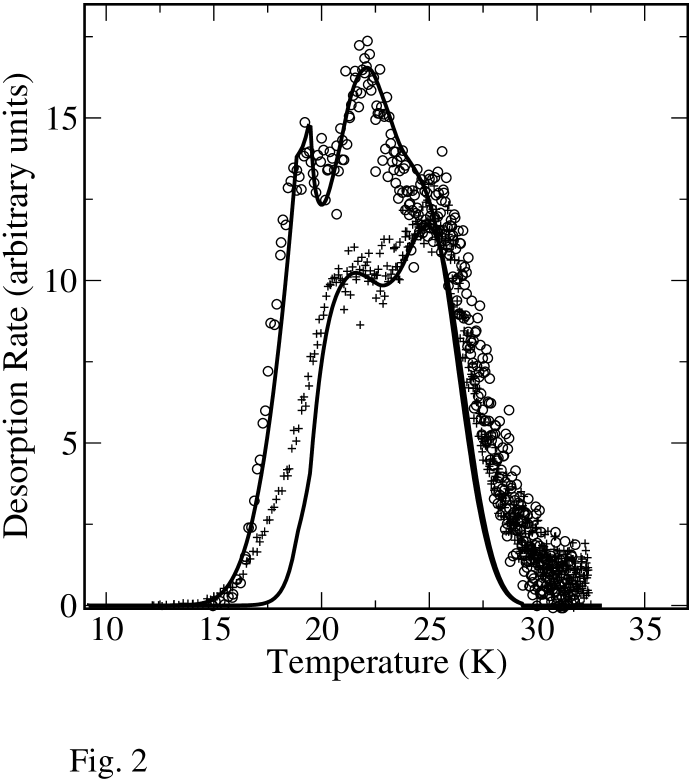
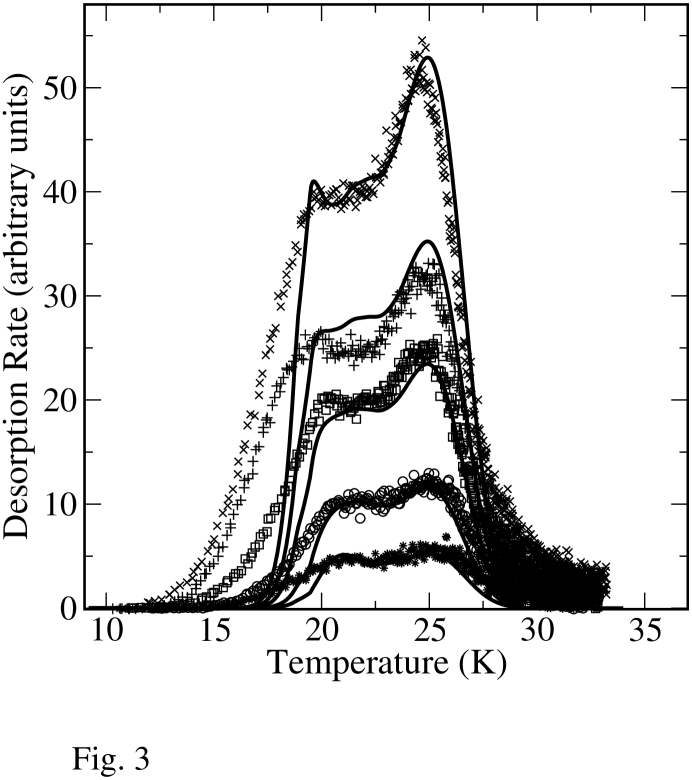
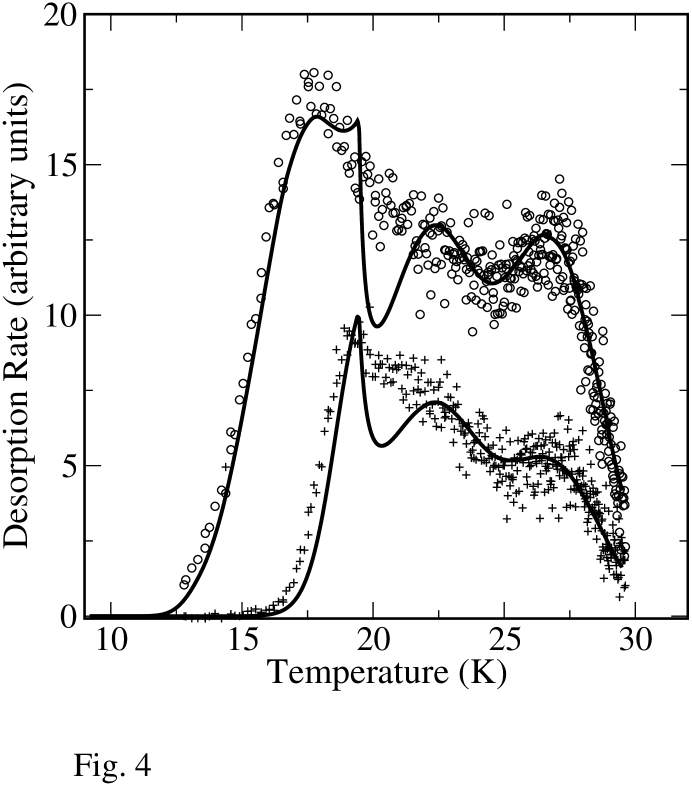
The desorption rates of molecules vs. surface temperature during the TPD runs are shown in Figs. 2-7. In Fig. 2 we present the desorption rate of HD molecules after irradiation by HD and H+D on LDI. In both cases the TPD curves are broad. In the case of HD irradiation, three peaks can be identified in the TPD curve. For H+D irradiation there are only two peaks. Interestingly, they coincide on the temperature axis with two of the three peaks obtained for HD irradiation. In Fig. 3 we show the desorption rate of HD molecules after irradiation by H+D on LDI for several irradiation times between 2 minutes and 18 minutes. As in Fig. 2, all these TPD curves exhibit two peaks. The position of the high temperature peak is found to be independent of the irradiation time, indicating that this peak exhibits first order kinetics. The low temperature peak shifts to the right as the irradiation time decreases, thus, this peak exhibits second order kinetics. Fig. 4 shows the desorption rate of D2 molecules after D+D and D2 irradiation on LDI. These TPD curves are also broad, and are qualitatively similar to those of HD desorption, shown in Fig. 2.
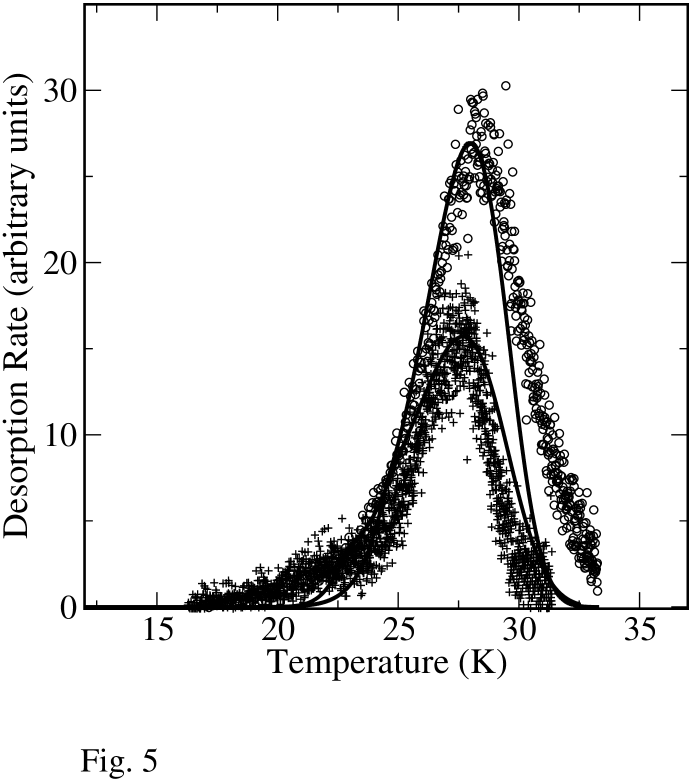
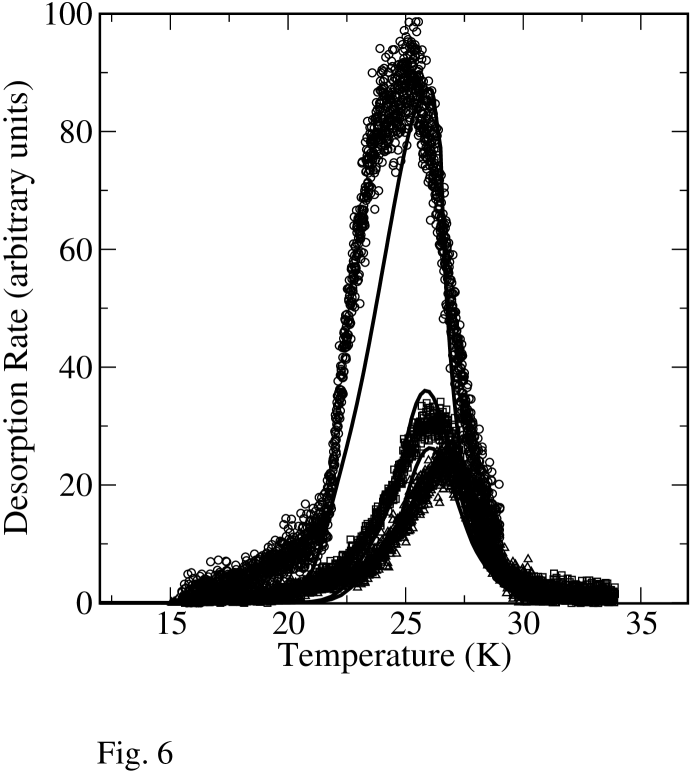
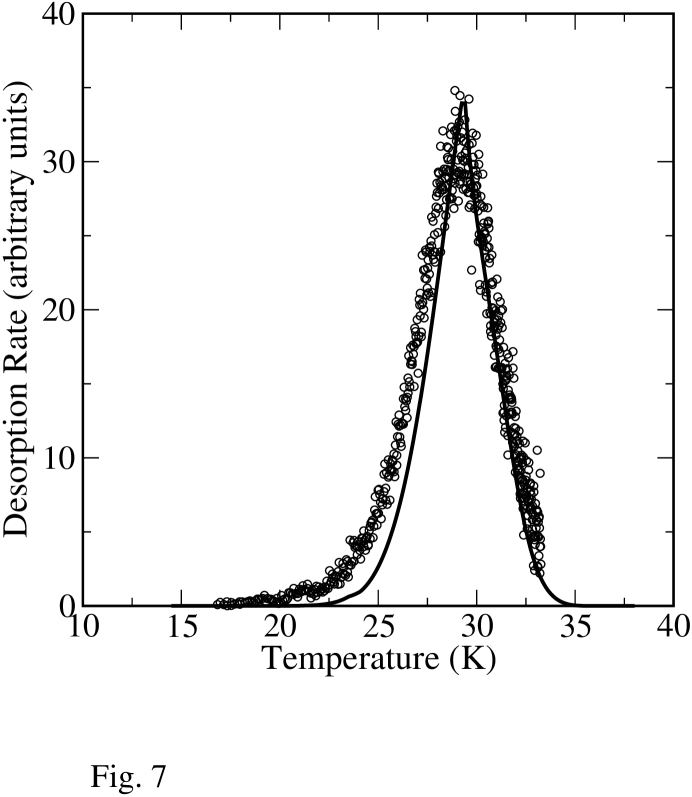
In Fig. 5 we show the desorption rate of HD molecules after irradiation by HD and H+D on HDI. Here the TPD curves are narrower and include only one peak. In Fig. 6 we show the desorption rate of HD molecules after irradiation by H+D on HDI for three irradiation times. The peak shifts to the right as the irradiation time decreases, namely, it exhibits second order desorption. Fig. 7 shows the desorption rate of D2 molecules after D2 irradiation on HDI. A single peak is observed, qualitatively similar to the one shown in Fig. 5 for HD.
In the experiments in which beams of H+D atoms were irradiated on LDI and HDI samples, most of the HD molecules detected were formed during the heat pulse. Only a small fraction of them were formed during the irradiation process (Roser et al., 2002). This indicates that at least under our experimental conditions, prompt-reaction mechanisms (Duley & Williams, 1986) or fast tunneling (Hollenbach et al., 1971) do not play a major role in the formation of molecules.
4. The Rate Equation Models
In the TPD curves studied here most of the adsorbed hydrogen is released well before a temperature of 40 K is reached. We thus conclude that the hydrogen atoms on the surface are trapped in physisorption potential wells and are only weakly adsorbed. The mechanism for the formation of H2 (as well as HD and D2) is assumed to be the Langmuir-Hinshelwood (LH) scheme. In this scheme, the rate of formation of molecular hydrogen is diffusion limited. This assumption is justified by the Langmuir-like behavior observed in the desorption curves.
The analysis of thermal programmed desorption experiments usually starts with the Polanyi-Wigner expression for the desorption rate R(t):
| (3) |
where is the coverage of reactants on the surface, is the order of desorption, is the attempt frequency, is the effective activation energy for the dominant recombination and desorption process and is the sample temperature. In the TPD experiment, first order () desorption curves exhibit asymmetric peaks with a sharp drop-off on the high temperature side. The position of the peak is insensitive to the initial coverage, determined by the irradiation time. Second order desorption curves () exhibit symmetric peak shapes. These peaks shift toward lower temperatures as the initial coverage is increased (Chan et al., 1978). An important assumption is that all activation energy barriers are coverage independent. This assumption may not apply at high coverage. However, at the low coverages obtained in the experiments analyzed here (up to of a layer), it is a reasonable assumption.
We introduce two models for describing the TPD curves: a simplified model which succeeds in describing the main characteristics of the TPD curves and a more complete model which describes them using a more general and accurate view.
4.1. The Simple Model
Consider an experiment in which a flux of H atoms is irradiated on the surface. H atoms that stick to the surface hop as random walkers. The hopping atoms may either encounter each other and form H2 molecules, or desorb from the surface. As the sample temperature is raised, both the hopping and desorption rates quickly increase. In the models used here, there is no distinction between the H and D atoms, namely the same diffusion and desorption barriers are used for both isotopes.
In the models we assume a given density of adsorption sites on the surface. Each site can adsorb either an H atom or an H2 molecule. In terms of the adsorption of H atoms, all the adsorption sites are assumed to be identical, where the energy barrier for H diffusion is and the barrier for desorption is . As for the adsorption of H2 molecules, we assume that the adsorption sites may differ from each other. In particular, we assume that the population of adsorption sites is divided into types, where a fraction of the sites belong to type , where , and . The energy barrier for desorption of H2 molecules from an adsorption site of type is .
This model is motivated by the TPD curves obtained after irradiation by HD and D2 molecules on LDI, shown in Figs. 2 and 4, respectively. These TPD curves are broad and can be divided into three peaks. We interpret this feature as an indication that there are three types of adsorption sites for molecules, which differ from each other in the energy barriers for desorption.
Let [in monolayers ()] be the coverage of H atoms on the surface, namely the fraction of adsorption sites that are occupied by H atoms. Similarly, let (also in ) be the coverage of H2 molecules that are trapped in adsorption sites of type , where . Clearly, this coverage is limited by the number of sites of type and therefore . Since we assume that each site can host only one atom or one molecule, the coverage cannot exceed a monolayer, and thus .
Our analysis shows that for LDI one needs three types of molecular adsorption sites, namely , while for HDI good fits are obtained with . For the case of LDI we thus obtain the following set of rate equations
| (4a) | |||||
| (4b) | |||||
| (4c) | |||||
| (4d) | |||||
The first term on the right hand side of Eq. (4a) represents the incoming flux in the Langmuir kinetics. In this scheme H atoms deposited on top of H atoms or H2 molecules already on the surface are rejected. represents an effective flux (in units of /sec), namely it already includes the possibility of a temperature dependent sticking coefficient. In practice we find that for the conditions studied here the Langmuir rejection term is negligible and it is thus ignored in the simulations. The second term in Eq. (4a) represents the desorption of H atoms from the surface. The desorption coefficient is
| (5) |
where is the attempt rate (standardly taken to be ), is the activation energy barrier for desorption of an H atom and is the temperature. The third term in Eq. (4a) accounts for the depletion of the H population on the surface due to diffusion-mediated recombination into H2 molecules, where
| (6) |
is the hopping rate of H atoms on the surface and is the activation energy barrier for H diffusion. Here we assume that there is no barrier for recombination. If such a barrier is considered, it can be introduced as discussed in Pirronello et al. (1997b, 1999).
Eqs. (4b)-(4d) describe the population of molecules on the surface. The first term on the right hand side of each of these three equations represents the formation of H2 molecules that become adsorbed in a site of type , 2 or 3. The second term in Eqs. (4b)-(4d) describes the desorption of H2 molecules from sites of type , where
| (7) |
is the H2 desorption coefficient and is the activation energy barrier for H2 desorption from an adsorption site of type . The H2 production rate is given by:
| (8) |
This model can be considered as a generalization of the Polanyi-Wigner model [see Eq. (3)]. It gives rise to a wider range of applicability, compared to Eq. (3). In particular, it describes both first order and second order desorption kinetics (or a combination) for different regimes of temperature and flux (Biham et al., 1998).
Experiments that involve irradiation by molecules are useful since they enable an independent evaluation of the parameters of molecular adsorption on the surface. Consider the case where a flux of H2 molecules is irradiated on the surface. In this case Eq. (4a) is no longer relevant. The H2 molecules on the surface are distributed between the different types of adsorption sites, in proportion to the population ratios . Each one of Eqs. (4b)-(4d) can now be treated as independent and solved analytically. The TPD curve consists of three first order peaks, at temperatures determined by the desorption barriers , . The sizes of these peaks are determined by the population ratios . Given a TPD curve, the energy barriers can be obtained from the temperatures of the corresponding peaks. Solving for the maximal desorption rate by taking its derivative with respect to the temperature we obtain
| (9) |
In general, the parameters , can be obtained by fitting the TPD curve as a sum of Gaussians. Each of the ’s is obtained as the ratio between the area below the corresponding Gaussian and the total area below the TPD curve. In the case of HDI such procedure is not needed because the TPD curve can be fitted with a single type of molecular adsorption site.
4.2. The Complete Model
The simple model presented above provides good fits to the results of the experiments in which H+D, HD and D2 were irradiated on HDI (Figs. 5-7). In this case it was assumed that there is only a single type of molecular adsorption site. In experiments on LDI, where several types of molecular adsorption sites are assumed, the fitting of the TPD curves can be improved by using a more complete model. In this model the H2 molecules are allowed to diffuse between the different types of adsorption sites. For the case of LDI (J=3), the complete model takes the form
| (10d) | |||||
The first equation is identical to the corresponding one in the simple model, namely Eq. (4a). The first and third terms on the right hand side of Eqs. (10)-(10d) are the same as those that appear in Eqs. (4b)-(4d) of the simple model. The second and fourth terms describe the diffusion of H2 molecules between adsorption sites of different types, where and is the activation energy for hopping of an H2 molecule out of a site of type . The second terms account for the hopping of molecules out of adsorption sites of type , while the fourth terms account for their re-distribution between adsorption sites of the three different types.
5. Analysis of Experimental Results
In this Section we use the rate equation models to fit the experimental results, and thus obtain the parameters that describe the diffusion and desorption of hydrogen atoms and molecules on ice surfaces. We use a combination of analytical and numerical tools. In particular, the numerical integration of the rate equation models is done using the Runge-Kutta stepper. The result of the integration is a set of TPD curves that are a function of the chosen set of parameters, some of which can be determined analytically from the experimental TPD curves. The data obtained from each TPD run includes the time dependence of the flux and temperature . The temperature is measured directly via a thermocouple. The flux (/sec) is estimated as described elsewhere (Vidali et al., 1998). An approximate value for , in the required units of /sec, can be obtained by integrating the TPD spectra, generating the total yield of the various experiments. The flux is then obtained from the exponential fit indicated by Langmuir kinetics. It is important to stress that this is a lower bound value for the flux, and this value is reached only if there is no desorption of H atoms during the TPD runs. In the analysis we assume that each of the energy barriers , , represents a Gaussian distribution of energy barriers centered around it. Although the Gaussian distribution provides much better fits, the important features of the curves depend only on the parameters mentioned above. The Gaussian distribution is inserted into the equations by effectively splitting each of the Eqs. (10)-(10d) into about ten equations, each with a different energy barrier for H2 desorption according to the Gaussian distribution around its central value.
5.1. Analysis of Experiments with Irradiation of Molecules
The TPD curves obtained after irradiation of HD and D2 on HDI are narrow and exhibit a single peak (Figs. 5 and 7). In contrast, the TPD curves obtained after irradiation of those molecules on LDI are broad and three distinct peaks can be identified in them (Figs. 2 and 4). Since no surface reactions take place in these experiments, these peaks are of first order kinetics. Thus, one can use Eq. (9) to obtain the activation energy for the desorption of H2 atoms that are trapped in an adsorption site of type from the surface. This calculation is done in the context of the simple model.
Using the complete model in the case of LDI, with , does not change the positions of the three peaks. The complete model allows diffusion of molecules between different types of adsorption sites. As a result, there is a flow of molecules from the relatively shallow adsorption sites towards the deeper ones. Thus, the relative sizes of the three sub-populations of molecules adsorbed on LDI become temperature dependent.
The fitting curves for the HDI experiments with HD and D2 are shown in Figs. 5-7. Some uncertainty exists in the value of the energy barrier for HD desorption from HDI. The value meV was obtained from the experiments in which the irradiation times were relatively short (Fig. 5). The experiments in which the irradiation time was long give rise to the somewhat lower value of meV (Fig 6). Additional uncertainty arises due to the choice of the choice of the attempt frequency . A deviation by an order of magnitude in its value would modify the resulting energy barriers by 3-4 meV.
In the case of LDI, where three types of adsorption sites can be identified, the situation is more complicated. The energy barriers for desorption of H2 molecules from these three types of adsorption sites are obtained from Eq. (9). The population ratios , are obtained from fitting the TPD curves using the rate equations. These TPD curves are fitted very well using the complete rate equation model (Figs. 2 and 4). Within this paremetrization, a simplifying assumption used here is that the hopping rate out of an adsorption site of type is linearly proportional to the desorption rate from the same site. The experimental data is best fitted when the ratio between these two barriers is around 1, namely . Assuming the same attempt frequency for the two processes this indicates that . This is an unusual result, since typically the barriers for desorption are higher than the barriers for diffusion. However, it may indicate that in the porous LDI the dominant diffusion process is, in fact, desorption and re-adsorption on the surface within the pores. Note that the energy barriers for desorption of molecules are obtained directly using Eq. (9), thus the fitting process is needed only for the diffusion barrier. An additional parameter is the width of the narrow Gaussian distribution of the energy barriers for each of the three types of adsorption sites. The energy barriers for desorption of molecules from the different types of adsorption sites and the population ratios of these sites are presented in Tables 2 and 3, respectively.
5.2. Analysis of Experiments with Irradiation of Atoms
In the experiments with irradiation of H and D atoms (H+D for brevity) or of D atoms only (D+D), the adsorbed atoms diffuse on the surface and recombine. The experimental TPD curves for the HD and D2 molecules can be fitted using either the simple or the complete rate equation models. The parameters that characterize the behavior of hydrogen molecules on the surface, namely the desorption barriers and the population ratios , are available from the experiments with molecular irradiation. Thus, the only fitting parameters that remain are the energy barriers for diffusion and desorption of hydrogen atoms, namely and . In Figs. 2 and 3 one observes that the two peaks in the TPD curves obtained after irradiation with H+D on LDI coincide with the two higher peaks obtained after irradiation with HD molecules. Similarly, the peak obtained after irradiation of H+D on HDI coincides with the peak obtained after irradiation of HD molecules (Fig. 5). The location of this peak is determined by the desorption barriers of HD molecules, no matter whether these molecules were deposited or formed on the surface.
In Fig. 3 we present five TPD curves for H+D irradiation on LDI, for different irradiation times. In each curve one can identify two peaks. The location of the high temperature peak is independent of the irradiation time. This is an indication of first order kinetics, namely that the molecules desorbed at this stage were formed at a lower temperature. They remained on the surface until the temperature became sufficiently high for them to desorb. The low temperature peak in each curve in Fig. 3 shifts slightly to the right as the irradiation time is reduced. This is a feature of second order kinetics, indicating that within this peak the molecules were desorbed upon formation. Our interpretation is that these molecules were formed in shallow adsorption sites and thus easily desorbed at the temperature in which they recombined. These shallow adsorption sites can be identified with those that correspond to the leftmost among the three peaks in the molecular irradiation experiment shown in Fig. 2. The fact that the same set of parameters can fit all the curves in Fig. 3, obtained for different irradiation times, as well as all the other experiments on LDI, provides very strong evidence in favor of our models. Similarly, a single set of parameter provides very good fits to all the experiments on HDI. These parameters are presented in Tables 2 and 3.
5.3. Implications to Interstellar Chemistry
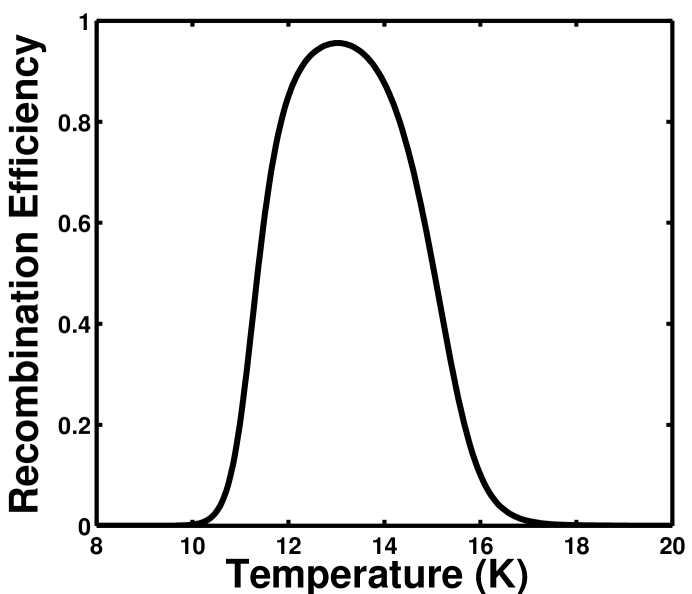
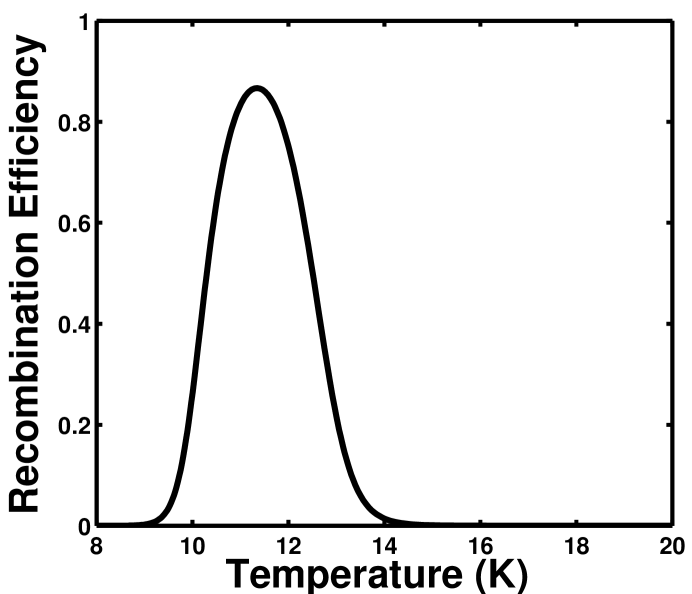
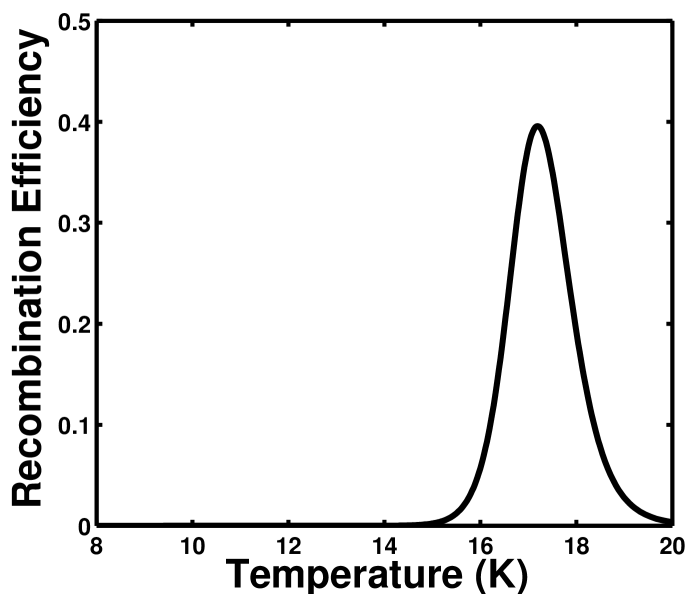
Using the parameters obtained from the experiments we now calculate the recombination efficiency of H2 molecules on ice surfaces under interstellar conditions. The recombination efficiency is defined as the fraction of hydrogen atoms adsorbed on the surface which come out as molecules. In Fig. 8 we present the recombination efficiency of H2 molecules vs. surface temperature for LDI under flux of 0.73 ML s-1. This flux is within the typical range for both diffuse and dense interstellar clouds. This particular value corresponds to a density of H atoms in the gas phase of 10 (atoms cm-2), gas temperature of 100 K and adsorption sites per cm2 on the surface (Biham et al., 2001).
A window of high efficiency is found between 11-16K. At higher temperatures atoms desorb from the surface before they have sufficient time to encounter each other. At lower temperatures diffusion is suppressed while the Langmuir rejection leads to saturation of the surface with immobile H atoms and recombination is suppressed. At these low temperatures, the steady-state coverage is high and the rate equation model may not apply. As already suggested in Pirronello et al. (1999), mechanisms such as Eley-Rideal or diffusion by tunneling, which are not taken into account in the model, may become significant in this regime. Nevertheless, we can speculate that if the Langmuir rejection remains significant even at higher coverage, the trend in recombination efficiency shown should remain qualitatively correct. Luckily, such low temperatures are rarely of astrophysical interest. At high temperature atoms desorb from the surface before they have sufficient time to recombine, thus inhibiting hydrogen recombination at high temperature. For both high and low density ice the calculated asymptotic values of coverage are very low and well within the regimes of experimentation and subsequent numerical simulation. Consequently, the relevance of the model is justified. Our results indicate that recombination efficiency of hydrogen on both HDI and LDI is high in the temperature range of 14-20 K which is relevant to the interstellar clouds. Therefore these ice surfaces seem to be good candidates for interstellar grain components on which hydrogen may recombine with high efficiency.
6. Discussion
One of the important features demonstrated by these experiments is the relevance of the surface morphology to the recombination rate of H2 molecules. Surfaces of amorphous ice are difficult to model due to the paucity of morphological information on either actual ISM ice coated grains or their laboratory analogues. This difficulty gives rise to some uncertainty about the role of quantum effects. In principle, quantum tunneling of H atoms on the surface should be considered. However, these experiments, much like earlier experiments on amorphous carbon and polycrystalline olivine samples (Pirronello et al. 1997b, ), indicate that the mobility of the hydrogen atoms is very low at low temperatures. Thus, the effect of tunneling appears to be small. Cazaux and Tielens showed that quantum effects might be important at high coverage. However, at the low coverages of H atoms on interstellar grains, tunneling effects are expected to be very small as can be seen in Fig. 6b in Ref. (Cazaux & Tielens, 2004), obtained for low irradiation (exposure) times.
The effect of the ice morphology is best seen in the difference between the types of adsorption sites and their depth. The more porous structure of the LDI is reflected in the broad distribution of the activation energies for desorption from different adsorption sites which spans the range between 40 to 60 meV (Jenniskens et al., 1995). In comparison, the energy barriers for desorption from HDI exhibit a narrow distribution around 68.7 meV. The energy barriers for diffusion of H atoms on the ice surfaces are found to be higher than those obtained earlier for more smooth surfaces such as the polycrystalline olivine analyzed by Katz et al. (1999). Thus, the mobility of H atoms on the highly amorphous ice is relatively low, in qualitative agreement with the findings of Smoluchowski (1983). The energy barriers for diffusion and desorption of H atoms and molecules on amorphous ice were calculated using a detailed model of the amorphous ice structure and the interactions at the atomic scale (Buch & Czerminski, 1991; Buch & Zhang, 1991; Hixson et al., 1992). The energy barriers for H desorption were found to be distributed between 26 to 57 meV, while the barriers for diffusion were found to be between 13 to 47 meV. Our results for LDI are in good agreement with these calculations, while for HDI our barriers are somewhat higher (see Tables 2 and 3). For molecules they find a distribution of activation energy barriers for desorption in the range between 400 and 1200 K, namely 33 meV - 133 meV. Our three barriers for the desorption of HD molecules are in the range of 46 - 61 meV, namely around the center of the calculated distribution. Thus, our model captures the effects of the amorphous ice structure and interactions, in agreement with detailed calculations at the atomic scale.
In the experiments we use a combination of the H and D isotopes. In most cases the production rate of HD is measured, complemented by some measurements of D2 formation. Experiments measuring H2 formation are difficult to carry out. This is due to the existence of background H2 which is the most abundant residual gas in the well baked ultra-high vacuum chamber. Even the small percentage of undissociated molecules that are sent with the atomic beam can influence the results. The use of hydrogen isotopes enables us to perform measurements with much more accuracy, and obtain the important physical parameters. The extrapolation of our results to processes that involve only H and H2 is non-trivial. However, the experiments in which the formation of HD and D2 were analyzed, enable us to examine the isotopic differences. The analysis shows that variations between the energy barriers involved in the HD and D2 production processes do exist. Nonetheless, the two processes are qualitatively similar and the only difference is in a small increment in the energy barriers of the D2-formation process in comparison to the HD. We thus conclude that the energy barriers we obtain provide a good approximation to those involved in the production of H2 on ice surfaces.
Previous rate equation models, used in analysis of hydrogen recombination on carbon and olivine (Katz et al., 1999; Cazaux & Tielens, 2002, 2004), assumed that a significant fraction (denoted by ) of the hydrogen molecules, desorb from the surface upon formation (note that in these three papers had a different meaning than in the present paper). The rest of the molecules (namely, a fraction of them) remain on the surface and desorb thermally at a later stage. The origin of the parameter remained unclear, but it was necessary in order to fit the data.
The model used in the present paper provides a physical motivation for the parameter , based on a different interpretation of the fact that part of the molecules quickly desorb. It is based on the broad distribution of the energy barriers for desorption of hydrogen molecules which exhibits three types of adsorption sites. According to this model the recombined molecules equilibrate with the surface and reside in adsorption sites until thermal desorption takes place. Molecules formed in the most shallow adsorption sites desorb quickly because by the time they are formed, the surface temperature is already high enough to activate their thermal desorption. The fraction, of the shallow adsorption sites among all the molecular adsorption sites is obtained from the experiments in which molecules are irradiated.
As mentioned above, in the models used here it is assumed that hydrogen molecules do not desorb immediately upon formation. Instead, they stay trapped in the adsorption sites or diffuse between them until thermal desorption takes place. Consequently, one needs to consider mechanisms for the dissipation of the excess energy acquired from the recombination process in order to prevent prompt desorption. Although classical molecular dynamics simulations for H2 formation on amorphous ice performed by Takahashi et al. (1999) give a large average kinetic energy (530 meV) to the desorbing molecules, both Roser et. al. (2003) and independently Hornekaer et al. (2003) showed experimentally that this kinetic energy is much smaller (3 meV), in agreement with our assumption that the excess energy is dissipated elsewhere. There are various mechanisms for efficient heat transfer from the molecule to the surface. One possible mechanism may be due to the very irregular structure of the sample surfaces. Both LDI and HDI surfaces are disordered. Even if molecules are promptly released upon formation, they do not necessarily go directly into the vacuum but they might undergo a multiple series of collisions in which part of their energy is released to the solid. These multiple hits might lead to a subsequent re-adsorption of the molecule on the ice surface. Such a mechanism was already identified for H and D atoms impinging on an amorphous ice particle (Buch & Zhang, 1991).
The experiments done by our group as well as by Hornekaer et al. have explored several types of ice morphology. The experiments analyzed here were done on amorphous ice of more than 1000 ML, where we have used two different ices, LDI and HDI (both amorphous and porous). The experiments by Hornekaer et. al. Hornekaer et al. (2003) were done on ice that was prepared using the same procedure used by our group to produce the HDI, with 2000 ML thickness. Their atom beam fluxes were (atoms cm-2 sec-1), namely about one order of magnitude higher than the fluxes used in our experiments. The range of exposure times was comparable. Hornekaer et al. investigated the kinetics of HD formation and measured the efficiency of recombination and the energetics of the molecules released from the ice layer after formation. The efficiency values they obtained are close to those obtained by our group on amorphous ice. The energy distribution of molecules formed showed that at least in porous amorphous ice, molecules are thermalized by collisions with the walls of pores (where they are formed) before they emerge into the gas phase. Hornekaer et al. performed TPD experiments in which they irradiated H and D atoms either simultaneously or sequentially after waiting a delay time interval before dosing the other isotope. On porous ice the results they obtained are consistent with a recombination occurring quickly after atom dosing due to a high mobility of the adsorbed atoms even at temperature as low as 8 K. This high mobility was attributed either to quantum mechanical diffusion or to the so called hot atom mechanism, where thermal activation is not likely to play a significant role at this temperature. This conclusion is sensible in light of the high coverages of H and D atoms irradiated in their experiments, which required the adsorbed atoms to diffuse only short distances before encountering each other. As already suggested by Pirronello et al. (2004a,b) and Vidali et al. (2005), the hot atom mechanism may be able to provide the required mobility. In this case H and D atoms retain a good fraction of their gas phase kinetic energy during the accommodation process (Buch & Zhang, 1991; Takahashi & Uehara, 2001). This enables them to travel on the ice surface and inside its pores for several tens of Angstroms exploring several adsorption sites and recombining upon encountering already adsorbed atoms. However, in our experiments, because of the low coverage, the number of sites explored by the hot atom is not large enough to encounter an adsorbed atom and react with it with significant probability (Vidali et al., 2005). Thus, there is no contradiction between the interpretations that molecular hydrogen formation is dominated by the hot atom mechanism at high coverage and by thermally activated mobility of the adsorbed H atoms at low coverage.
In addition, Hornekaer et al. studied non-porous ice with only 20 ML. In this paper we have not analyzed such non-porous samples and therefore cannot provide any comparison in this case. On the other hand, we have used LDI for which Hornekaer et al. (2003) do not provide analogous results that enable a comparison. Our results and analysis show that on LDI the recombination of H atoms is thermally activated, and it is not efficient at low temperatures.
In their analysis, Cazaux and Tielens (2004) considered a rate equation model with a single energy barrier for molecular desorption from carbon and olivine surfaces. In their model chemisorption sites play a role in the recombination process of hydrogen molecules and each hydrogen isotope is treated differently. Although chemisorption sites might play a role in the recombination process, these sites do not seem to play an important role, at least not at the conditions explored in our experiments (low temperatures and low coverage as expected for interstellar dense cloud environments). However, the analysis of Cazaux and Tielens may provide a clue on H2 formation in photon dominated regions. We have not treated each atomic isotope differently but instead we used different effective averaged values for the experiments involving H and D atoms and those involving only D atoms. Consequently obtained a model that requires fewer fitting parameters.
7. Summary
Experimental results on the formation of molecular hydrogen on amorphous ice under conditions relevant to interstellar clouds were analyzed using rate equation models. By analyzing the results of TPD experiments and fitting them to rate equation models, the essential parameters of the process of molecular hydrogen formation on ice surfaces were obtained. These parameters include the activation energy barriers for diffusion and desorption of hydrogen atoms and molecules on the ice surface. While we identify only one type of adsorption site for hydrogen atoms, three types of adsorption sites are found for molecules on LDI, with different activation energies. The parameters that determine what fraction of the molecular adsorption sites belong to each type are also found. Our model enables a unified description of several first and second order processes that involve irradiation by either hydrogen atoms or molecules, all within the framework of a single model.
The rate equation model allows us to extrapolate the production rate of hydrogen molecules from laboratory conditions to astrophysical conditions. It thus provides a quantitative evaluation of the efficiency of various ice surfaces as catalysts in the production of hydrogen molecules in interstellar clouds. It is found that the production efficiency strongly depends on the surface temperature. Both types of ice samples studied here exhibit high efficiency within a range of surface temperatures which is relevant to dense molecular clouds which include ice-coated dust grains.
8. Acknowledgments
This work was supported by the Adler Foundation for Space Research and the Israel Science Foundation (O.B), by NASA through grants NAG5-11438 and NAG5-9093 (G.V), and by the Italian Ministry for University and Scientific Research through grant 21043088 (V.P).
References
- Aronowitz & Chang (1985) Aronowitz S., & Chang S., 1985, ApJ, 293, 243.
- Biham et al. (1998) Biham, O., Furman, I., Katz, N., Pirronello, V., & Vidali, G. 1998, MNRAS, 296, 869.
- Biham et al. (2001) Biham, O., Furman, I., Pirronello, V., & Vidali, G. 2001, ApJ, 553, 595.
- Buch & Czerminski (1991) Buch, V., & Czerminski, R. 1991, J. Chem. Phys., 95, 8.
- Buch & Zhang (1991) Buch, V., & Zhang, Q. 1991, ApJ, 379, 647.
- Cazaux & Tielens (2002) Cazaux, S., & Tielens, A. G. G. M. 2002, ApJ, 575, L29.
- Cazaux & Tielens (2004) Cazaux, S., & Tielens, A. G. G. M. 2004, ApJ, 604, 222.
- Chan et al. (1978) Chan, C.M., Aris, R., & Weinberg, W.H. 1978, Appl. Surf. Sci. 1, 360.
- Duley & Williams (1984) Duley, W.W., & Williams, D.A. 1984, Interstellar Chemistry (Academic Press, London).
- Duley & Williams (1986) Duley, W.W., & Williams, D.A. 1986, MNRAS, 223, 177.
- Farebrother et al. (2000) Farebrother, A.J., Meijer A.J.H.M., Clary D.C., & Fisher A.J. 2000, Chem. Phys. Lett., 319, 303.
- Gould & Salpeter (1963) Gould, R.J., & Salpeter, E.E. 1963, ApJ., 138, 393.
- Harris & Kasemo (1981) Harris, J., & Kasemo, B. 1981, Surf. Sci., 105, L281.
- Hixson et al. (1992) Hixson, H.G., Wojcik, M.J., Devlin, M.S., Devlin, J.P. and Buch, V. 1992, J. Chem. Phys., 97, 753.
- Hollenbach & Salpeter (1970) Hollenbach, D., & Salpeter, E.E. 1970, J. Chem. Phys. 53, 79.
- Hollenbach & Salpeter (1971) Hollenbach, D., & Salpeter, E.E. 1971, ApJ, 163, 155.
- Hollenbach et al. (1971) Hollenbach, D., Werner M.W., & Salpeter, E.E. 1971, ApJ, 163, 165.
- Hornekaer et al. (2003) Hornekaer, L., Baurichter, A., Petrunin, V. V., Field, D. & Luntz, A. C. 2003, Science, 302, 1943.
- Jenniskens & Blake (1994) Jenniskens, P., & Blake, D.F. 1994, Science, 265, 753.
- Jenniskens et al. (1995) Jenniskens, P., Blake, D.F., Wilson, M.A. & Pohorille, A. 1995, ApJ, 455, 389.
- Katz et al. (1999) Katz, N., Furman, I., Biham, O., Pirronello V. & Vidali, G. 1999, ApJ, 522, 305.
- Langel et al. (1994) Langel, W., Fleger, H.W., & Knözinger, E. 1994, Ber. Bunsengesch. Phys. Chem., 98, 81.
- Manico et al. (2001) Manico, G., Raguni, G., Pirronello, V., Roser, J.E. & Vidali G. 2001, ApJ, 548, L253.
- Masuda et al. (1998) Masuda, K., Takahashi, J., and Mukai, T. 1998, A&A, 330, 773.
- Mayer & Pletzer (1986) Mayer, E., & Pletzer, R. 1986, Nature, 319, 298.
- Pirronello & Averna (1988) Pirronello, V., & Averna D. 1988, A&A, 201, 196.
- (27) Pirronello, V., Liu, C., Shen L., & Vidali, G. 1997a, ApJ, 475, L69.
- (28) Pirronello, V., Biham, O., Liu, C., Shen L., & Vidali, G. 1997b, ApJ, 483, L131.
- Pirronello et al. (1999) Pirronello, V., Liu, C., Roser J.E, & Vidali, G. 1999, A&A, 344, 681.
- (30) Pirronello, V., Manicó, G., Roser, J.E. and Vidali, G. 2004a in Astrophysics of Dust, Edited by Witt, A. et al., (ASP Series, Sheridan Books Ann Arbor, MI, USA) p. 529
- (31) Pirronello, V., Manicó, G., Roser, J.E. and Vidali, G., 2004b The Dense Interstellar Medium in Galaxies, Edited by Pfalzner, S. et al. (Springer-Verlag, Berlin) p. 525
- Rettner & Auerbach (1996) Rettner, C.T., & Auerbach, D.J., 1996, J. Chem. Phys., 104, 2732.
- Roser et al. (2002) Roser, J.E., Manico, G., Pirronello, V. & Vidali, G. 2002, ApJ., 581, 276.
- Roser et al. (2003) Roser, J.E., Swords S., & Vidali, G. 2003, ApJ. 596, L55.
- Sandford & Allamandolla (1993) Sandford S.A., & Allamandolla L.J. 1993, ApJ, 409, L65.
- Smoluchowski (1981) Smoluchowski, R. 1981, Astrophys. Space Sci. 75, 353.
- Smoluchowski (1983) Smoluchowski, R. 1983, J. Phys. Chem. 87, 4229.
- Takahashi et al. (1999) Takahashi, J, Masuda, K., and Nagaoka, M. 1999, MNRAS, 306, 22.
- Takahashi & Uehara (2001) Takahashi, J. and Uehara, H. 2001, ApJ, 561, 843.
- Vidali et al. (1998) Vidali., G., Roser, J. Liu, C., Pirronello, V., & Biham, O., 1998, Proceedings of the NASA Laboratory Space Science Workshop (Cambridge, Mass. April 1-3 1998), p. 60.
- Vidali et al. (2004) Vidali, G., Roser, J.E., Manicó, G., & Pirronello, V. 2004, J. Geophys. Res.-Planets, 109, E07S14.
- Vidali et al. (2005) Vidali, G., Roser, J., Manicó, G., Pirronello, V., Perets, H.B. and Biham, O. 2005 Proceedings of the International Symposium on Light, Dust and Chemical Evolution, Gerace, Italy (Sept. 26-30, 2004) Journal of Physics: Conference Series, in press (2005).
- Williams (1968) Williams D.A. 1968, ApJ, 151, 935.
- Williams (1998) Williams D.A. 1998, Faraday Discussions, 109, 1.
- Zecho et al. (2002) Zecho, T., Guttler, A., Sha, X., Lemoine, D., Jackson, B., Kuppers, J. 2002, Chem. Phys. Lett., 366, 188.
| Ice | Atoms/Molecules | Irradiation Time | Irradiation |
|---|---|---|---|
| Type | Type | (minutes) | Temperature (K) |
| LDI | H + D atoms | 2 | 9.5 |
| LDI | H + D atoms | 4 | 9.5 |
| LDI | H + D atoms | 8 | 9.5 |
| LDI | H + D atoms | 12 | 9.5 |
| LDI | H + D atoms | 18 | 9.5 |
| HDI | H + D atoms | 4 | 14.5 |
| HDI | H + D atoms | 6 | 14.5 |
| HDI | H + D atoms | 8 | 14.5 |
| HDI | H + D atoms | 18 | 14.5 |
| LDI | D atoms | 4 | 10 |
| LDI | HD molecules | 4 | 9 |
| HDI | HD molecules | 4 | 15 |
| LDI | D2 molecules | 4 | 10 |
| HDI | D2 molecules | 4 | 15 |
| Material | Molecule | (meV) | (meV) | (meV) | (meV) | (meV) |
| Type | ||||||
| Low Density | HD | 44.5 | 52.3 | 46.5 | 52.8 | 61.2 |
| Ice | 41.0 | 45.5 | 40.7 | 53.3 | 65.5 | |
| High Density | HD | 55 | 62 | 68.7 | ||
| Ice | 72.0 |
| Material | Molecule | (meV) | |||
|---|---|---|---|---|---|
| Type | |||||
| Low Density | HD | 0.2 | 0.47 0.075 | 0.33 0.075 | 0.0045 |
| Ice | 0.23 0.05 | 0.51 0.05 | 0.26 | 0.0057 | |
| High Density | HD | 1 | 0.006 | ||
| Ice | 1 | 0.006 |