Dating COINS: Kinematic Ages for Compact Symmetric Objects
Abstract
We present multi-epoch VLBA observations of Compact Symmetric Objects (CSOs) from the COINS sample (CSOs Observed In the Northern Sky). These observations allow us to make estimates of, or place limits on, the kinematic ages for those sources with well-identified hot spots. This study significantly increases the number of CSOs with well-determined ages or limits. The age distribution is found to be sharply peaked under 500 years, suggesting that many CSOs die young, or are episodic in nature, and very few survive to evolve into FR II sources like Cygnus A. Jet components are found to have higher velocities than hot spots which is consistent with their movement down cleared channels. We also report on the first detections of significant polarization in two CSOs, J00004054 (2.1%) and J18261831 (8.8%). In both cases the polarized emission is found in jet components on the stronger side of the center of activity.
1 Introduction
Since being introduced 10 years ago as a subset of the “compact double” class of objects (Phillips & Mutel, 1980, 1982), Compact Symmetric Objects (CSOs; Wilkinson et al., 1994) have yielded insights into the evolution of active galactic nuclei (AGN) and unified models of AGN. They have emission on both sides of the central engine, and their small sizes ( 1 kpc) are thought to be due to their youth (104 yr; Readhead et al., 1996a; Owsianik & Conway, 1998; Owsianik, Conway, & Polatidis, 1998). CSOs may evolve into Fanaroff-Riley II radio galaxies (Fanaroff & Riley, 1974; Readhead et al., 1996b; Polatidis & Conway, 2003), or they may die out long before reaching that stage. Alternatively, Carvalho (1994, 1998) have suggested that these objects are not small by virtue of youth, but rather are frustrated jets impeded by a dense interstellar medium. With this model, they derive ages from 106 to 107 yr. The random orientations of CSOs test the unified schemes of AGN that require an obscuring torus of gas and dust surrounding the central engine. The angle that the line-of-sight of the observer makes with this torus determines what features are seen (Antonucci, 1993). CSOs often exhibit very broad HI absorption lines (Taylor et al., 1999; Peck et al., 2000), and free-free absorption (Peck, Taylor, & Conway, 1999), providing evidence for the existence of this circumnuclear torus. CSOs also typically exhibit very low polarization, if any, due to the large Faraday rotation measures induced by ionized gas associated with the torus.
The ages of these objects can be measured by hot spot advance speeds. That is, the speeds of the outward moving hot spots are measured and the motions interpolated back to the center of the CSO, assuming a constant source expansion rate. These age estimates are in agreement with, but more precise than, spectral aging arguments (Readhead et al., 1996a; Murgia et al., 1999). Kinematic age estimates carried out by Taylor et al. (2000), Owsianik & Conway (1998), and Owsianik, Conway, & Polatidis (1998) are between 350 and 2000 years due to speeds of approximately 0.1 c. Jet components, however, exhibit relativistic speeds (Taylor et al., 2000) as they feed the hot spots.
In this paper, we attempt to classify the remaining CSO candidates in the COINS sample (CSOs Observed in the Northern Hemisphere; Peck & Taylor, 2000) and characterize the proper motions of hot spots and jet components of the CSOs in the sample. This allows us to increase the known CSO population and to add to the growing body of CSO age estimates using this kinematic method. Of the 21 sources listed in Table 1, 10 have been confirmed as CSOs by Peck & Taylor (2000). The remaining 11 candidates have been carefully examined, and 4 are rejected because they are core-jet sources, while 5 are confirmed as CSOs based on the evidence presented in this paper (J00004054, J06202102, J11111955, J11431834, and J22031007), and 2 sources remain candidates pending further observations. We also present the detection of polarization in two CSOs, J00004054 and J18261831, a first for the CSO class.
In addition to their scientific appeal, CSOs can also be quite useful calibrators. CSOs have been shown to be remarkably stable in flux density (Fassnacht & Taylor, 2001; Anderson & Ulvestad, 2004), making them ideal sources to use as amplitude calibrators in monitoring experiments, such as measuring the time delay between components of gravitational lens systems. CSOs to date have been observed to have very low fractional polarization (Peck & Taylor, 2000), making them useful to solve for leakage terms, or as an independent check on the quality of the polarization calibration.
Throughout this discussion, we assume H0=71 km s-1 Mpc-1, = 0.27, and = 0.73. Linear sizes and velocities for sources with known redshifts have been calculated using E.L. Wright’s cosmology calculator 111http://www.astro.ucla.edu/wright/CosmoCalc.html.
2 The Sample
The CSOs and CSO candidates presented here are from the COINS sample (Peck & Taylor, 2000) and were selected as candidates from the VLBA Calibrator Survey (VCS; Beasley et al., 2002). Identifications, sky positions, and redshifts are given for each target source in Table 1. Such large surveys are used for candidate selection because CSOs are rare (5 of compact objects; Peck & Taylor, 2000). It is also necessary to go to moderate flux density levels (100 mJy at 5 GHz) in order to form a complete sample. The jet axis in each of these objects usually lies within 60∘ of the plane of the sky, and the hot spot motions are moderately slow (0.1 c) so relativistic beaming does not play a major role. CSOs are chiefly identified by (1) their high degree of symmetry, (2) a compact, variable, flat spectrum core in the center of the object, and (3) proper motions that are consistent with a centrally located core (Peck & Taylor, 2000; Taylor et al., 2000).
3 Observations and Analysis
The observations were carried out at 8.4 GHz on 28 December 1997, 16 March 1998, 25 March 2000, and 2 December 2002, using the VLBA and one VLA antenna222The National Radio Astronomy Observatory is operated by Associated Universities, Inc., under cooperative agreement with the National Science Foundation.. Observations were also made of the 11 candidates at 15 GHz on 4 January 2001 using the VLBA. Approximately half of the sources were observed in 1997 and the other half in 1998, and so these are both referred to as the first epoch at 8.4 GHz. The results from this first epoch were presented by Peck & Taylor (2000) and are used here for the analysis of proper motions, although the data from 1997 were recalibrated to achieve better sensitivity. Unavailable antennas in each epoch at 8.4 GHz were North Liberty in 1997, Los Alamos in 1998, and St. Croix in 2002. Amplitude calibration was derived using measurements of the system temperatures and antenna gains. Fringe-fitting was performed with the AIPS task FRING on the strong calibrator 3C 279. Feed polarizations of the antennas were determined at 8.4 GHz using the AIPS task LPCAL and the unpolarized source J04274133.
Absolute electric vector position angle (EVPA) calibration was determined by using the EVPA’s of 3C 279 listed in the VLA Monitoring Program333http://www.vla.nrao.edu/astro/calib/polar/ (Taylor & Myers, 2000) and checked with the polarization calibrator 1310323. No attempt has been made to correct the electric vector polarization angles for Faraday rotation, which is often significant on the parsec scale for AGN (Zavala & Taylor, 2003).
For each source, the 15 GHz data was tapered to produce an image at comparable resolution to the full resolution 8.4 GHz image. The two images were then combined to generate a spectral index map. It is important to note that spectral index maps made from two datasets with substantially different () coverages may suffer from significant systematic errors, especially in regions of extended emission.
4 Results
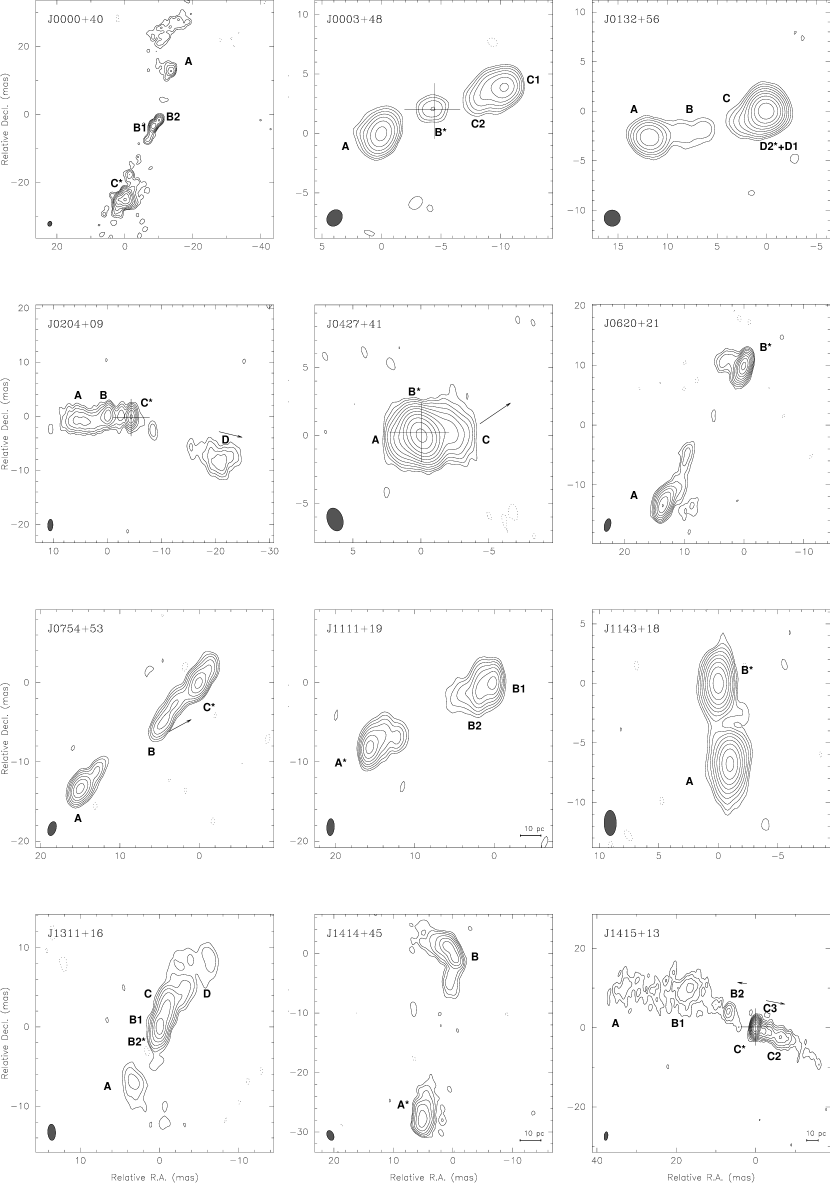
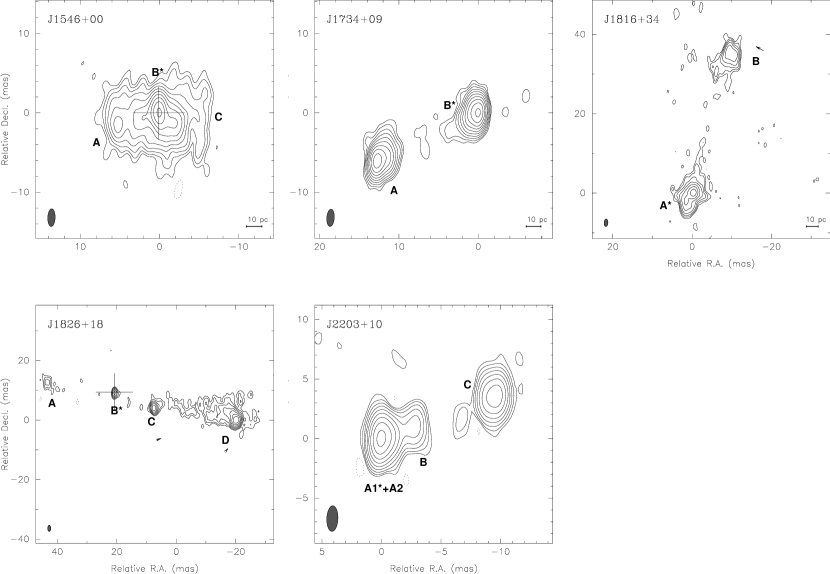
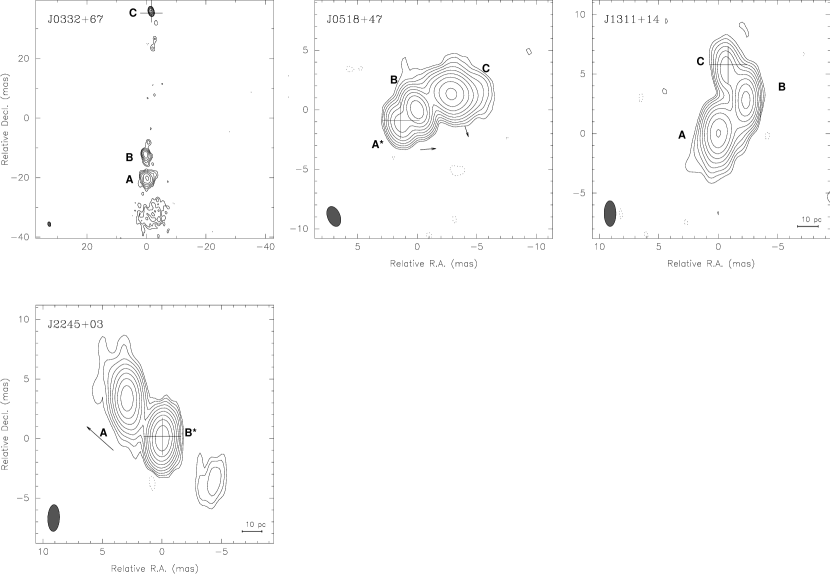
Figure 1 displays total intensity images for all 17 of the CSO and CSO candidate sources discussed in this paper. In all cases, the 2000.227 epoch is used because it is the most sensitive. See Table 2 for a summary of the properties of the CSO and candidate images, along with the current classification of each source. In the following section, we discuss results confirming 5 sources as CSOs from our initial 11 candidates identified from the COINS sample. Two sources are still regarded as CSO candidates. Ideally, a compact, flat spectrum, variable core component situated between two steep spectrum components must be identified before sources can be confirmed as CSOs. For some CSOs with a jet axis very close to the plane of the sky, the core may be so weak as to be undetectable, yet a CSO identification can still be secured if there are symmetric, edge-brightened, steep spectrum hot spots, extended lobes, or motions consistent with a central core. This was the case for all 5 of the new CSOs. On the basis of morphology and spectral index (defined ), we reject 4 candidates because they are core-jets. The maps of these sources are presented in Fig. 2 and their parameters are described in Table 3.
For each CSO and candidate source, we provide in Table 4 the flux density of each component at each of the three epochs. We also provide an estimate of the core fraction (defined as the flux density measured in the core component divided by the total flux density measured in the VLBI image (see Table 2). The spectral index between 8.4 and 15 GHz is also given, along with the linearly polarized flux observed in the most sensitive second epoch.
Relative proper motions (see Table 4) were difficult to detect in most of these sources because of the slow apparent movement of CSO components. However, where large errors are present, upper limits can be estimated for the motions, and from those we can obtain interesting lower limits on the kinematic ages. Where redshifts are available, distances can be given in parsecs and velocities in terms of c. Where identifiable, the core is used as the reference for relative motions. If there is no identifiable core, the brightest hot spot is used as the reference component. Uncertainties in the positions were derived from the signal-to-noise ratios for a given component and the synthesised beam. Motions are only given if the component motion is well fitted by a weighted least squares fit where the slope of the line is the velocity. That is, a of 2 or below is acceptable for a three epoch fit. In cases where only one component of the velocity was a good fit, either or , only that velocity component is used. This is apparent from the position angle being either 90, 0, or 90 degrees. In most cases, this occurs when the source axis lies close to the or axis.
Table 5 lists component and total fluxes for J14151320, which has two extra epochs of data from Perlman et al. (1996). Tables 6 and 7 provide summaries of the proper motions and ages of components in the CSOs and candidates. Finally, Table 8 lists the component modelfits for the core-jets sources.
4.1 CSOs and Candidates
4.1.1 J0000+4054 (CSO)
Also known as 4C 40.52, this source has a central, compact group of components and extended lobes to the north and south. It has been identified with a galaxy of magnitude 21.4 (Stickel & Kuehr, 1996). It was given a tentative CSO classification based on 1.6 GHz morphology by Dallacasa, Falomo, & Stanghellini (2002). Although no core could be determined from the spectral index map, the morphology and proper motions of the components make its new CSO classification quite clear. The hot spot separation speed (motion of component A with respect to component C) is 0.144 mas yr-1 which gives an age of 280 yr. The core may be obscured by an optically thick torus, leaving only the base of one of the jets visible (components B1 and B2). This CSO also has detectable polarization in the southern hot spot (component C) at 8.4 GHz (0.9 mJy, or 9; see Fig. 3a). This is considered the first confirmed CSO to show polarized intensity.
4.1.2 J0003+4807 (CSO)
This CSO has a double-lobe morphology with a faint central component. This component, labeled B, is thought to be the core (Peck & Taylor, 2000). The motion of hot spot A away from the core provides an upper limit for the hot spot advance speed (0.014 mas yr-1), which gives a lower limit for the age of 340 yr.
4.1.3 J0132+5620 (Candidate)
This AGN is still considered a candidate CSO because of its double-lobe structure. However, the core is not clearly identifiable either from the spectral index map or component variability (see Table 4). Component D1 appears to move with marginal significance to the west with respect to D2, but otherwise no motions are detected.
4.1.4 J0204+0903 (CSO)
With a bright central core, this CSO has a jet extending in the eastern direction and a fainter counter-jet southwest of the core. It initially seems as though components A and B are moving slowly towards the core (component C). However, it is possible that the core is ejecting components to the east and west, but the new eastern component is Doppler boosted and makes the core appear to shift in the direction of the stronger jet. The motion of component D away from the core is 0.0700.011 mas yr-1, giving an age of 24036 yr.
4.1.5 J0427+4133 (CSO)
A very bright and compact object, this CSO was used to solve for the polarization leakage terms. The prominent and variable (14%) core is easily identifiable as component B. Component C displays a surprisingly large motion with respect to B in the expected direction. With a motion of 0.0600.013 mas yr-1, the estimated age of this component is only 204 yr. If this is a hot spot, then this makes this the youngest CSO known. Alternatively, we could be measuring a fast jet component in which case the absence of detectable hot spots farther out is puzzling.
4.1.6 J0620+2102 (CSO)
This nearly equal double source has been identified here as a CSO by the steep spectral indices of its hot spots (1.0) and their lack of a significant hotspot separation velocity. This allows us to put an upper limit on the hot spot advance speed of 0.013 mas yr -1, and a lower limit on the age of 2060 yr.
4.1.7 J0754+5324 (CSO)
This CSO is dominated by two hot spots with a strong jet leading towards the northernmost lobe. With component C as the reference, we find an upper limit on the hot spot advance speeds of 0.009 mas yr-1 for component A, providing a lower limit to the age of 2220 yr. The core identified by Peck & Taylor (2000) (B) is not consistent with the motions presented here. Rather, this component appears to be a jet component speeding towards the northwestern hot spot (C) at 0.0600.026 mas yr-1. Component B most likely represents the base of the jet with an obscured core to the immediate southeast.
4.1.8 J1111+1955 (CSO)
Identified with a galaxy of magnitude 18.5 and a redshift of 0.299 (Peck et al., 2000), we can now classify this source as a CSO due to its edge-brightened lobes having steep spectra (0.9 and 0.8) and a separation speed 0.013 mas yr-1, or 0.19 c, where A is the reference. This gives an age limit of 1360 yr.
4.1.9 J1143+1834 (CSO)
This source is classified here as a CSO due to its steep spectrum double hot spots (0.8). With component B as the reference, the hot spots are moving away from each other at a speed 0.010 mas yr-1 for an age limit of 690 yr.
4.1.10 J1311+1658 (Candidate)
As a CSO candidate this object appears to have a central core (B1 or B2) with a jet extending to the northwest (C and D) and a faint counter-jet or hot spot to the southeast (A). However, the spectral indices of all the components are flat (0.2 and 0.4) and no reliable motions are detected. It is worth pointing out that this is a difficult source to modelfit because of its extended structure.
4.1.11 J1414+4554 (CSO)
This CSO has been associated with a galaxy of magnitude 19.9 and a redshift of 0.190 by Falco, Kochanek, & Muñoz (1998). It has a bent northern lobe (B) and an edge-brightened southern lobe (A). There are no detectable motions within the upper limit of 0.014 mas yr-1, or 0.14 c. This gives a lower limit to the age of 2030 yr.
4.1.12 J1415+1320 (CSO)
Also known as PKS 1413135, this CSO has also been classified as a BL Lac object due to its optical properties (Beichman et al., 1981; Bregman et al., 1981). This proved to be an unusual object from the start as it was later found to be the first BL Lac to be associated with a disk galaxy ( 19.6, 0.25) from optical images, HI absorption, and extinction in the near infrared (McHardy et al., 1991; Carilli, Perlman, & Stocke, 1992). This disk also gives rise to evidence of molecular absorption in the line-of-sight of the nucleus (Wiklind & Combes, 1994; Conway, 1999). However, Stocke et al. (1992) suggested that the BL Lac could be a background quasar that has been gravitationally lensed by the foreground spiral based on the fact that there was no thermal IR emission that would normally be expected for a spiral host. However, much of the evidence to date confirms that the radio object is a part of the optical galaxy, not lensed by it (McHardy et al., 1994; Lamer, Newsam, & McHardy, 1999; Perlman et al., 2002).
Perlman et al. (1994) imaged a core, jet, and counter-jet on VLBI scales at 1.6 and 8.4 GHz, putting the BL Lac classification in jeopardy with regard to the unified schemes of AGN. Later, Perlman et al. (1996) confirmed at 1.4, 2.3, 4.8, and 8.4 GHz that no double images existed as evidence of lensing and that the source most likely resembled the members of the CSO class. The northeastern counterjet vanishes at high frequencies.
In addition to the epochs listed above, we used calibrated data from Perlman et al. (1996) from July 1994 and 1995 for a longer timeline. However, our 2002.919 epoch could not be properly modelfit on this complex source and was not used for the motion analysis. The total flux was drastically lower in 2000.227 than in the other 4 epochs (60%). Most of this drop was in component C (see Fig. 4), confirming the classification of this as the core with its extreme variability. There was also a drop in the flux of the newest jet component, C3. The core was used as the reference component for the proper motion analysis. The counter-jet component east of the core (B2) has a motion over the 4 epochs at 0.0600.024 mas yr-1, corresponding to a velocity of 0.800.30 c. This gives an age of 13047 yr (see Fig. 5) for this component. The jet component closest to the core (C3), appears to be only 222 yr old due to a larger proper motion of 0.0870.009 mas yr, or a velocity of 1.100.11 c. This velocity, however, is only 25% of that measured by Kellerman et al. (1998) at 15 GHz.
For two-sided sources it is often possible to obtain information about the true jet velocities, including both speed and orientation (e.g., Taylor & Vermeulen 1997). For simultaneously ejected components moving in opposite directions at an angle to the line of sight at a velocity , it follows directly from the light travel time difference that the ratio of apparent projected distances from the origin ( for the approaching side, for the receding side) as well as the ratio of apparent motions (approaching: , receding: ) is given at any time by
| (1) |
Given the discrepant ages for C3 and B2, we cannot make the assumption that they were ejected at the same time. If, however, we assume that their velocities are characteristic of jet and counterjet velocities in PKS 1413135, then we obtain =1.45, or . This requires that is greater than 0.18, and that is less than 80∘. The rapid, and extreme variability for the core component suggests a small angle to the line-of-sight, which could be consistent with the Doppler boosting model if the jets are initially slow. Why the jet should fade so quickly on the jet side compared to the counter-jet side (Fig. 4) is unclear, and could indicate that explaining asymmetries in terms of a simple Doppler model is invalid for this source.
4.1.13 J1546+0026 (CSO)
This bright, compact CSO is associated with a magnitude 20 galaxy of redshift 0.55 (Heckman et al., 1994). It was classified as a complex morphology compact steep spectrum (CSS) source by Stanghellini, O’Dea, & Murphy (1999) based on their 4.8 GHz VLBI observations. There is most likely missing extended emission on VLBI scales because the total flux at 8.4 GHz for these three observations is lower than the flux measured with the VLA at the same frequency (663, 543, and 602 mJy with VLBA, this paper; 909 mJy with VLA, Browne et al., 1998). The motion of the westernmost component (C) is surprisingly towards the central core (B) and is 0.0540.008 mas yr-1, corresponding to a velocity of 1.100.17 c. If we assume that C is actually stationary or nearly stationary with respect to the core, the motion of component B may be due to a new jet component emerging at relativistic speeds and moving the position of model component B towards C. We also note that it is difficult to describe this very extended source with Gaussian components. No kinematic age estimate has been derived.
4.1.14 J1734+0926 (CSO)
Another edge-brightened, double hot spot CSO, this source is associated with a galaxy of magnitude 20.7 (Peck et al., 2000) and redshift 0.61 (Perucho & Martí, 2002). It was tentatively classified as a CSO by Stanghellini, O’Dea, & Murphy (1999) based on its 4.8 GHz morphology. The hot spot advance speed of component A from B is 0.008 mas yr-1, or 0.18 c. This gives a lower limit to the age of 1780 yr.
4.1.15 J1816+3457 (CSO)
This north-south, double-lobe source has been identified in the optical with a galaxy of magnitude 18.7 and redshift 0.245 (Peck et al., 2000). Hot spot B is moving with respect to A with a speed of 0.0360.009 mas yr-1, or 0.400.11 c in a direction almost perpendicular to the source axis. This side-to-side motion of the hot spots is not often seen in CSOs (Polatidis & Conway, 2003) although 1031567 also shows this behavior (Taylor et al., 2000). This may be due to an interaction with the ISM, as cited for the case of 4C 31.04 by Giroletti et al. (2003). No age has been determined for this source.
4.1.16 J1826+1831 (CSO)
This large, extended CSO has a bright hot spot and corresponding jet (C and D) to the west of the core (B) and a fainter hot spot to the east (A). Although A is only 16% as bright as D, this is within the 10:1 brightness ratio that is accepted as the maximum for CSO classification (Taylor & Peck, 2003). This CSO displays the most significant polarization of any CSO to date with 3.0 mJy in component C (8.8%; see Fig. 3b). This component is also moving away from the core at a speed of 0.0370.009 mas yr-1, giving it a component age of 38093 yr. Component D is moving at a speed of 0.0130.006 mas yr-1 and gives a source age estimate of 30001490 yr.
4.1.17 J2203+1007 (CSO)
This new member of the CSO class has two lobes with an extension (B) on the eastern lobe (A) pointing towards the geometric center of the source. All of these components have steep spectral indices (A and B, 0.8; C, 1.3). The overall expansion of the source is measured for component C with respect to A1 with a speed of 0.011 mas yr-1, or an age of 940 yr. Although the 22.53 magnitude optical component is classified as a QSO, it has recently been shown to be extended in the optical (Dallacasa et al., 2002).
4.2 Rejected Sources
4.2.1 J0332+6753
This large, extended source has a flat spectrum, compact core to the north (component C; 0.1) with three steep spectrum, extended components approximately 40 mas to the south (B, A, and an unmodeled component; 0.8 and 0.5, respectively). Component A has 1.7 mJy of polarized flux, which is typical for a jet component. Components A and B are moving away from C at less than 0.022 and 0.014 mas yr-1, respectively.
4.2.2 J0518+4730
We identify component A, the easternmost component, as the core due to its compact morphology and large variability. It is the reference for the motions of the steep spectrum jet components labeled B and C. These were measured to be moving at 0.0260.009 west and 0.0180.009 mas yr-1 southwest, respectively. Component C is polarized with 0.8 mJy of flux.
4.2.3 J1311+1417
This source is an interesting bent core-jet source, but is no longer a CSO candidate because its northernmost component (C) has been identified as the core with a spectral index of 0.3. Jet components A and B have steep spectral indices (1.0) and polarized flux (4.4 and 9.0 mJy, respectively). Their motions with respect to C, however, were plagued with large errors and could not be determined. This source has been associated with a QSO of magnitude 19.5 and redshift 1.952 by Peck et al. (2000).
4.2.4 J2245+0324
Component B is the core of this source with a spectral index of 0.2. Although it has a very faint counterjet (too faint to be modelfit), it does not contain enough flux as compared to the jet (A) in order to classify it as a CSO (brightness ratio 20:1). Component A is slightly steeper than the core with 0.5 and is moving away from B at a speed of 0.0440.007 mas yr-1, or 1.200.19 c. This velocity is also more consistent with a core-jet than a CSO. Like J15460026, this source is missing flux on VLBI scales compared to VLA observations at the same frequency by Browne et al. (1998). Our observations have total fluxes of 389, 368, and 368 mJy, whereas the VLA observations have a total flux of 624 mJy. This radio source is associated with a QSO of magnitude 19 and redshift 1.34 (Wolter et al., 1997).
5 Discussion
The kinematic ages for the sources measured in this sample range from 204 to 30001490 yr, a slightly larger range than that found in the literature (see 1). If the definite age estimates in this sample are combined with the ages of 10 sources cited by Polatidis & Conway (2003), 7 out of the total 13 sources are under 500 yr old, and when lower limits are included, 9 of 23 lie in this range (see Fig. 6). This is surprising since our naive expectation for a steady-state population would be a uniform distribution of ages. It may be that CSOs undergo phases of activity that only last for several hundreds of years. Low frequency observations could reveal remnants of earlier stages of activity, as in the case of the compact double 0108388 (Baum et al., 1990). There also may be a selection effect working against older CSOs. Their apparent motions may be so slow as to be undetectable within reasonable limits on the time baselines that are used. Although it has been shown that AGN grow dimmer with size on large scales, these sources are thought to increase in luminosity up to a size of 1 kpc (Snellen et al., 2000; Alexander, 2002). Therefore, a luminosity-based selection effect can probably be ruled out. There is also a theory that many CSOs “fizzle out” after a short period of activity (Polatidis & Conway, 2003, and references therein). This age distribution may be evidence of such a process. However, larger samples and better estimates are needed to determine the true age distribution.
An extreme example of this apparent youth is J04274133. By its age estimate (204 yr), it may indeed be a very young object, in which case this would seriously constrain models of jet formation. It may also be evidence for a new phase of activity. The fast moving component in that interpretation is then more likely to be a part of the jet and not a hot spot. Another possibility is that the way for the jet has been cleared and there is no material against which it could form a hot spot. The source has only been detected as a point source at 1.4 GHz with the VLA (The NRAO VLA Sky Survey; Condon et al., 1998). Low frequency VLBI observations might still be able to confirm the presence of more distant extended structure, on sub-arcsecond scales.
In the past, CSOs have been observed to be unpolarized. However, with the high dynamic range achieved in epoch 2000.227, polarized flux was detected in J00004054 (2.1%) and J18261831 (8.8%). The polarized components in each of these sources appear to be on the side with the more prominent jet. In this orientation, the polarized components might be free of obscuration by the central torus. Under this model, it is unlikely that polarization would be seen on both sides of a CSO core. It would be interesting to determine the Faraday rotation measures for the first time in CSOs. For completeness we note that two CSO candidates in the southern sky also show polarization (J02042132 and J14191928) and one CSO shows a possible detection of polarization (J07351735, 0.2%) in Peck & Taylor (2002).
For the 6 CSOs with identifiable cores, the percentage of the total flux at 8.4 GHz that is attributed to the core ranges from 4 to 86% (See Table 4). In three of these (J02040903, J14151320, and J18261831), there is is a clear difference in the length and brightness of the jet and counter-jet of each, suggesting an orientation close to the line-of-sight. Two of these sources (J04274133 and J15460026) are compact, and the final one (J00034807) has only a weakly visible core (4% the total flux). This suggests that certain conditions must exist for the core to be visible, such as jet axis orientation.
On VLA scales, variability of CSOs has been shown to be constant to within 1% over time periods of 1 week to 10 months (Fassnacht & Taylor, 2001). Although our experiment was not set up to accurately monitor the total fluxes, the variation stays under 10% for most of the sources in the sample (Fig. 7), and is likely to be instrumental in origin. Some of the outliers include the core dominated source J14151320 (see Fig. 4) and J15460026, the CSO candidates J13111658 and J01325620, and the CSOs J18163457, J18261831, and J22031007. It is expected that core-dominated CSOs would vary, and the variability of the two CSO candidates could indicate that they are likely to be either core-dominated CSOs, or core-jets. It is not understood why three CSOs in this sample vary by as much as 30% over a five year time period, though no careful studies of CSO variability have yet been carried out to explore this time-scale.
6 Conclusions
We have detected motions in the hot spots of 3 sources, yielding new kinematic age estimates. We also find motions in both the jet and counterjet of the unusual CSO J1415+1320 (PKS 1413+135). We place limits on the kinematic ages for 10 more sources. When combined with kinematic age estimates from the literature we find that 7 of 13 sources are under 500 years old. Longer time baselines are needed to detect motions of the slow moving components, primarily the hot spots, in CSOs and to accurately determine the ages of the objects for which only limits have been determined. For these CSOs, ranging in redshift from 0.19 to 0.61, the sampling interval chosen of 2 years was a bit short, with most sources appearing very nearly identical from epoch to epoch. It is worth noting that the apparent expansion velocity of the CSO PKS 1934-638 over a time baseline of 32.1 yr is similar. (Ojha et al., 2004). The completeness of the identification of redshifts for the sample ( 50%) could also be improved upon and would allow for the determination of projected velocities and linear sizes.
In the course of our study we discovered linear polarization in the jets of the CSOs J00004054 (2.1%) and J18261831 (8.8%). These are the first confirmed CSOs to be detected in polarization. In both cases the polarization is found on the side of the stronger jet. This is consistent with unified schemes since the Faraday depth on the approaching side should be less, though still significant. Sensitive, multi-frequency VLBI observations of these sources to determine their Faraday rotation measures should be carried out.
References
- Alexander (2002) Alexander, P. 2002, A&A, 335, 610
- Antonucci (1993) Antonucci, R. 1993, ARA&A, 31, 473
- Anderson & Ulvestad (2004) Anderson, J., & Ulvestad, J.S. 2004, ApJ, submitted
- Baum et al. (1990) Baum, S. A., O’Dea, C. P., de Bruyn, A. G., & Murphy, D. W. 1990, A&A, 232, 19
- Beasley et al. (2002) Beasley, A. J., Gordon, D., Peck, A. B., Petrov, L., MacMillan, D. S., Fomalont, E. B., & Ma, C. 2002, ApJS, 141, 13
- Beichman et al. (1981) Beichman, C. A., Neugebauer, G., Soifer, B. T., Wootten, H. A., Roellig, T., & Harvey, P. M. 1981, Nature, 293, 711
- Bregman et al. (1981) Bregman, J. N., Glassgold, A. E., Huggins, P. J., & Lebofsky, M. J., Rieke, G. H., Aller, M. F., Aller, H. D., & Hodge, P. E. 1981, Nature, 293, 714
- Browne et al. (1998) Browne, I. W. A., Wilkinson, P. N., Patnaik, A. R., & Wrobel, J. M. 1998, MNRAS, 293, 257
- Carilli, Perlman, & Stocke (1992) Carilli, C. L., Perlman, E. S., & Stocke, J. T. 1992, ApJ, 400, 13L
- Carvalho (1994) Carvalho, J. C. 1994, A&A, 292, 392
- Carvalho (1998) Carvalho, J. C. 1998, A&A, 329, 845
- Condon et al. (1998) Condon, J. J., Cotton, W. D., Greisen, E. W., Yin, Q. F., Perley, R. A., Taylor, G. B., & Broderick, J. J. 1998, AJ, 115, 1693
- Conway (1999) Conway, J. E. 1999, NewAR, 43, 509
- Dallacasa, Falomo, & Stanghellini (2002) Dallacasa, D., Falomo, R., & Stanghellini, C. 2002, A&A, 382, 53
- Dallacasa et al. (2002) Dallacasa, D., Tinti, S., Fanti, C., Fanti, R., Gregorini, L., Stanghellini, C., & Vigotti, M. 2002, A&A, 389, 115
- Falco, Kochanek, & Muñoz (1998) Falco, E. E., Kochanek, C. S., & Muñoz, J. A. 1998, ApJ, 494, 47
- Fanaroff & Riley (1974) Fanaroff, B. L. & Riley, J. M. 1974, MNRAS, 167, 31P
- Fassnacht & Taylor (2001) Fassnacht, C. D. & Taylor, G. B. 2001, AJ, 122, 1661
- Giroletti et al. (2003) Giroletti, M., Giovannini, G., Taylor, G. B., Conway, J. E., Lara, L., & Venturi, T. 2003, A&A, 399, 889
- Heckman et al. (1994) Heckman, T. M., O’Dea, C. P., Baum, S. A., & Laurikainen, E. 1994, ApJ, 428, 65
- Kellerman et al. (1998) Kellermann, K. I., Vermeulen, R. C., Zensus, J. A., & Cohen, M. H. 1998, AJ, 115, 1295
- Lamer, Newsam, & McHardy (1999) Lamer, G., Newsam, A. M., McHardy, I. M. 1999, MNRAS, 309, 1085L
- McHardy et al. (1991) McHardy, I., Abraham R., Crawford, C., Ulrich, M-H., Mock, P., & Vanderspeck, R. 1991, MNRAS, 249, 742
- McHardy et al. (1994) McHardy, I. M., Merrifield, M. R., Abraham, R. G., & Crawford, C. S. 1994, MNRAS, 268, 681
- Murgia et al. (1999) Murgia, M., Fanti, C., Fanti, R., Gregorini, L., Klein, U., Mack, K.-H., & Vigotti, M. 1999, A&A, 345, 769
- Ojha et al. (2004) Ojha, R., Fey, A. L., Johnston, K. J., Jauncey, D. L., Tzioumis, A. K., & Reynolds, J. E. 2004, AJ, 127, 1977
- Owsianik & Conway (1998) Owsianik, I. & Conway, J. E. 1998, A&A, 337, 690
- Owsianik, Conway, & Polatidis (1998) Owsianik, I., Conway, J. E. & Polatidis, A. G. 1998, A&A, 336, L37
- Peck, Taylor, & Conway (1999) Peck, A. B., Taylor, G. B., & Conway, J. E. 1999, ApJ, 521, 103
- Peck & Taylor (2000) Peck, A. B. & Taylor, G. B. 2000, ApJ, 534, 90
- Peck et al. (2000) Peck, A. B., Taylor, G. B., Fassnacht, C. D., Readhead, A. C. S., Vermeulen, R. C . 2000, ApJ, 534, 104
- Peck & Taylor (2002) Peck, A. B. & Taylor, G. B. 2002, ApJ, 597, 157
- Perlman et al. (1994) Perlman, E. S., Stocke, J. T., Shaffer, D. B., Carilli, C. L., & Ma, C. 1994, ApJ424, 69L
- Perlman et al. (1996) Perlman, E. S., Carilli, C. L., Stocke, J. T., & Conway, J. 1996, AJ, 111, 1839
- Perlman et al. (2002) Perlman, E. S., Stocke, J. T., Carilli, C. L., Sugiho, M., Tashiro, M., Madejski, G., Wang, Q. D., & Conway, J. 2002, AJ, 124, 2401
- Perucho & Martí (2002) Perucho, M. & Martí, J. M. 2002, ApJ, 568, 639
- Phillips & Mutel (1980) Phillips, R. B. & Mutel, R. L. 1980, ApJ, 328, 114
- Phillips & Mutel (1982) Phillips, R. B. & Mutel, R. L. 1982, A&A, 106, 21
- Polatidis & Conway (2003) Polatidis, A. G. & Conway, J. E. 2003, Publications of the Astronomical Society of Australia, 20, 69
- Readhead et al. (1996a) Readhead, A. C. S., Taylor, G. B., Xu, W., Pearson, T. J., Wilkinson, P. N., & Polatidis, A. G. 1996a, ApJ, 460, 612
- Readhead et al. (1996b) Readhead, A. C. S., Taylor, G. B., Pearson, T. J., & Wilkinson, P. N. 1996b, ApJ, 460, 634
- Snellen et al. (2000) Snellen, I. A. G., Schilizzi, R. T., Miley, G. K., de Bruyn, A. G., Bremer, M. N., & Rottgering, H. J. A. 2000, MNRAS, 319, 445
- Stanghellini, O’Dea, & Murphy (1999) Stanghellini, C., O’Dea, C. P., & Murphy, D. W. 1999, A&AS, 134, 309
- Stickel & Kuehr (1996) Stickel, M. & Kuehr, H. 1996, A&AS, 115, 11S
- Stocke et al. (1992) Stocke, J. T., Wurtz, R., Wang, Q., Elston, R., & Jannuzi, B. T. 1992, ApJ, 400, 17L
- Taylor & Vermeulen (1997) Taylor, G. B. & Vermeulen, R. C. 1997, ApJ, 485, L9
- Taylor et al. (1999) Taylor, G. B., O’Dea, C. P., Peck, A. B. & Koekemoer, A. M. 1999, ApJ, 512, L27
- Taylor et al. (2000) Taylor, G. B., Marr, J. M., Pearson, T. J. & Readhead, A.C.S. 2000 ApJ, 541, 112
- Taylor & Myers (2000) Taylor, G. B. & Myers, S. T. 2000 VLBA Scientific Memo 26, National Radio Astronomy Observatory
- Taylor & Peck (2003) Taylor, G. B. & Peck, A. B. 2003, ApJ, 597, 157
- Wiklind & Combes (1994) Wiklind, T. & Combes, F. 1994, A&A, 286, L9
- Wilkinson et al. (1994) Wilkinson, P. N., Polatidis, A. G., Readhead, A. C. S., Xu, W., & Pearson, T. J. 1994, ApJ, 432, L87
- Wolter et al. (1997) Wolter, A., Ciliegi, P., della Ceca, R., Gioia, I. M., Giommi, P., Henry, J. P., Maccacaro, T., Padovani, P., & Ruscica, C. 1997, MNRAS, 284, 225
- Zavala & Taylor (2003) Zavala, R. T. & Taylor, G. B. 2003, ApJ, 589, 126


| Source | Alternate | |||||
|---|---|---|---|---|---|---|
| Name | Name | RA | Dec | ID | ||
| (1) | (2) | (3) | (4) | (5) | (6) | (7) |
| J0000+4054 | 4C 40.52 | 00 00 53.081551 | 40 54 01.79335 | G | 21.4 | … |
| J0003+4807 | 00 03 46.0413 | 48 07 04.134(8) | … | … | … | |
| J0132+5620 | 01 32 20.447300 | 56 20 40.37012 | … | … | … | |
| J0204+0903 | 02 04 34.759128 | 09 03 49.25951 | … | … | … | |
| J0332+6753 | 03 32 59.5241 | 67 53 03.860(8) | … | … | … | |
| J0427+4133 | 04 27 46.045557 | 41 33 01.09988 | … | … | … | |
| J0518+4730 | 05 18 12.089801 | 47 30 55.52822 | … | … | … | |
| J0620+2102 | 06 20 19.528205 | 21 02 29.54736 | … | … | … | |
| J0754+5324 | 07 54 15.2177 | 53 24 56.450(8) | … | … | … | |
| J1111+1955 | 11 11 20.065804 | 19 55 36.00111 | G | 18.5 | 0.299 | |
| J1143+1834 | 11 43 26.069622 | 18 34 38.36170 | … | … | … | |
| J1311+1417 | 13 11 07.824347 | 14 17 46.64778 | QSO | 19.5 | 1.952 | |
| J1311+1658 | 13 11 23.820125 | 16 58 44.18917 | … | … | … | |
| J1414+4554 | 14 14 14.853505 | 45 54 48.65441 | G | 19.9 | 0.190 | |
| J1415+1320 | PKS 1413135 | 14 15 58.817480 | 13 20 23.71257 | QSO | 19.88 | 0.250 |
| J1546+0026 | 15 46 09.531469 | 00 26 24.61396 | G | 18.45 | 0.55 | |
| J1734+0926 | 17 34 58.376995 | 09 26 58.25998 | G | 20.7 | 0.61 | |
| J1816+3457 | 18 16 23.900825 | 34 57 45.74809 | G | 18.7 | 0.245 | |
| J1826+1831 | 18 26 17.710882 | 18 31 52.88973 | … | … | … | |
| J2203+1007 | 22 03 30.952632 | 10 07 42.58629 | … | 22.53 | … | |
| J2245+0324 | 22 45 28.284769 | 03 24 08.86418 | QSO | 19.0 | 1.34 |
| Peak Flux | rms | Lowest | |||||
|---|---|---|---|---|---|---|---|
| Source | Beam | Total Flux | (mJy | (mJy | Contour | ||
| Name | (mas) | (∘) | (mJy) | beam-1) | beam-1) | (mJy beam-1) | Status |
| J0000+4054 | 1.481.20 | 17.1 | 301.2 | 42.0 | 0.1 | 0.3 | CSO |
| J0003+4807 | 1.481.20 | 36.4 | 79.6 | 26.1 | 0.1 | 0.3 | CSO |
| J0132+5620 | 1.630.98 | 11.7 | 326.4 | 229.1 | 0.1 | 0.5 | CAND |
| J0204+0903 | 2.150.96 | 2.1 | 366.3 | 64.1 | 0.3 | 0.9 | CSO |
| J0427+4133 | 1.731.14 | 18.2 | 665.1 | 515.0 | 0.1 | 0.4 | CSO |
| J0620+2102 | 2.191.05 | 15.0 | 267.3 | 127.0 | 0.1 | 0.4 | CSO |
| J0754+5324 | 1.831.00 | 17.0 | 111.3 | 26.4 | 0.1 | 0.3 | CSO |
| J1111+1955 | 2.140.94 | 3.1 | 324.4 | 62.5 | 0.2 | 0.7 | CSO |
| J1143+1834 | 2.131.03 | 0.8 | 250.6 | 118.1 | 0.1 | 0.3 | CSO |
| J1311+1658 | 2.030.98 | 2.7 | 198.8 | 74.5 | 0.3 | 0.7 | CAND |
| J1414+4554 | 1.731.10 | 23.1 | 120.4 | 15.8 | 0.1 | 0.3 | CSO |
| J1415+1320 | 2.150.95 | 7.1 | 609.7 | 376.6 | 0.1 | 0.4 | CSO |
| J1546+0026 | 2.220.93 | 2.0 | 542.7 | 177.1 | 0.1 | 0.3 | CSO |
| J1734+0926 | 2.170.94 | 3.8 | 496.8 | 182.3 | 0.1 | 0.3 | CSO |
| J1816+3457 | 1.840.96 | 3.4 | 217.0 | 29.8 | 0.1 | 0.3 | CSO |
| J1826+1831 | 2.030.97 | 2.9 | 313.7 | 48.5 | 0.1 | 0.4 | CSO |
| J2203+1007 | 2.150.94 | 2.2 | 210.7 | 99.7 | 0.1 | 0.3 | CSO |
| Peak Flux | rms | Lowest | ||||
|---|---|---|---|---|---|---|
| Source | Beam | (mJy | (mJy | Contour | ||
| Name | (mas) | beam-1) | beam-1) | (mJy) | ||
| J0332+6753 | 1.541.00 | 14.0 | 13.1 | 0.1 | 0.3 | |
| J0518+4730 | 1.761.06 | 22.0 | 131.3 | 0.1 | 0.3 | |
| J1311+1417 | 2.161.00 | 0.4 | 101.8 | 0.1 | 0.3 | |
| J2245+0324 | 2.250.99 | 2.2 | 190.0 | 0.1 | 0.4 |
| Core | P.A. | |||||||||
|---|---|---|---|---|---|---|---|---|---|---|
| Source | Comp. | (mJy) | (mJy) | (mJy) | Fraction | (mJy) | (mas yr-1) | (deg) | ||
| (1) | (2) | (3) | (4) | (5) | (6) | (7) | (8) | (9) | (10) | (11) |
| J0000+4054 | A | 11 | 14 | 16 | … | … | 0.3 | 0.144 | n/a | … |
| B1 | 8 | 13 | 14 | … | 1.8 | … | … | … | … | |
| B2 | 28 | 26 | 27 | … | 1.1 | … | … | … | … | |
| C | 172 | 186 | 184 | … | 1.2 | 0.9 | reference | … | … | |
| J0003+4807 | A | 36 | 38 | 39 | … | n/a12 | 0.3 | 0.014 | n/a | … |
| B | 4 | 3 | 3 | 4% | … | … | reference | … | … | |
| C1 | 15 | 13 | 12 | … | … | … | … | … | … | |
| C2 | 26 | 26 | 27 | … | … | … | … | … | … | |
| J0132+5620 | A | 34 | 37 | 35 | … | 25 | 0.3 | 0.014 | n/a | … |
| B | 8 | 8 | 10 | … | … | … | … | … | … | |
| C | 12 | 11 | 9 | … | 1.0 | … | 0.054 | n/a | … | |
| D1 | 34 | 58 | 62 | … | 1.5 | … | 0.0150.007 | n/a | 90 | |
| D2 | 205 | 209 | 194 | … | 1.5 | … | reference | … | … | |
| J0204+0903 | A | 129 | 120 | 120 | … | n/a12 | 0.9 | 0.024 | n/a | … |
| B | 81 | 74 | 71 | … | … | … | 0.014 | n/a | … | |
| C | 67 | 72 | 58 | 20% | … | … | reference | … | … | |
| D | 71 | 68 | 66 | … | … | … | 0.0700.011 | n/a | 90 | |
| J0427+4133 | A | 25 | 28 | 68 | … | n/a12 | 0.3 | … | … | … |
| B | 561 | 571 | 490 | 86% | … | … | reference | … | … | |
| C | 66 | 65 | 51 | … | … | … | 0.0600.013 | n/a | 63 | |
| J0620+2102 | A | 91 | 88 | 88 | … | 1.0 | 0.3 | 0.013 | n/a | … |
| B | 167 | 156 | 150 | … | 1.0 | … | reference | … | … | |
| J0754+5324 | A | 33 | 36 | 40 | … | n/a12 | 0.3 | 0.009 | n/a | … |
| B | 11 | 11 | 13 | … | … | … | 0.0600.026 | n/a | 51 | |
| C | 38 | 39 | 42 | … | … | … | reference | … | … | |
| J1111+1955 | A | 78 | 76 | 86 | … | 0.9 | 0.6 | reference | … | … |
| B1 | 96 | 98 | 111 | … | 0.8 | … | 0.010 | 0.14 | … | |
| B2 | 77 | 77 | 80 | … | 0.8 | … | 0.013 | 0.19 | … | |
| J1143+1834 | A | 106 | 99 | 97 | … | 0.8 | 0.3 | 0.010 | n/a | … |
| B | 124 | 130 | 127 | … | 0.8 | … | reference | … | … | |
| J1311+1658 | A | 130 | 130 | 170 | … | … | 0.9 | … | … | … |
| B1 | 107 | 52 | 58 | … | 0.2 | … | … | … | … | |
| B2 | 111 | 102 | 110 | … | 0.2 | … | reference | … | … | |
| C | 7 | 9 | 9 | … | 0.4 | … | … | … | … | |
| D | 18 | 18 | 19 | … | … | … | … | … | … | |
| J1414+4554 | A | 63 | 64 | 72 | … | n/a12 | 0.3 | reference | … | … |
| B | 46 | 51 | 54 | … | … | … | 0.014 | 0.14 | … | |
| J1546+0026 | A | 196 | 213 | 236 | … | n/a12 | 0.3 | … | … | … |
| B | 347 | 217 | 231 | 40% | … | … | reference | … | … | |
| C | 118 | 110 | 128 | … | … | … | 0.0540.008 | 1.100.17 | 90 | |
| J1734+0926 | A | 114 | 119 | 142 | … | n/a12 | 0.3 | 0.008 | 0.18 | … |
| B | 191 | 183 | 204 | … | … | … | reference | … | … | |
| J1816+3457 | A | 137 | 135 | 148 | … | n/a12 | 0.3 | reference | … | … |
| B | 58 | 59 | 65 | … | … | … | 0.0360.009 | 0.400.11 | 90 | |
| J1826+1831 | A | 14 | 16 | 18 | … | n/a12 | 0.3 | … | … | … |
| B | 80 | 90 | 70 | 29% | … | … | reference | … | … | |
| C | 38 | 34 | 34 | … | … | 3.0 | 0.0370.009 | n/a | 90 | |
| D | 109 | 100 | 112 | … | … | … | 0.0130.006 | n/a | 90 | |
| J2203+1007 | A1 | 78 | 82 | 83 | … | 0.8 | 0.3 | reference | … | … |
| A2 | 44 | 63 | 64 | … | 0.8 | … | 0.0200.008 | n/a | 90 | |
| B | 10 | 12 | 15 | … | 0.8 | … | … | … | … | |
| C | 44 | 53 | 56 | … | 1.3 | … | 0.011 | n/a | … |
| P.A. | ||||||||
|---|---|---|---|---|---|---|---|---|
| Comp. | (mJy) | (mJy) | (mJy) | (mJy) | (mJy) | (mas yr | (deg) | |
| (1) | (2) | (3) | (4) | (5) | (6) | (7) | (8) | (9) |
| A | 20 | 27 | 25 | 29 | 0.3 | … | … | … |
| B1 | 32 | 40 | 40 | 45 | … | … | … | … |
| B2 | 6 | 9 | 9 | 10 | … | 0.0600.024 | 0.800.30 | 90 |
| C | 878 | 1064 | 1266 | 435 | … | reference | … | … |
| C3 | 70 | 97 | 64 | 48 | … | 0.0870.009 | 1.100.11 | 102 |
| C2 | 26 | 30 | 37 | 36 | … | … | … | … |
| Total | 1032 | 1267 | 1441 | 603 | … | … | … | … |
| Separation | Kin. Age | ||||
|---|---|---|---|---|---|
| Source | Comps. | Type | (mas yr-1) | (mas) | (yr) |
| (1) | (2) | (3) | (4) | (5) | (6) |
| J0000+4054 | C to A | h to h | 0.144 | 40.33 | 280 |
| J0003+4807 | B to A | c to h | 0.014 | 4.78 | 340 |
| J0204+0903 | C to D | c to h | 0.0700.011 | 18.27 | 24036 |
| J0427+4133 | B to C | c to h? | 0.0600.013 | 1.33 | 204 |
| J0620+2102 | B to A | h to h | 0.013 | 26.74 | 2060 |
| J0754+5324 | C to A | h to h | 0.009 | 20.01 | 2220 |
| J1143+1834 | B to A | h to h | 0.010 | 6.87 | 690 |
| J1826+1831 | B to C | c to j | 0.0370.009 | 14.18 | 38093 |
| B to D | c to h | 0.0130.006 | 41.87 | 30001490 | |
| J2203+1007 | A1 to C | h to h | 0.011 | 10.30 | 940 |
| Separation | Kin. Age | ||||
|---|---|---|---|---|---|
| Source | Comps. | Type | (c) | pc | (yr) |
| (1) | (2) | (3) | (4) | (5) | (6) |
| J1111+1955 | A to B2 | h to h | 0.14 | 71.05 | 1620 |
| A to B1 | h to h | 0.19 | 77.88 | 1360 | |
| J1414+4554 | A to B | h to h | 0.14 | 88.93 | 2030 |
| J1415+1320 | C to B2 | c to j | 0.8000.30 | 31.12 | 13047 |
| C to C3 | c to j | 1.100.11 | 7.63 | 222 | |
| J1734+0926 | B to A | h to h | 0.18 | 95.50 | 1780 |
| P.A. | |||||||||
|---|---|---|---|---|---|---|---|---|---|
| Source | Comp. | (mJy) | (mJy) | (mJy) | (mJy) | (mas yr | (deg) | ||
| (1) | (2) | (3) | (4) | (5) | (6) | (7) | (8) | (9) | (10) |
| J0332+6753 | A | 50 | 51 | 53 | 0.5 | 1.7 | 0.022 | n/a | … |
| B | 21 | 22 | 25 | 0.8 | 0.3 | 0.014 | n/a | … | |
| C | 80 | 130 | 70 | 0.1 | … | reference | … | … | |
| J0518+4730 | A | 8 | 13 | 7 | … | 0.3 | reference | … | … |
| B | 50 | 51 | 53 | 0.6 | … | 0.0260.009 | n/a | 85.3 | |
| C | 21 | 22 | 25 | 0.8 | 0.8 | 0.0180.009 | n/a | 159.4 | |
| J1311+1417 | A | 131 | 127 | 122 | 1.0 | 4.4 | … | … | … |
| B | 106 | 119 | 131 | 1.0 | 9.0 | … | … | … | |
| C | 13 | 22 | 17 | 0.3 | 0.3 | reference | … | … | |
| J2245+0324 | A | 111 | 121 | 118 | 0.5 | 3.1 | 0.0440.007 | 1.200.19 | 90.0 |
| B | 293 | 239 | 244 | 0.2 | 0.3 | reference | … | … |