Spectral energy distributions and luminosities of galaxies and AGN in the SPITZER SWIRE Legacy Survey
Abstract
We discuss optical associations, spectral energy distributions and photometric redshifts for SWIRE sources in the ELAIS-N1 area and the Lockman Validation Field. The band-merged IRAC (3.6, 4.5, 5.8 and 8.0 m) and MIPS (24, 70, 160 m) data have been associated with optical UgriZ data from the INT Wide Field Survey in ELAIS-N1, and with our own optical Ugri data in Lockman-VF. Criteria for eliminating spurious infrared sources and for carrying out star-quasar-galaxy separation are discussed, and statistics of the identification rate are given. 32 of sources in the ELAIS-N1 field are found to be optically blank (to r = 23.5) and 16 in Lockman-VF (to r = 25).
The spectral energy distributions of selected ELAIS sources in N1 detected by SWIRE, most with spectroscopic redshifts, are modelled in terms of a simple set of galaxy and quasar templates in the optical and near infrared, and with a set of dust emission templates (cirrus, M82 starburst, Arp 220 starburst, and AGN dust torus) in the mid infrared.
The optical data, together with the IRAC 3.6 and 4.5 m data, have been used to determine photometric redshifts. For galaxies with known spectroscopic redshifts there is a notable improvement in the photometric redshift when the IRAC data are used, with a reduction in the rms scatter from 10 in (1+z) to 7 . While further spectroscopic data are needed to confirm this result, the prospect of determining good photometric redshifts for much of the SWIRE survey, expected to yield over 2 million extragalactic objects, is excellent. Some modifications to the optical templates were required in the previously uninvestigated wavelength region 2-5 m.
The photometric redshifts are used to derive the 3.6 and 24 m redshift distribution and to compare this with the predictions of models. For those sources with a clear mid infrared excess, relative to the galaxy starlight model used for the optical and near infrared, the mid and far infrared data are modelled in terms of the same dust emission templates (cirrus, M82, Arp 220, AGN dust torus). The proportions found of each template type are: cirrus 31 , M82 29 , Arp 220 10 , AGN dust tori 29 . The distribution of the different infrared sed types in the versus plane, where and are the infrared and optical bolometric luminosities, is discussed.
There is an interesting population of luminous cool cirrus galaxies, with , implying a substantial dust optical depth. Galaxies with Arp220 like seds, of which there is a surprising preponderance compared with pre-existing source-count models, tend to have high ratios of infrared to optical bolometric luminosity, consistent with having very high extinction. There is also a high proportion of galaxies whose mid-ir seds are fitted by an AGN dust torus template (29). Of these only 8 of these are Type 1 AGN according to the optical-nir template fitting while 25 are fitted with galaxy templates in the optical-nir and have , so have to be Type 2 AGN. The remainder have so can be Seyferts, in which the optical AGN fails to be detected against the light of the host galaxy. The implied dust covering factor, , is much higher than that inferred for bright optically selected quasars.
1 Introduction
Infrared wavelengths hold the key to understanding the evolution of galaxies. From the spectrum of the extragalactic background radiation ( Hauser and Dwek 2001) we see that much of the light emitted by stars is absorbed by dust and reemitted at mid and far infrared wavelengths. Only by understanding infrared extragalactic populations can we hope to get a reliable census of the star formation history of galaxies and estimate the fraction of dust-obscured AGN.
IRAS 12-25-60-100 m colour-colour diagrams proved remarkably effective in identifying the main contributing components to the far infrared spectra of galaxies (Helou 1986, Rowan-Robinson and Crawford 1989). The key components were identified as infrared cirrus (emission from dust in the interstellar medium of the galaxy, illuminated by old stars and by quiescent star formation), starbursts (with the local starburst galaxy M82 as the prototype, generally associated with galaxy interactions), and AGN dust torus emission (predominantly at 3-30 m in the rest-frame). Very high optical depth starbursts like Arp 220, probably associated with violent mergers, constituted a fourth component (Condon et al 1991, Rowan-Robinson and Efstathiou 1993).
The Infrared Space Observatory broadly confirmed the reality of these infrared galaxy populations. Mid-infrared spectroscopy with ISO confirmed the distinct nature of these components and gave details of the mid-infrared PAH features (Xu et al 1998, Lutz et al 1998, Helou et al 2000, Laurent et al 2000, Dale et al 2001, Lu et al 2003). The ELAIS survey (Rowan-Robinson et al 2004) provides the largest sample of galaxies with ISO photometry at 6.7, 15, 90 and 175 m. Rowan-Robinson et al (2004) show optical and infrared spectral energy distributions of a sample of ELAIS galaxies, modelled in terms of a simple set of 4 templates, for each of which radiative transfer models exist. We have used the same four templates to fit the spectral energy distributions (seds) of SWIRE sources in this paper.
The SPITZER SWIRE Legacy Survey is expected to detect over 2 million infrared galaxies in 49 sq deg of sky (Lonsdale et al 2003, 2004). This will be especially powerful for searches for rare objects and for systematic studies of the link between star formation history and large-scale stucture. To date we have examined IRAC 3-8 m data and MIPS 24-160 m data in a 0.3 sq deg validation area in our Lockman field (Lockman-VF), and in 6.5 sq deg of the ELAIS-N1 field. Although this is only a small sample of the SWIRE survey (), we can already make a quantitative survey of the galaxy population.
In the ELAIS-N1 area we can make a direct comparison with the ELAIS ISO survey (Rowan-Robinson et al 2004). Sources in common will have been observed in a total of 10 infrared bands between 3 and 200 m, 15, 90 and 175 m, from ISO and the 7 SPITZER bands. This allows us to carry out a detailed study of the spectral energy distributions (seds) of these galaxies. These studies validate our photometric redshift estimates and allow us to make estimates of the bolometric luminosity in different dust emission components.
We present here a preliminary analysis of these seds and the characteristic luminosities of the infrared galaxies in the two samples of sky. Polletta et al (2005 in prep) give a parallel discussion of the seds, redshifts and nature of SWIRE sources, with an emphasis on colour-colour diagram diagnostics. Hatziminaoglou et al (2005) discuss SWIRE observations of SDSS quasars and Franceschini et al (2005) discuss SWIRE observations of Chandra X-ray sources in N1. Surace et al (2005 in prep) discuss the SWIRE IRAC (3-8 m) source-counts, Shupe et al (2005) discuss the SWIRE 24 m source-counts, and Oliver et al (2004) discuss the 3.6 m angular correlation function.
The SPITZER telescope and mission are described by Werner et al (2004), the IRAC instrument is described by Fazio et al (2004), and the MIPS instrument by Rieke et al (2004). Preliminary discussions of SPITZER galaxy populations have been given by Chary et al (2004) for the GOODS-SV survey, Eisenhardt et al (2004) for the IRAC Shallow Survey, Yan et al (2004) for the FLS Survey, and Lonsdale et al (2004) for the SWIRE Survey. The main thrust of these early discussions is the capability of SPITZER to detect star-forming galaxies at z 1. However these discussions were hampered by the absence of redshift information. In this paper we use photometric redshifts to give a fuller picture of the infrared galaxy populations.
A model with and a Hubble constant of 72 is used throughout.
2 Optical associations
Our starting point is the band-merged SWIRE 3.6-24m point-source catalogues (Surace et al 2004), which consist of sources detected with an SNR of at least 5 in one or more IRAC bands and their 24 m associations with an SNR of at least 3. The astrometric accuracy of the IRAC sources appears to be very good, better than 0.5 arcsec (2-). Aperture fluxes are used for 24 m and fainter IRAC sources, but Kron fluxes, which give a better estimate of the flux from extended sources, have been used for the IRAC bands if 1 mJy. Our goal is to define samples of good-quality SWIRE sources with reliable optical identifications and sufficient photometric bands for photometric redshift estimation. We search for optical associations of the SWIRE sources, using the band-merged WFS survey UgriZ data for the N1 area (Babbedge et al 2005, in preparation), complete to r 23.5, and our Ugri survey data for Lockman-VF (Siana et al 2005, in preparation), complete to r 25, using a search radius of 1.5”. Analysis of the identification rate as a function of search radius shows that an increasing fraction of associations at radii larger than this are spurious (Surace et al 2004). Where a SWIRE source picks up more than one optical association, the association with the most optical bands is selected first (to select against a number of spurious single band optical sources, and to favour brighter sources) and then the nearest if more than one have the same number of optical bands. Where two infrared sources closer than 0.5 arcsec acquire the same optical association we have kept only the nearer, since we suspect the majority of these close pairs may be processing artefacts. However there are some genuinely blended sources which will require a more sophisticated treatment. After this elimination of duplicates there are 16149 band-merged (IRAC+MIPS24) sources in the 0.3 sq deg Lockman area with optical associations in at least one optical band, and 204866 band-merged sources in the 6.5 sq deg of ELAIS-N1. Examination of band-merged sources with no optical association showed that some of these are spurious, generated for example by bright stars (see discussion by Surace et al 2004). The requirement that appears to eliminate spurious sources effectively and give a high reliability catalogue is that the source be detected at both 3.6 and 4.5 m at SNR 5 (Surace et al 2004). This yields 96155 blank fields in N1 and 2991 in Lockman-VF, so that the identified sources represent 68 and 84 of the total. Restricting to sources detected at 24 m (38601 in ELAIS-N1), 35 are optically blank (to r = 23.5). For comparison Yan et al (2004) found 38 of 24 m sources in the FLS Survey have r 23.0 and 17 have r 25.5. SWIRE blank fields will be discussed further in a subsequent paper (Lonsdale et al 2004, in preparation). Table 2 gives a summary of the statistics of the SWIRE catalogue in the ELAIS-N1 area.
Finding charts for ELAIS optical identifications and a summary of optical properties can be found in Gonzalez-Solares et al (2004) and at http://www.ast.cam.ac.uk/ eglez/eid/
3 Star-galaxy separation
Optical objects classified as extended by Sextractor are assumed to be galaxies. Those classified as ’stellar’ may be stars, quasars or distant galaxies. As an initial cut at removing the stars, we removed objects with r 23 classified as stellar in r. However some of these will be quasars, so we defined an initial ’quasar’ subset as (1) objects with an 8 m/r-band colour cooler than a 2000 K blackbody (due to presence of an AGN dust torus), or (2) objects whose UgriZ 3.6, 4.5 m seds are best fitted with an AGN rather than a galaxy template.
Figures 1 and 2 show the 3.6, r, i colour-colour diagrams for the ’stars’ and ’quasars’ defined in this way, for tile 3-2 in N1 (the SWIRE N1 data was analyzed in 0.8 sq deg tiles, and for some figures in this paper it is clearer to show results only for a single tile). Clearly the ’stars’ still include a significant number of extragalactic objects, which we can recover by keeping those above the straight line locus shown. Similarly the ’quasars’ still have a stellar contamination which can be removed by omitting objects below the line shown. To show how effective this procedure is, Figure 3 shows the g-r-i colour diagram for our final stellar catalogue in N1, with almost all objects following the stellar colour locus. We find that 13 of N1 sources and 6 of Lockman-VF sources are stars. A similar star-galaxy separation criterion has been proposed by Eisenhardt et al (2004).
A few bright stars do not satisfy the stellar rejection criterion because of saturation in the optical bands. They are easily recognized as having r 16, stellar or saturated flags, photometric redshifts close to zero and very poor , and have been reclassified


4 Spectral energy distributions
To model the seds of SWIRE sources we have used an approach similar to that of Rowan-Robinson et al (2004) for ELAIS sources. The optical data and near infrared data to 4.5 m are fitted with one of the 8 optical galaxy templates used in the photometric redshift code of Rowan-Robinson et al (2003), 6 galaxy templates (E, Sab, Sbc, Scd, Sdm, sb) and 2 AGN templates (Rowan-Robinson et al 2004). The mid and far infrared data are fitted by a mixture of the 4 infrared templates used by Rowan-Robinson (2001) in models for infrared and submillimetre source-counts: cirrus, M82 starburst, Arp 220 starburst and AGN dust torus. For each of these templates we have detailed radiative transfer models (cirrus: Eftstathiou and Rowan-Robinson 2003, M82 and Arp 220 starbursts: Eftstathiou et al 2000, AGN dust tori: Rowan-Robinson 1995, Efstathiou and Rowan-Robinson 1995). The approach here is to try to understand the overall SPITZER galaxy population. Better fits to individual galaxies could be obtained by allowing variation of the many parameters in the radiative transfer codes from which these templates are taken and this will be explored in subsequent work.
With the first tranche of SWIRE data in the ELAIS-N1 region, we are able to fill in a major wavelength gap in these seds and show for the first time high quality infrared seds from 0.36-175 m, providing a strong test of these models. In figures 4-6 we show sed fits for 30 sources with spectroscopic redshifts which are detected in most of the ISO and SWIRE bands (including MIPS 70 and 160 m). The ELAIS Final Catalogue was associated with the SWIRE 3.6-24 m catalogue using a search radius of 2.5 arcsec. The MIPS 70 and 160 m fluxes were extracted from mosaiced maps by Donovan Domingue using the Starfinder code (Diolaiti et al 2000). 70 and 160 m source-lists were associated with the SWIRE sources with 24 m detections using a search radius of 7 arcsec at 70 m and 14 arcsec at 160 m. Histograms of source separation show an increasing fraction of spurious associations at radii greater than these. Where 70 or 160 sources acquire more than one 24 m association, the flux was always assigned to the brighter 24 m source. In some cases, especially at 160 m, the flux should probably be assigned to more than one shorter wavelength source, so the 160 m flux will be overestimated. For a few sources which are extended at 70 or 160 m, these fluxes may be underestimated. 916 sources were associated in this way with 70 or 160 m detections, with about 35 of these being ELAIS sources, within the region of overlap of the two surveys. The numbers of sources in the fully bandmerged 3.6-175 m SWIRE+ELAIS catalogue with 10, 9, 8 or 7 infrared bands out of 3.6, 4.5, 5.8, 8.0, 15.0, 24.0 70, 90, 160, 175 m is 14, 44, 93, 332, respectively.
Figure 4 shows seds for 10 galaxies with spectroscopic redshifts and which are detected at UgriZ, JHK (primarily from 2MASS), 3.6, 4.5, 5.8 8.0, 15, 24, 70, 90, 160 and 175 m, and which were characterized by Rowan-Robinson et al (2004) as cirrus galaxies, ie normal spirals with mid and far infrared emission from interstellar dust illuminated by the general stellar radiation field.


Table 1 gives the parameters of the model fits: SPITZER RA and dec, ELAIS name, redshift (bracketed if photometric), (infrared sed type: 1 = cirrus, 2 = M82 starburst, 3 = Arp220 starburst, 4= AGN dust torus), bolometric infrared luminosity , the vertical offset constant C used in plotting the seds, the optical-nir sed type (1 = E, 2 = Sab, 3 = Sbc, 4 = Scd, 5 = Sdm, 6 = sb, 7 and 8 = QSOs, see Rowan-Robinson 2003), , bolometric optical luminosity . The data at wavelengths 5 m are fitted with the optical galaxy templates used by Rowan-Robinson et al (2004) in their photometric redshift estimation (see section 5). The spectroscopic redshifts are in the range 0.03-0.27. The cirrus template used at wavelengths 5 m is taken from the sequence of radiative transfer models by Efstathiou and Rowan-Robinson (2003). The SPITZER data fit remarkably well onto the models determined solely from ISO, optical data and JHK data, demonstrating the consistency of the IRAC and MIPS calibrations. It is remarkable how well a single cirrus template fits these relatively quiescent galaxies (). A few galaxies (not shown here) will require a cooler cirrus template. There is a reasonable consistency between the ISO 90 and 175 m data and the MIPS 70 and 160 m data. For example for cirrus sources in common it is found that and , so the consistency of both ISO and SPITZER calibrations is supported.
Figure 5 shows seds for 10 ELAIS-N1 galaxies which are characterized as higher-luminosity cirrus galaxies or M82 starbursts, all except one detected in at least two of the bands 15, 90 and 175 m. The M82 template is taken from the sequence of radiative transfer models by Efstathiou et al (2000). The galaxies have spectroscopic redshifts in the range 0.2-0.9 . The three ’cirrus’ galaxies are very luminous, with and have significantly larger than , implying a substantial optical depth in dust. One (241.67583+55.83316) is ultraluminous (), based on a photometric redshift of 0.479. Mid infrared spectroscopy and submillimetre photometry are needed to confirm the existence of this class of cool luminous galaxies, whose existence is predicted by the counts model of Rowan-Robinson (2001) and for which direct evidence is presented by Efstathiou and Rowan-Robinson (2003), Chapman et al (2003), Kaviani et al (2003) and Rowan-Robinson et al (2004). These are discussed further in section 7.
Figure 6 shows seds for 10 ELAIS-N1 galaxies, comprising 5 Arp 220 (higher optical depth) starbursts, and 5 AGN dust tori. Two of the latter also show evidence of a starburst component at longer wavelengths. The Arp 220 template is taken from the sequence of radiative transfer models by Efstathiou et al (2000) and the AGN dust torus template is taken from the radiative transfer model of Rowan-Robinson (1995). The objects have spectroscopic redshifts in the range 0.06-3.6 (two of the Arp 220 objects have photometric redshifts only). The fits for 160901+541808 and 161005.8+541029 are worse than for other objects plotted at m.
The striking features that emerge from this modelling are (1) that the seds can at least broadly be understood in terms of a small number of infrared templates, (2) the emergence of the class of luminous cool galaxies with , (3) the significant incidence of Arp 220 type seds in the survey, which was not predicted by source count models (eg Rowan-Robinson 2001). Radiative transfer codes have several parameters and even better fits could be found by using the full range of models of Efstathiou et al (2000), Eftstathiou and Rowan-Robinson (2003). This will be explored by Efstathiou et al (2004, in preparation).
In fitting these seds, and in the photometric redshift analysis described in the next section, it became apparent that the predictions of the optical-nir templates used by Rowan-Robinson (2003) at wavelengths 2-5 m, where they had not previously been tested, were too low. Figures 7 and 8 show a comparison of data for galaxies with spectroscopic redshifts and which are best fitted by E and Scd templates, respectively. Stellar synthesis fits to these seds (eg Babbedge et al 2004) will require a larger population of old low-mass stars.


5 Photometric redshifts in ELAIS-N1 and Lockman-VF
We have been able to carry out a photometric redshift analysis for the two SWIRE samples, the 0.3 sq deg area of Lockman-VF, in which we have moderately deep Ugri optical data (to r 25), and the 6.5 sq deg of the N1 area, in which we have the re-reduced WFS UgriZ data (to r 23.5). Full analyses of the photometric data in these fields will be reported by Siana et al (2005, in preparation) and Babbedge et al (2005, in preparation). Figure 9 shows a plot of versus r for the Lockman-VF field, which illustrates that the optical selection starts to produce serious incompleteness below S(3.6) 40 Jy for an optical survey complete to r = 23.5 (as in ELAIS-N1), and below S(3.6) 10 Jy for an optical survey complete to r = 25 (as in the Lockman-VF). Figure 10 shows versus r for a 0.8 sq degree sub-area of N1, with symbols and colours denoting the different infrared template types, discussed in section 7. Optical incompleteness becomes serious for 24 m sources below 200 Jy for a survey complete to r = 23.5.
In this paper we have analyzed the catalogues of SWIRE sources with optical associations with the code of Rowan-Robinson (2003) which uses 6 optical galaxy templates and 2 AGN templates (as described in Rowan-Robinson et al 2004). The galaxy templates were based on empirical seds by Yoshii and Takahara (1988) and Calzetti and Kinney (1992) but have been subsequently modelled with a stellar synthesis code by Babbedge et al (2004). Parallel work is being carried out with IMPz, a more detailed version of this code described by Babbedge et al 2004 (Babbedge et al 2005, in preparation), and with a modified version of the hyper-z code (Bolzonella et al 2000) developed by M.Polletta (Polletta et al 2005 in preparation). Agreement between these three approaches applied to ELAIS data was found to be good by Babbedge et al (2004).
We set a further condition on the optically associated SWIRE sources for entry to the photometric redshift code, namely that the source be detected at 3.6 m, in the r-band, and in at least two other bands. Rowan-Robinson (2003) found that four bands was the minimum for effective photometric redshift estimation. This reduced the sample of optically identified SWIRE sources (after elimination of stars) to 133645 in N1 and 12664 in Lockman-VF. For only 6 of these 4-band optically associated extragalactic SWIRE sources in N1 does the code fail to produce a redshift, with the reduced 10, and 12 in Lockman-VF. To quantify the goodness of fit, figure 14 shows the histogram of reduced for N1 galaxies, which is consistent with the templates being used providing a reasonable fit to the optical-near-infrared data.
For a sample of the brighter Lockman-VF galaxies (the WIYN survey, Owen et al 2004, in preparation), and for 25 of the galaxies in N1 which are common to the ELAIS survey (Perez-Fournon et al 2004, Serjeant et al 2004, summarized in Rowan-Robinson et al 2004), we have spectroscopic redshifts and can make a direct comparison with the derived photometric redshifts. An important innovation offered by the SPITZER data is that we can use the 3.6 and 4.5 m fluxes in the photometric redshift fits. Dust emission in cirrus and starburst galaxies generally starts to be a significant contributor to the total flux at around 5 m in the rest frame. We find that inclusion of extinction, characterized by , is essential for a sensible redshift solution for SWIRE galaxies, some of which appear to be dusty, with ranging up to 2. We also find it necessary to allow modest extinction for the QSOs. We restricted for QSOs to 0.3, since allowing a greater extinction range lets in many more aliases for normal galaxies. This may result in some heavily reddened quasars not achieving a correct fit. Figure 11 shows a comparison of spectroscopic and photometric redshifts for 120 galaxies in the SWIRE-N1 area, derived from UgriZJHK data plus SWIRE 3.6 and 4.5 m fluxes. The rms deviation of for galaxies is 6.9 , a significant improvement. For comparison typical rms values found by Rowan-Robinson (2003) and Rowan-Robinson et al (2004) from UgriZ, JHK data alone were 10 . Figure 12 shows a comparison of spectroscopic and photometric redshifts for 289 galaxies in the WIYN survey in Lockman-VF derived from Ugri photometry, plus 3.6 and 4.5 m fluxes. The rms deviation of is 8.4 , again a significant improvement over determinations from Ugri data alone (the corresponding plot when 3.6 and 4.5 m data are not used is shown in Fig 13). Use of IRAC data in photometric redshift determination has also reduced the number of outliers. Redshift estimates for AGN can be affected by optical variability since optical photometry for different bands may have been taken at different epochs (Afonso-Luis et al 2004). A fuller discussion of photometric redshifts of SWIRE galaxies will be given by Babbedge et al (2005, in preparation).
The distribution of optical-ir sed types for the 126193 galaxies in N1 for which we have photometric redshift estimates is given in Table 2. The number of ellipticals my be inflated by objects similar to Arp 220, whose optical sed looks very like an elliptical because of the heavy obscuration of the newly-forming stars.


6 Redshift distributions
Figure 15 shows the redshift distributions derived in this way for SWIRE-N1 sources with S(3.6) 40 Jy, above which flux the optical identifications (to r 23.5) are, according to Fig 9, relatively complete, with a breakdown into elliptical, spiral + starburst and quasar seds based on the photometric redshift fits. For comparison we show in the top panel the predictions of the Rowan-Robinson (2001), Xu et al (2003) and Pozzi et al (2004) models. Ellipticals cut off sharply at around z 1.0, and spirals at z 1.3
Figure 16 shows the redshift distribution for Lockman-VF sources with S(3.6) 10 Jy, for which the optical identifications (to r 25) are relatively complete. In the top panel we show predictions for the same 3 models for . Again the ellipticals cut off at z 1.4, but a tail of star-forming galaxies is seen to z 3.
The photometric estimates of redshift for AGN are more uncertain than those for galaxies, due to aliassing problems and to the effect of variability on photometry, but the code is effective at identifying Type 1 AGN from the optical and near ir data. For some quasars there is significant torus dust emission in the 3.6 and 4.5 m bands, so inclusion of these bands in photometric redshift determination can make the fit worse rather than better. We have therefore omitted the 3.6 and 4.5 m bands if S(3.6)/S(r) 4. Note that only 5 of SWIRE sources are identified by the photometric redshift code as Type 1 AGN.
Extrapolating from Figs 9 and 10, we estimate that no more than 5-10 of sources are missing from Figs 15 and 16 due to the optical incompleteness of these two surveys. However the actual proportions of sources which are either optically blank or have too few optical bands for photometric redshift determination is much higher than this, 25-35 . Further investigation is needed to confirm the reality of these sources and their nature. Potentially they could substantially shift the shape of the redshift distribution towards higher redshifts. Further discussion of blank field sources is given in section 7.


7 Bolometric infrared and optical luminosities
For sources detected at 70 or 160 m, or with an infrared excess at 4.5-24 m, relative to the template used for photometric redshift fitting, in at least two bands (one of which we require to be 8 or 24 m), we have determined the best-fitting out of cirrus, M82 starburst, Arp220 starburst or AGN dust torus infrared templates (as defined in section 3). From the experience of modeling IRAS sources (eg Rowan-Robinson and Crawford 1989), confirmed by the sed modeling described in section 3, we allow (a) a mixture of cirrus and M82 templates, (b) a mixture of AGN dust torus and M82 templates, or (c) an Arp 220 template (using a mixture of AGN dust torus plus A220 template did not improve the distribution). We classify all galaxies with a parameter which is 1 for for an sed dominated by cirrus, 2 for sed dominated by M82 starburst, 3 for Arp 220 starburst, 4 for sed dominated by an AGN dust torus, 5 if there is an infrared excess in only a single band (in this case we can not say what the appropriate infrared template is), and 6 for no infrared excess (bulge or elliptical dominated, or simply too faint for dust emission to be detected). Several figures in this paper have been colour-coded using this parameter. Table 2 gives the break down of the N1 sources with photometric redshift by their mid-ir (4.5-24 m) template type. The proportion of cirrus galaxies (31) agrees well with the figure given by Yan et al (2004) for the Spitzer First Look Survey (30). Note the high proportion of galaxies whose mid-ir seds are fitted by an AGN dust torus template (29). Only 8 of these are Type 1 AGN according to the optical-nir template fitting. 25 are fitted with galaxy templates in the optical-nir and have and so have to be Type 2 AGN. The remainder have so can be Seyferts, in which the optical AGN fails to be detected against the light of the host galaxy. The implied dust covering factor, , is much higher than that inferred for bright optically selected quasars, (Rowan-Robinson 1995).
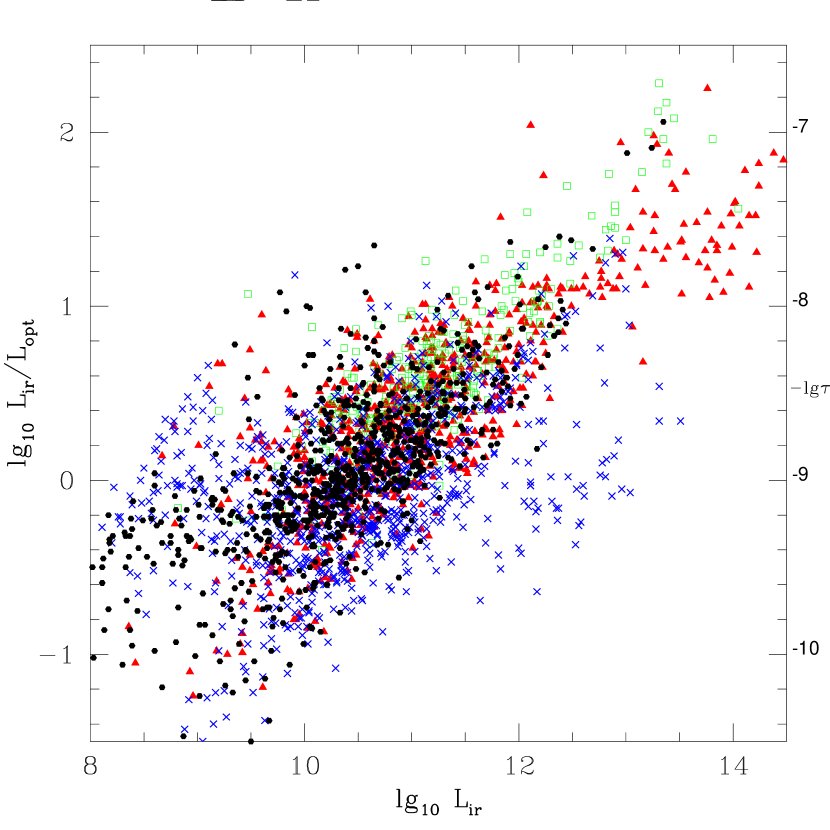
We can estimate the bolometric luminosity corresponding to the infrared template and to the optical template used for photometric redshift determination. Figure 17 shows the ratio of bolometric infrared to optical luminosity, , versus bolometric infrared luminosity, for 916 galaxies detected in N1 at either 70 or 160 m (or both), with different symbols/colours for the different infrared sed types. For star-forming galaxies the parameter can be interpreted as approximately , since and , i.e. as , where is the time-scale in yrs to accumulate the present stellar mass, forming stars at the current rate ( is the specific star formation rate). For galaxies with , a significant fraction of the infrared emission is reemission of starlight absorbed by (optically thin) interstellar dust, so should be interpreted as the optical depth of the interstellar dust. Many very low values of ( 0.2) are due to elliptical galaxies with a small amount of star-formation. Fig 18 shows the same plot for 2913 galaxies based on 4.5-24 m data from a 0.8 sq deg sub-area of N1 (tile 2-2). These figures contains a wealth of information. The cirrus galaxies at low infrared luminosities () typically have values of of -0.2, in agreement with the values found for nearby IRAS galaxies (Rowan-Robinson et al 1986). However there is the interesting population of luminous and ultraluminous cirrus galaxies, with , discussed in section 3. 7 of the cirrus galaxies identified in the N1 area have and 2 have . The implications are that (1) the quiescent phase of star formation was significantly more luminous in the past (as assumed in the count models of Rowan-Robinson 2001), (2) the dust opacity of the interstellar medium in galaxies was higher at z 1, as expected from galaxy models with star-formation histories that peak at z = 1-2 (Pei et al 1999, Calzetta and Heckaman 1999, Rowan-Robinson 2003). The galaxies with Arp 220 templates tend to have high values of , consistent with the idea that they are very dusty. M82 type starbursts are less extreme and range over rather similar values of and to the cirrus galaxies. Figure 19 shows a histogram of reduced for the infrared sed template fitting, for an assumed typical error of 0.06 dex (corresponding to ), which gives a measure of the goodness of fit of the ir templates.
For galaxies detected at 70 or 160 m we can compare the infrared template fits and bolometric luminosity estimates derived from 4.5-160 m data, and from 4.5-24 m only. For cirrus galaxies the agreement is good but for other types it is not so good and for all sources the rms value is 0.30, corresponding to a factor 2 uncertainty in estimated from 4.5-24 m only. This is unfortunate because we have 70 or 160 m data for only a small percentage of the SWIRE galaxies with photometric redshifts.
To summarise (see Table 2), for 63 of the 126193 SWIRE N1 galaxies with photometric redshifts, we have no information at all on the dust emission (no significant infrared excess relative to the starlight/QSO models), For 36 we have an approximate estimate based on 4.5-24 m data which gives the bolometric luminosity only to an accuracy of a factor of 2, and for just 0.7 of galaxies do we have a more accurate estimate based on longer wavelength data.
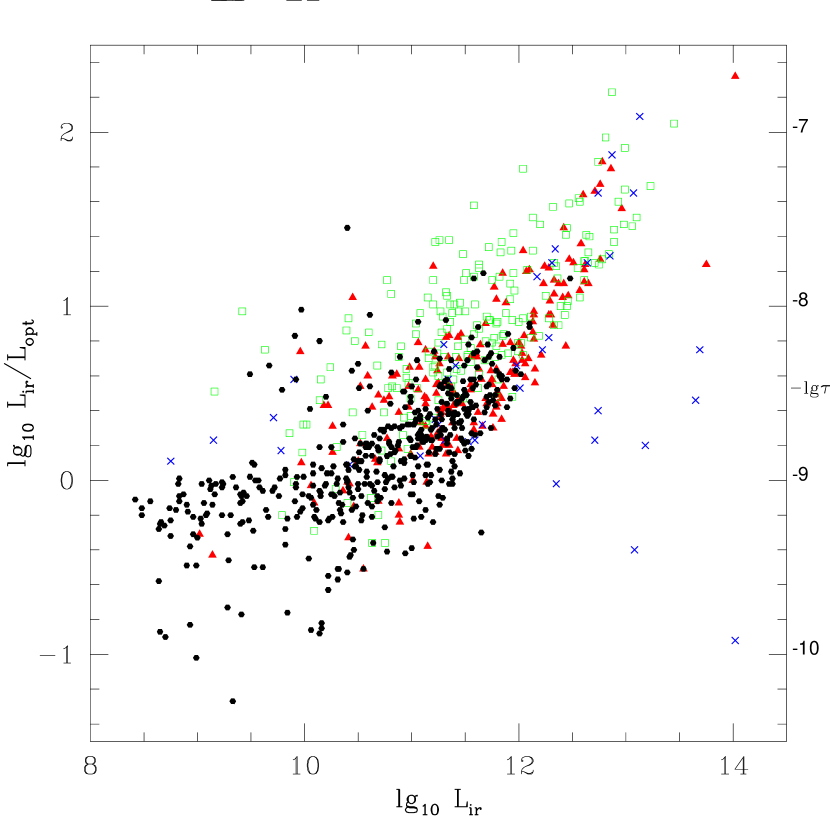

The code of Rowan-Robinson (2003) imposes an upper limit on the B band luminosity for starlight, which translates approximately to a limit on the optical bolometric luminosity (and stellar mass), which manifests itself as the sloping cutoff to the right of Fig 17. To the right of this limit can be seen the Type 1 quasars, some of which are best fitted by AGN dust tori, but others prefer M82 starbursts. While type 1 AGN would be expected to lie below the line, since only part of the optical light we see is being intercepted by the dust torus, many of the galaxies whose mid and far infrared seds are dominated by AGN dust tori have , consistent with being Type 2 AGN. Further discussion of SWIRE quasars is given by Hatziminaoglou et al (2004).
Quite a few objects are seen to have extremely high infrared luminosities, in the hyperluminous class (), most of them associated with quasars at high redshifts. Clearly spectroscopy is needed to determine these redshifts more accurately.
Since the sources plotted in Fig 18 are mostly detected at 24 m it is of interest to consider whether PAH features are affecting the detectability of 24 m sources. Figure 20 shows redshift distributions for 24 m broken down by infrared sed type. Cirrus sources, and M82 starburst show a strong cutoff at z 1.4, which may be partly due to the onset of the 10 m silicate absorption feature. For Arp 220 sources, the cutoff starts at lower redshift ( 1), consistent with their deeper and broader silicate absorption. A secondary peak for M82 starbursts (and possibly cirrus sources) at z = 0.8-1.4 can be interpreted as sources having their detectability at 24 m enhanced by the 10-12 m PAH feature. Sources with an infrared excess in a single band have a broad distribution between z = 0.2 - 1.4, and are consistent with being M82 starbursts. The optically blank 24 m sources would be likely to shift this distribution to higher redshifts, as predicted for example by the model of Rowan-Robinson (2001) shown. Chary et al (2004) give a predicted redshift distribution for the deeper (20 Jy) GOODS-SV survey, based on a fit to the 24 m counts, which has a broad peak at z = 0.8-2.
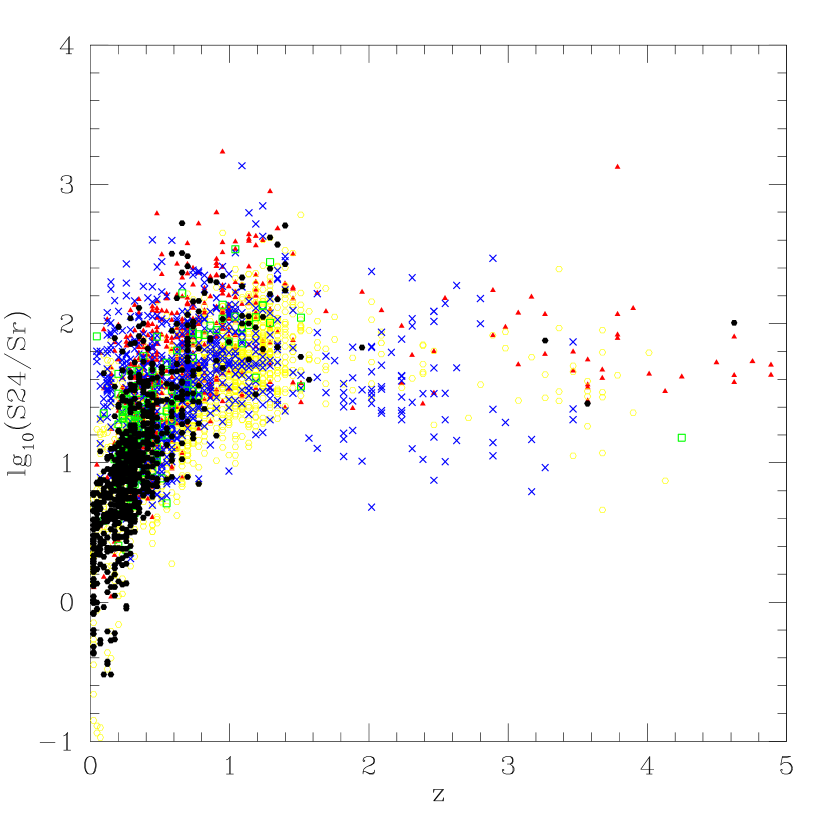
Yan et al (2004) have discussed the nature of SPITZER 24 m sources with reference a plot of S(24)/S(8) versus S(24)/S(r) and drawn attention to sources with high values of S(24)/S(r) as a potential new population. Specifically they find that 23 of the FLS sample have S(24)/S(r) 300 and suggest these are probably luminous infrared galaxies at z 1. They find that 2 of their sample have S(24)/S(r) 1000 and speculate that these may by obscured AGN at z 0.6. In Fig 21 we show S(24)/S(r) versus redshift for the Lockman-VF with different symbols/colours for different sed types. For the objects plotted here, no new sed types are required. Galaxies with an infrared excess only at 24 m (open yellow triangles) and z 1.5 are Type 1 AGN, according to their optical seds. Many of those at z 1.5 could be Type 2 AGN. Figure 10 suggests that blank field sources (r 25) are mainly AGN dust tori or M82 starbursts. A 24 m optically blank source with S24 70 Jy would have S(24)/S(r) 200, so from Fig 21 would be likely to have z 0.5. Whether the 24 m sources without optical counterparts represent a new population, or simply slightly more distant counterparts of the identified sources, remains to be seen. It is worth noting that S(24)/S(r) acts as a crude redshift indicator, in that if S(24)/S(r) 5, then z 0.5. However higher values can show a very wide range of z.

8 Conclusions
We have discussed optical associations, spectral energy distributions and photometric redshifts for SWIRE sources in the ELAIS-N1 area and the Lockman Validation Field. The band-merged IRAC (3.6, 4.5, 5.8 and 8.0 m) and MIPS (24, 70 and 160 m) data have been associated with optical UgriZ data from the INT Wide Field Survey in ELAIS-N1, and with our own optical Ugri data in Lockman-VF. Criteria for eliminating spurious infrared sources and for carrying out star-quasar-galaxy separation, and statistics of the identification rate, are given.
The spectral energy distributions of selected SWIRE sources in ELAIS-N1 with spectroscopic redshifts, are modelled in terms of a simple set of galaxy and quasar templates in the optical and near infrared, and with a set of dust emission templates (cirrus, M82 starburst, Arp 220 starburst, and AGN dust torus) in the mid and far infrared.
The optical data, together with the IRAC 3.6 and 4.5 m data, have been used to determine photometric redshifts. For galaxies with known spectroscopic redshifts there is a notable improvement in the photometric redshift when the IRAC data are used, with a reduction in the rms scatter from 10 in (1+z) to 7. While further spectroscopic data are needed to confirm this result, the prospect of determining good photometric redshifts for much of the SWIRE survey, expected to yield over 2 million extragalactic objects, is excellent. Some modifications to the optical-nir templates were required in the previously uninvestigated wavelength region 2-5 m.
The photometric redshifts are used to derive the 3.6 m redshift distribution. Agreement with model predictions are quite good. For those sources with a clear mid infrared excess, relative to the galaxy starlight model used for the optical and near infrared, the distribution of the different infrared sed types in the versus plane, where and are the infrared and optical bolometric luminosities, is discussed. Low luminosity cirrus galaxies have values of similar to those found with IRAS data, but there is a new population of luminous cold cirrus galaxies with , which implies substantial dust extinction. These appear to present an enhanced rate of quiescent star formation compared to those seen in spirals in our neighbourhood.
There is a surprisingly high incidence of galaxies with Arp220-like seds (10), which was not predicted by the counts models of Rowan-Robinson (2001). They tend to have high values of . There is also a high proportion of galaxies whose mid-ir seds are fitted by an AGN dust torus template (29). Of these only 8 of these are Type 1 AGN according to the optical-nir template fitting while 25 are fitted with galaxy templates in the optical-nir and have and so have to be Type 2 AGN. The remainder have so can be Seyferts, in which the optical AGN fails to be detected against the light of the host galaxy. The implied dust covering factor, , is much higher than that inferred for bright optically selected quasars.
For galaxies detected at 70 or 160 m we have compared the infrared template fits and bolometric luminosity estimates derived from 4.5-160 m data, and from 4.5-24 m only. The rms value is 0.30, corresponding to a factor 2 uncertainty in estimated from 4.5-24 m only. This is unfortunate because we have 70 or 160 m data for only 916 of the 126193 SWIRE galaxies with photometric redshifts in N1. Thus for 60 of the SWIRE N1 galaxies with photometric redshifts, we have no information at all on the dust emission (no significant infrared excess relative to the starlight/QSO models), For 39 we have an approximate estimate based on 4.5-24 m data which gives the bolometric luminosity only to an accuracy of a factor of 2, and for just 0.7 of galaxies do we have a more accurate estimate based on longer wavelength data. Future instruments like PACS on Herschel, or large cooled apertures like SAFIR and SPICA, will be needed to fully quantify far infrared emission from galaxies at z 1.
9 Acknowledgements
This work has been supported by the European Network ’POE’, HPRN-CT-2000-00138. We thank the referee for constructive comments which allowed the paper to be improved.
References
- (1) Afonso-Luis A., Hatziminaoglou E., Perez-Fournon I., Gonzalez-Solares E.A., Rowan-Robinson M., Vaccari M., Lari C., Serjeant S., Oliver S., Hernan-Caballero A., Montenegro-Montes F.M., 2004, MN 354, 961
- (2) Babbedge T., Rowan-Robinson M., Gonzalez-Solares E., Polletta M., Berta S., Perez-Fournon I., Oliver S., Salaman M., Irwin M., Weatherley S.J.,, 2004, MN 353, 654
- (3) Bolzonella M., Miralles J.-M., Pelló R., 2000, AA 363, 476
- (4) Calzetti D. and Kinney A.L., 1992, ApJ 399, L39
- (5) Calzetti D. and Heckman T.M., 1999, ApJ 519, 27
- (6) Chapman S.C., Smail I., Ivison R.J., Helou G., Dale D.A., Lagache G., 2002, ApJ 573, 66
- (7) Chary R., Casertano S., Dickinson M.E., Ferguson H.C., Eisenhardt P.R.M., Elbaz D., Grogin N.A., Moustakas L.A., Reach W.T., Yan H., 2004, ApJS 154, 80
- (8) Condon J.J., Huang Z.-P., Yin Q.F., Thuan T.X., 1991, ApJ 378, 65
- (9) Dale D.A., Helou G., Contursi A., Silbermann N.A., Kolhatkar S., 2001, ApJ 549, 215
- (10) Diolaiti E., Bendinelli O., Bonaccini D., Close L., Currie D., Parmeggiani G., 2000, AASS 147, 335
- (11) Efstathiou A. and Rowan-Robinson M., 1995, MN 273, 649
- (12) Efstathiou A. and Rowan-Robinson M., 2003, MN 343, 322
- (13) Efstathiou A., Rowan-Robinson M., Siebenmorgen R., 2000, MN 313, 734
- (14) Eisenhardt P.R. et al, 2004, ApJS 154, 48
- (15) Fazio G.G. et al, 2004, ApJS 154, 10
- (16) Franceschini A. et al, 2005, AJ (subm)
- (17) Hatziminaoglou E. et al, 2005, AJ (in press), astro-ph/0410620
- (18) Hauser M.G., Dwek E., 2001, ARAA 39, 249
- (19) Helou G., 1986, ApJ 311, L33
- (20) Helou G., Lu N.Y., Werner M.W., Malhotra S., Silbermann N., 2000, ApJ 532, 21L
- (21) Kaviani A., Haehnelt M.G., Kauffmann G., 2003, MN
- (22) King A. and Rowan-Robinson, 2003, MN 339, 260
- (23) Kneib J.-P., Ellis R.S., Santos M.R., Richards J., ApJ (in press), astro-ph/0402319
- (24) Lacy M. et al, 2004, ApJS 154, 166
- (25) Laurent O., Mirabel I.F., Charmandaris V., Gallais P., Madden S.C., Sauvage M., Vigroux L., Cesarsky C., 200, AA 359, 887
- (26) Le Floch E. et al, 2004, ApJS
- (27) Lonsdale C. et al, 2003, PASP 115, 897
- (28) Lonsdale C. et al, 2004, ApJS 154, 54
- (29) Lu, N., Helou G., Werener M., Dinnerstein H.L., Dale D.A., Malhotra S., Beichman C.A., Jarrett T.H., 2003, APJ 588, 199
- (30) Lutz D., Spoon H.W.W., Rigopoulou D., Moorwood A.F.M., Genzel R., 1998, ApJ 505, L103
- (31) Oliver S. et al, 2004, ApJS 154, 30
- (32) Pei Y.C., Fall M.S., Hauser M.G., 1999, ApJ 522, 604
- (33) Pozzi F., Gruppioni C., Oliver S., Matute I., La Franca F., Lari C., Zamorani G., Serjeant S., Franceschini A., Rowan-Robinson M., 2004, ApJ 609, 122
- (34) Richards G.T. et al, 2002, AJ 123, 2945
- (35) Rieke G.H. et al, 2004, ApJS 154, 25
- (36) Rowan-Robinson M., Walker D., Chester T., Soifer T., Fairclough J., 1986, MN 219, 273
- (37) Rowan-Robinson M. and Crawford J., 1989, MN 238, 523
- (38) Rowan-Robinson M., 1995, MNRAS 272, 737
- (39) Rowan-Robinson, M., Efstathiou, A., 1993, MN 263, 675
- (40) Rowan-Robinson M., 2001, ApJ 549, 745
- (41) Rowan-Robinson M., 2003, MN 345, 819
- (42) Rowan-Robinson M., et al, 2004, MN 351, 1290
- (43) Shupe D. et al, 2005, AJ (subm)
- (44) Surace J. et al, 2004, The SWIRE N1 Image Atlases and Source Lists, SSDC Data Release
- (45) Werner M.W. et al, 2004, ApJS 154, 1
- (46) Xu C., Hacking P.B., Fang F., Shupe D.L., Lonsdale C.J., Lu N.Y., Helou G., Stacey G.J., Ashby M.L.N., 1998, ApJ 508, 576
- (47) Xu C.K., Lonsdale C.J., Shupe D.L., Franceschini A., Martin C., Shiminovich D., 2003, ApJ 587, 90
- (48) Yan L. et al, 2004, ApJS 154, 60
- (49) Yoshii Y. and Takara F., 1988, ApJ 326, 1
| SWIRE RA | dec | ELAIS name | z | C | |||||
| (2000) | () | () | |||||||
| 241.14116 | 54.74209 | 160433.8+544432 | 0.0751 | 1 | 10.83 | 0 | 2 | 0 | 10.64 |
| 241.47246 | 54.37391 | 150553.3+542225 | 0.2116 | 1 | 11.23 | 2 | 2 | 0 | 11.29 |
| 241.90221 | 53.95853 | 160736.5+535731 | 0.0298 | 1 | 10.08 | 5 | 3 | 0 | 10.08 |
| 241.90823 | 54.76723 | 160737.9+544601 | 0.0913 | 1 | 10.94 | 7 | 2 | 0 | 10.75 |
| 242.01546 | 54.88388 | 160803.8+543202 | 0.0528 | 1 | 10.83 | 10 | 2 | 0 | 10.83 |
| 242.05882 | 54.47658 | 160814.2+542836 | 0.1198 | 1 | 10.87 | 12 | 3 | 0 | 10.36 |
| 242.14723 | 53.83896 | 160835.2+535022 | 0.0627 | 1 | 10.48 | 14 | 1 | 0 | 10.27 |
| 242.21648 | 54.21648 | 160937.5+541258 | 0.0862 | 1 | 10.74 | 16 | 1 | 0 | 10.42 |
| 242.76556 | 54.72275 | 161103.7+544322 | 0.0627 | 1 | 10.33 | 18 | 3 | 0 | 10.34 |
| 243.28314 | 54.86163 | 161308.1+545141 | 0.0700 | 1 | 10.38 | 20 | 3 | 0 | 10.42 |
| 241.67583 | 55.83316 | - | (0.479) | 1 | 12.38 | -3 | 4 | 0 | 11.42 |
| 242.62575 | 55.02607 | 161030.1+550135 | 0.2740 | 1 | 11.78 | 0 | 1 | 0 | 11.19 |
| 244.18948 | 54.51995 | 161645.3+543111 | 0.2221 | 1 | 11.40 | 2 | 3 | 0 | 11.80 |
| 240.84489 | 54.71045 | 160322.8+544237 | 0.2160 | 2 | 11.32 | 5 | 3 | 0 | 10.78 |
| 241.58780 | 53.72672 | 160621.0+534336 | 0.2067 | 2 | 11.26 | 7 | 2 | 0 | 11.13 |
| 241.92168 | 55.03159 | 160741.1+550152 | 0.4599 | 2 | 12.02 | 9 | 2 | 0 | 10.66 |
| 242.10521 | 54.63612 | 160825+543809 | 0.9070 | 2 | 12.45 | 11 | 4 | 0 | 11.40 |
| 242.23936 | 54.17452 | 160857.6+541027 | 0.2687 | 2 | 11.15 | 14 | 1 | 0 | 10.88 |
| 243.74185 | 54.14808 | 161457.9+540853 | 0.2150 | 2 | 11.27 | 16 | 4 | 0 | 10.93 |
| 243.96436 | 54.25998 | 161551.3+541536 | 0.2148 | 2 | 11.27 | 18 | 4 | 0 | 10.93 |
| 241.39261 | 54.69358 | 160534.3+544136 | (0.148) | 3 | 10.90 | -5 | 1 | 0 | 10.44 |
| 242.20854 | 54.73938 | 160850+544422 | (0.514) | 3 | 11.96 | -3 | 2 | 0 | 11.32 |
| 242.25496 | 54.30231 | 160901+541808 | 0.3320 | 3 | 11.50 | 0 | 4 | 1.0 | 10.80 |
| 242.52415 | 54.17478 | 161005.8+541029 | 0.0636 | 3 | 10.63 | 3 | 2 | 0 | 10.84 |
| 242.58041 | 54.36514 | 161019+542153 | 0.2074 | 3 | 11.22 | 6 | 4 | 0.7 | 10.45 |
| 241.73061 | 53.67138 | 160655.5+534016 | 0.2136 | 4 | 11.13 | 10 | 7 | 0 | 11.19 |
| 242.30492 | 53.90829 | 160913+535429 | 0.9924 | 4 | 12.14 | 11 | 7 | 0 | 12.48 |
| 243.15944 | 53.38187 | - | 2.138 | 4 | 12.98 | 12 | 7 | 0 | 13.48 |
| 241.77142 | 53.59966 | - | 3.653 | 4 | 13.80 | 13 | 7 | 0 | 13.75 |
| 240.75597 | 54.75597 | - | 0.7280 | 4 | 12.54 | 17 | 7 | 0 | 12.29 |
| area | 6.5 | 0.3 sq deg |
|---|---|---|
| total SWIRE Catalogue | 301021a | 19140a |
| optically blank | 96155b | 2991 |
| optical ID but no r, or not 4 bands | 32721 | 2331 |
| (out of 3.6, 4.5 m, UgriZ) | ||
| stars | 38500 | 1154 |
| phot z failed | 7452 | 966 |
| galaxies with phot z | 126193 | 11698 |
| of which 4.5 m | 101139 | 8931 |
| 5.8 m | 27554 | 2109 |
| 8.0 m | 27074 | 1472 |
| 24.0 m | 38601 | 878 |
| 70 m | 870 | 22 |
| 160 m | 406 | 14 |
| E | 29383 (23) | 2361 (20) |
| Sab | 19326 (15) | 1292 (11) |
| Sbc | 13483 (11) | 1636 (14) |
| Scd | 29235 (23) 3209 (28) | |
| Sdm | 9512 (7) | 949 (8) |
| sb | 19095 (15) | 1769 (15) |
| QSO | 6159 (5) | 481 (4) |
| cirrus | 8091 (31) | 177 (25) |
| M82 | 7595 (29) | 166 (24) |
| A220 | 2624 (10) | 165 (24) |
| AGN dust torus | 7598 (29) | 197 (28) |
| single band ir excess | 20793 | 749 |
| no ir excess | 79492 | 10244 |
| a all detected at 3.6 m | ||
| b includes small number of | ||
| sources in WFS chip gaps |