The Ultimate Halo Mass in a CDM Universe
Abstract
In the far future of an accelerating CDM cosmology, the cosmic web of large-scale structure consists of a set of increasingly isolated halos in dynamical equilibrium. We examine the approach of collisionless dark matter to hydrostatic equilibrium using a large N-body simulation evolved to scale factor , well beyond the vacuum–matter equality epoch, , and Gyr into the future for a concordance model universe ). The radial phase-space structure of halos — characterized at by a pair of zero-velocity surfaces that bracket a dynamically active accretion region — simplifies at when these surfaces merge to create a single zero-velocity surface, clearly defining the halo outer boundary, , and its enclosed mass, . This boundary approaches a fixed physical size encompassing a mean interior density times the critical density, similar to the turnaround value in a classical Einstein-deSitter model. We relate to other scales currently used to define halo mass (, , ) and find that is approximately half of the total asymptotic cluster mass, while follows the evolution of the inner zero velocity surface for but becomes much larger than the total bound mass for . The radial density profile of all bound halo material is well fit by a truncated Hernquist profile. An NFW profile provides a somewhat better fit interior to but is much too shallow in the range .
keywords:
cosmology: theory — large scale structure of the universe — dark matter — dark energy1 Introduction
In cosmologies in which density fluctuations are seeded by an early inflationary period (e.g., Kolb & Turner 1990), gravity acts during the era of cold dark matter domination to evolve a “cosmic web” of non-linear structure (e.g., Bond, Kofman, & Pogosyian 1996) that can be approximately described as a set of roughly spherical halos, each characterized by a mass . Within a given cosmology, the spatial density, clustering properties, and internal structure of such halos evolve with time in ways that are becoming increasingly well understood (e.g., Cooray & Sheth 2002, Kravtsov et al 2004).
Oddly, the central element of this picture, the halo mass, remains poorly defined. During the growth phase of the web, the mass distribution of a halo smoothly connects to the cosmological background of adjoining filaments, sheets, and voids. Any given halo is a mix of ‘old’ halo material that may be near hydrostatic and virial equilibrium and ‘new’ material gained from recent accretion. Although a radial gradient in the ratio of these two components is present, no clear edge that would allow a unique definition of mass separates them. In contrast, analytic collapse models based on spherical symmetry possess a well-defined outer shock or caustic surface (Bertschinger 1985; Filmore & Goldreich 1984) that emerges at a characteristic density. These models have motivated several mass definitions based on the enclosed density. White (2001) offers a recent discussion of these and other mass definitions applied to large-scale structure simulations.
In contrast to the present epoch, the far future of a CDM universe provides an opportunity to cleanly define halo mass. In the relatively near cosmological future, merger activity comes to an effective end and dark matter halos evolve toward a dynamically quiet state (Busha et al. 2003, hereafter paper I; Nagamine & Loeb 2003; see also the reviews of Adams & Laughlin 1997; Cirkovic 2003). In this paper, we show that the phase-space configuration of dark matter halos reaches a well-behaved asymptotic state characterized by a single zero-velocity surface that uniquely defines the halo edge. Essentially all material internal to this surface is bound to and equilibrated within the halo, whereas material outside this surface is expanding away with the locally perturbed Hubble flow. In §2, we describe the simulation used and the mass measures employed in our analysis. Results are given in §3, followed by brief summary and discussion section (§4). Our mass and radius measurements assume a Hubble constant with .
2 Simulations and Mass Measures
We present results based on a simulation run with L-Gadget, a specialized version of the N-body code GADGET (Springel, Yoshida, & White 2001). L-Gadget simulates only collisionless matter in a manner that optimizes cpu and memory resources. Our simulation models a patch of flat space in a CDM universe with current matter density , vacuum density , and power spectrum normalization , values consistent with current observational data (Spergel et al. 2003).
The dark matter in a periodic cube of side length is modeled by particles of mass . The simulation was started at redshift (scale factor ), evolved through the present epoch (), and continued forward to . A gravitational softening parameter fixed at (in physical units) was used throughout the computation. The simulation was run on 8 dual-cpu nodes of a Beowulf cluster at the University of Michigan. A total of 300 outputs equally spaced in log were stored from the run. As the scale factor increases, the universe evolves from being matter dominated to vacuum energy dominated. We define as the epoch at which the energy densities in the two components are equal. For the chosen model, this transition occurs at .
We identify dark matter halos using a standard percolation (or friends-of-friends, FOF) algorithm with linking length 0.15 times the inter-particle spacing. The halo center is identified as the most bound particle of the resulting group, and the halo velocity is defined as the center of mass velocity of the linked set of particles. At the end of the simulation this algorithm identified about 2900 halos with at least 500 particles. The largest halo at that time contains 83,600 particles, equivalent to . In the analysis below, we measure ensemble properties using the 400 most massive halos.
The FOF algorithm defines halo centers about which we measure several enclosed mass scales. The first mass scale is , the mass contained within a sphere of radius that encloses a mean density 200 times the critical density at the epoch of interest. In addition, a so-called virial mass (within ) is defined to enclose a mean density times the critical density, where is an epoch-dependent threshold based on a simple, spherical collapse model (e.g., Eke, Cole, & Frenk 1996). reaches a constant value of as . A third mass scale is defined by a mean enclosed density of 180 times the background mass density .
3 Results
Previous studies (paper I; Nagamine & Loeb 2003) have shown that large-scale structure quickly approaches a stable configuration in the future deSitter phase of a CDM cosmology. Mergers and accretion slow dramatically after the scale factor exceeds , signifying the end of the dynamically active stage of the cosmic web. The change in dynamical activity, from active to absent, is apparent in the reduced phase-space density of halos as shown in Figure 1. This figure plots the proper radial velocity against distance from the halo center for an ensemble average of the 400 most massive halos using and as scale variables.
Figure 1a shows the conditional probability for these 400 halos at . The solid line gives the mean radial velocity, while the grey scale regions delimit velocities containing , , , , and of the material at each radius. This ensemble average phase space density can be divided into three principal regions: i) an inner hydrostatic core () that is relatively well relaxed; ii) an intermediate accretion envelope () containing two opposing streams of material, one on its first inward journey toward the halo center and the other passing outward after pericentric passage; and iii) an outflow region () dominated by the locally perturbed Hubble flow. Nearly all of the material in regions i) and ii) is gravitationally bound to the halo (a modest fraction of material within can be scattered out of a halo, see Fig. 3 of paper I) while essentially all of region iii) is unbound. The characteristic scale that separates the outflow and accretion regions is often called the turnaround radius (Gunn & Gott 1972), a term motivated by spherical models of expanding mass shells. We call the radius that separates the two interior zones the hydrostatic radius and measure its value using a threshold condition for the binned, mean radial velocity. Starting from the interior, we identify as the minimum radius at which . The turnaround radius is identified in the same manner, identifying the maximum radius at which . At , the values of these characteristic radii are and and are marked by the vertical dashed lines in Figure 1a.
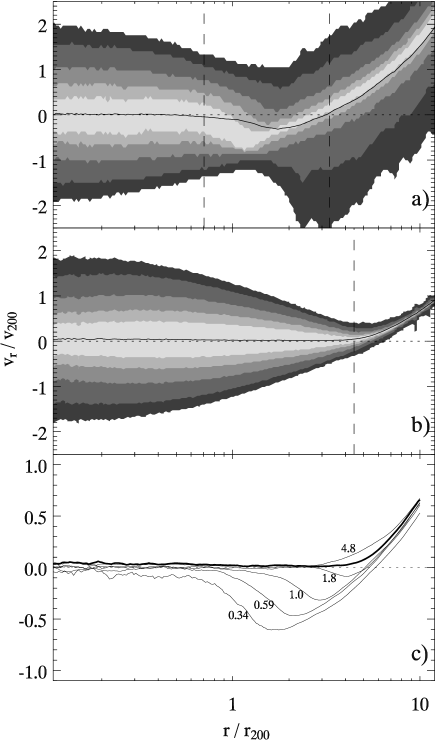
The averaging process used to create the density in Figure 1a blends the effects of substructures within individual halos, especially in the hydrostatic region. At a given radius, this region has a nearly Gaussian distribution of radial velocities with zero mean, signatures of hydrostatic and virial equilibrium. Due to the presence of pairs of massive clusters, the outflow region for the ensemble profile has a rather broad dispersion. The fact that the distribution of radial velocities for the outflow region is more sharply peaked than in the virialized region indicates that the surrounding regions generally contain halos that are less massive than those of our high-mass selected sample.
The situation in the far future is markedly different from the present. Figure 1b shows the ensemble phase-space density at . The most striking changes are the disappearance of the accretion region and the dramatic cooling of the outflow region. Here, and have merged to form a single zero-velocity surface at , represented by the dashed vertical line. In addition, relatively few nearby halos are present to disrupt the outflow stream. Neighboring halos that existed at have either merged or been pulled away in the deSitter expansion. Although not shown here, the phase-space density of the single most massive halo at is nearly identical to the ensemble averaged profile. Because mergers cease long before , the substructure present within any individual halo has several dynamical times to relax via tidal stripping, phase mixing, and dynamical friction (see paper I for a comparison with the phase-space distributions for individual halos).
The elimination of the accretion region at is accompanied by an expansion of the hydrostatic region. Figure 1c shows the evolution of the average . The bold curve shows the final profile at ; the thinner curves depict the epochs = 0.34, 0.59, 1.0, 1.8, and 4.8. The extent of the accretion region decreases with time as grows and slightly shrinks. Note also that there is an expulsion epoch at , shortly after mergers have ended. At this time, is somewhat larger than its asymptotic value in the range because the unbound particles from the final mergers are being ejected.
The time evolution of this transition is presented in Figure 2. As before, we show ensemble behavior of the 400 most massive halos selected at , with halos at earlier epochs restricted to the most massive progenitors of this final population (where most massive progenitor is defined to be the halo with the largest that contributes at least 20% of its particles to its descendant). For each halo and epoch, we identify the physical values of the characteristic radii, (, , , , ) along with the respective enclosed masses. To determine and for each halo, we first time smooth the individual profile by co-adding the halo configuration over seven consecutive outputs. We then measure using a linear extrapolation of the outflow over a factor of six in , starting at the radius and working inward. Applying a threshold (as above) instead of extrapolating produces somewhat larger values for , but causes only a small change in the values for . We choose the extrapolation method because it provides less noisy estimates during the early phase of active halo growth. The hydrostatic region, is measured using a threshold technique on the mean radial velocity measured in radial bins, identical to the method used for Figure 1. We use logarithmically spaced bins, 30 per decade, and identify as the radius at which . Typically, .
Figure 2 shows the time evolution of the mean physical radii and enclosed masses for the different measures. During the early Einstein-deSitter phase, , the sizes defined by mean interior densities , and are similar, whereas the hydrostatic boundary lies somewhat interior to and . The turnaround radius lies well beyond these scales while the growth of linear perturbations remains robust.
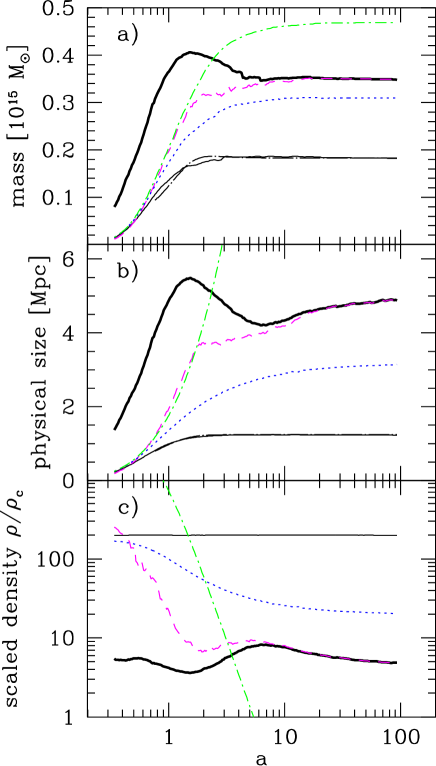
The interior scales diverge at epochs when vacuum effects dominate. As linear growth stagnates, large-scale mass density fluctuations become frozen into the background. Continuity of the density field implies that the mean size (defined relative to the mean matter density) becomes constant in the comoving frame, so the physical size grows exponentially in time. In contrast, the ensemble mean rapidly approaches its asymptotic value, following at late times, with Mpc for this high-mass sample. This fit is shown for by the dot-long-dashed line in Figure 2b.
The value of relaxes less quickly, due to the decline in the variable threshold as the scale factor increases. The enclosed masses , and grow monotonically until reaching of their asymptotic limits at , and , respectively, corresponding to ages of , and Gyr. The innermost mass scale experiences a slight decline at late epochs, , but it is not clear whether this drift is physical or numerical.
The hydrostatic boundary tracks until , then slows its growth and relaxes toward an asymptotic value. The turnaround radius also grows rapidly until , then declines until , and increases slowly thereafter. The decline in size and enclosed mass from the peak until arises from a change from infall to outflow in the accretion regime lying between and , as indicated by the outflow enhancement at this epoch in Figure 1c. At , accretion just outside the hydrostatic boundary drops dramatically. After a crossing time, the modest mass fraction of this accreted material that is scattered to unbound orbits emerges at radii with positive radial velocity at . This material escapes from the halos, but we have not investigated its ultimate fate. Presumably, some fraction emerges as the cores of stripped sub-halos that remain bound, whereas the remainder may emerge sufficiently tenuous and hot that it never collapses into a halo of cosmologically interesting mass. Future studies using higher resolution experiments are needed to address this question.
For test particles in Hubble flow around a halo of mass , the outer zero-velocity surface location can be estimated using a Newtonian binding energy, with the result (eq. [11] of paper I) . Applying this estimate using the mean asymptotic halo mass in Figure 2a yields a value of , close to the asymptotic mean size shown in Figure 2b. We caution that the values of and are sensitive at the level to the choice of threshold and/or the interpolation scheme used to locate the zero-crossing. However, the steep behavior of the density profile near the boundary () leads to a much smaller uncertainty () in enclosed mass.
The merging of the turnaround and hydrostatic scales signals the end of high mass structure formation, and therefore the end of the growth phase of the cosmic web. Thereafter, halos maintain a fixed physical size and the morphology of the cosmic web, when viewed in the comoving frame at a density threshold near critical, becomes less of a web and more an increasingly fine spray of droplets (see paper I and Nagamine & Loeb 2003). From Figure 2a, the ratio reaches of its asymptotic value at (). At epochs beyond , we can clearly define the (ultimate) halo mass as , i.e., the mass enclosed within the single zero-velocity surface is the ultimate halo mass.
Figure 2c shows that the turnaround/ultimate halo mass is defined by a density threshold relative to critical that lies at all times within a factor of two range spanning . The threshold at early times lies close to the canonical value expected from spherical collapse in an Einstein-deSitter universe (Peebles 1980). After , the ratio first drops while the mean halo mass peaks, then climbs to during the period when the mean halo mass drops. At late times, is declining weakly, and its asymptotic limit, although not well determined by this simulation, is only about shy of the canonical value.
While the gap between and expands exponentially in the far future, the enclosed mass ratio converges to . While thresholding with respect to the background mass density extends beyond the halo edge at late times, the scales defined relative to the critical density pick out mass shells interior to the halo: and . These particular values are sensitive to the asymptotic form of the radial density distribution.

Figure 3 shows the mean radial profile obtained at from the stacked ensemble of the 400 most massive halos. We use as the scale radius, but results are similar when other characteristic scales are used. The light solid line shows the mean profile while the heavy solid line shows the profile for material bound to each halo, using specific energy (with and the proper velocity and radius, respectively). The bound material is well fit over the entire halo volume by a truncated Hernquist (1990) profile
| (1) |
with characteristic radius and truncation scale . The latter measure of halo size agrees extremely well with the value of obtained from the ensemble average zero-velocity surface. This fit has a least-square error of about 12%. For comparison, an NFW profile (Navarro, Frenk, & White 1997), obtained by fitting within is shown in Figure 3 by the dotted line. The profile with fits the inner regions of the halo well, but it is much too shallow beyond , overestimating the halo density at by an order of magnitude. Note that simple scaling for the evolution of the concentration proposed by Bullock et al (2001), , breaks down as the growth rate becomes constant and the profile out to becomes fixed after a few Hubble times.
4 Summary
From a large N-body simulation that follows the long term evolution of collisionless structure in a CDM cosmology, we have examined the ultimate approach to equilibrium for a sample of 400 massive halos with final mean mass . During the matter-dominated era (), the radial phase-space structure of the halos is complex, consisting of an inner hydrostatic region, an intermediate accretion zone, and an exterior region that expands with the perturbed Hubble flow. During the interval , accretion shuts down and the intermediate region is briefly dominated by outflow rather than infall. For , the intermediate region disappears, and the hydrostatic and turnaround scales merge to form a single zero-velocity surface that provides an unambiguous definition of halo mass.
The existence of multiple mass scales commonly used in the literature to describe clusters is a direct reflection of the complexity of the accretion region during the growth phase of structure. This work illuminates the evolving relationships between the hydrostatic and turnaround scales of halos and scales defined by mean interior density thresholds. Although thresholding with respect to the background density () has advantages for calculating the halo space density (Jenkins et al. 2001), its use to describe future structure is compromised by our finding that exceeds the asymptotic halo mass for . Masses defined by thresholds relative to the critical density converge to well-defined values. For , we find .
Using only bound material, the ensemble mean density profile of the 400 most massive halos is well fit by a modified Hernquist model, with scale radius and truncation radius (eq. [1]). The origin of this particular form, as well as other issues such as its dependence on halo mass and its extension to an ellipsoidal description, remains to be investigated.
It is a pleasure to thank Volker Springel for the use of L-Gadget as well as Tony Bloch for useful conversations. This work was supported by the Michigan Center for Theoretical Physics, by NASA through grants NAG5-13378 and NNG04GK56G0, and by the National Science Foundation under Grant No. PHY99-0794 to the Kavli Institute for Theoretical Physics.
References
- [1] Adams, F. C., & Laughlin, G. 1997, Rev. Mod. Phys., 69, 337
- [2] Bertschinger, E. 1985, ApJ, 58, 39
- [3] Bond, J. R., Kofman, L., & Pogosyian, D. 1996, Nature, 380, 603
- [4] Bullock, J. S., Kolatt, T. S., Sigad, Y., Somerville, R. S., Kravtsov, A. V., Klypin, A. A., Primack, J. R., & Dekel, A. 2001, MNRAS, 321, 55
- [5] Busha, M. T., Adams, F. C., Evrard, A. E., & Wechsler, R. H. 2004, ApJ, 596, 713 (paper I)
- [6] Cirkovic, M. M. 2003, Am. J. Phys., 71, 122
- [7] Cooray, A., & Sheth, R. 2002, Phys. Rep., 372, 1
- [8] Eke, V. R., Cole, S., & Frenk, C. S., 1996, MNRAS, 282, 263
- [9] Fillmore, J., A., & Goldreich, P. 1984, ApJ, 281, 1
- [10] Gunn, J., E., & Gott, J. R. 1972, ApJ, 176, 1
- [11] Hernquist, H. 1990 ApJ, 356, 359
- [12] Jenkins, A., et al. 2001, MNRAS, 321, 372
- [13] Kolb, E. W., & Turner, M. S. 1990, The Early Universe (Redwood City: Addison Wesley)
- [14] Kravtsov, A. V., Berlind, A. A., Wechsler, R. H., Klypin, A. A., Gottlöber, S., Allgood, B., & Primack, J. R. 2004, ApJ, 609, 35
- [15] Nagamine, K., & Loeb, A. 2003, NewA, 8, 439
- [16] Navarro, J. F., Frenk, C. S., & White S.D.M. 1997, ApJ, 490, 493 (NFW)
- [17] Peebles, P.J.E. 1980, The Large-Scale Structure of the Universe (Princeton: Princeton Univ. Press)
- [18] Power, C., et al. 2003 MNRAS, 338, 14
- [19] Spergel, D. N., et al. 2003, ApJS, 148, 175
- [20] Springel, V., Yoshida, N. & White, S.D.M. 2001, NewA, 6, 79
- [21] White, M., 2001, A&A, 367, 27