Extended emission associated with young Hii regions
Abstract
We have used the Australia Telescope Compact Array (ATCA) to make observations of a sample of eight young ultra-compact Hii regions, selected on the basis that they have associated class II methanol maser emission. We have made observations sensitive to both compact and extended structures and find both to be present in most sources. The scale of the extended emission in our sample is in general less than that observed towards samples based on IRAS properties, or large single-dish flux densities. Our observations are consistent with a scenario where extended and compact radio continuum emission coexists within Hii regions for a significant period of time.
We suggest that these observations are consistent with a model where Hii evolution takes place within hierarchically structured molecular clouds. This model is the subject of a companion paper (Shabala et al., 2004) and addresses both the association between compact and extended emission and UCHii region lifetime problem.
keywords:
Hii regions – ISM : structure – stars : formation – masers – radio lines : ISM1 Introduction
Ultra-compact Hii regions (UCHii) arguably represent the earliest stage of high-mass star formation that can be reliably identified. As such they have been the focus of intensive investigation, particularly since the first large scale interferometric survey of this class of sources by Wood & Churchwell (1989b). This survey detected compact radio continuum emission towards two-thirds of the sources searched, a much higher fraction than expected. Simple modelling of Hii regions (e.g. Kahn, 1954) suggests that the ultra-compact phase should be short lived and hence seen in only a small fraction of sources. This discrepancy (known as the UCHii lifetime problem), is thought to be due to the presence of an additional confinement mechanism which partly counteracts the expected pressure driven expansion. Numerous mechanisms have been suggested to reduce the expansion rate of Hii regions, either through confinement due to infall (Reid et al., 1980), bow shocks (Van Buren et al., 1990), dense warm environments (De Pree, Rodríguez & Goss, 1995), turbulent pressure (Xie et al., 1996), or other means such as photoevapouration of circumstellar discs (Hollenbach et al., 1994) and mass-loaded stellar winds (Dyson, Williams & Redman, 1995). Champagne flows (Tenorio-Tagle, 1979) have also been invoked as a means of extending the lifetime of the ultra-compact phase of Hii regions. Although each model appears able to explain some objects, none seem to be universally valid. The UCHii lifetime issue has been most recently reviewed by Kurtz et al. (2000).
A second observational challenge related to UCHii regions has recently emerged from their apparent association with extended radio continuum emission. The majority of interferometric observations of UCHii regions have been sensitive to emission on angular scales of the order of 1-10 arcseconds. However, surveys by Kurtz et al. (1999) and Kim & Koo (2001) have shown the presence of significant emission on larger scales towards the majority of the UCHii regions observed. Morphologically the extended emission appears to be directly associated with the UCHii regions (rather than a projection effect) and this is supported by observations of radio recombination lines (Kim & Koo, 2001). The coexistence of a compact, high-emission measure region within a larger diffuse, lower-emission measure zone is not predicted by models which solve the lifetime problem through confinement. It may be broadly consistent with replenishment solutions, such as photoevapouration of circumstellar disks (Hollenbach et al., 1994), but no detailed work to predict Hii region morphology has been undertaken for this model.
A scenario which addresses both the lifetime problem and the extended emission problem is the following :
-
1.
A high-mass star commences nuclear fusion in the core and starts ionizing the surrounding neutral material, rapidly forming a UCHii region.
-
2.
Soon after, a zone of more diffuse ionized gas begins to form surrounding the UCHii region. Over time the size of the diffuse region grows and the compact region begins to dissipate.
-
3.
Eventually the compact region dissipates entirely and we are left with a classical Hii region.
There may be some Hii regions that do not follow this scenario, such as those associated with later type stars that produce relatively few ionising photons, where it is possible that no diffuse ionized region forms (Shabala et al., 2004). However, here we are interested in the large fraction of Hii regions that have been observed to exhibit both compact and more diffuse emission.
We will leave aside for the moment the question as to how this scenario occurs, this is addressed in more detail in section 4 and Shabala et al. (2004). Our scenario is consistent with current observations, as any observation made with an interferometer at high resolution during stage (ii) will detect compact emission and observations made with lower resolution will detected extended emission. All we require to solve the dual observational challenges of lifetime and extended emission is that the timescale over which compact and extended emission coexist is long enough to explain the observed excess of UCHii regions. On the basis of various arguments given by Kurtz et al. (2000) this is estimated to be approximately a factor of 5 (although uncertain by a factor of 2) and so using years as an estimate for the lifetime of the UCHii phase (Wood & Churchwell, 1989a), we estimate stage (ii) to be of the order of years.
If the scenario outlined above is correct then the flux density and radius of the diffuse extended emission will increase with time. Very young Hii regions will have little or no associated extended emission, while older regions will have a significant amount. Masers are thought to trace the early stages of high-mass star formation and so we would predict that Hii regions with associated masers should show little or no extended emission. Class II (e.g. 6.7-GHz) methanol masers are believed to exclusively trace the early stages of high-mass star formation (Minier et al., 2003). This contrasts with the other common masing molecules OH and water which are associated with more than one type of astrophysical object. Many 6.7-GHz methanol masers have no associated centimetre radio continuum emission (Phillips et al., 1998; Walsh et al., 1998), but are associated with millimetre and sub-millimetre continuum emission (Pestalozzi, Humphreys & Booth, 2002; Walsh et al., 2003). This suggests that many class II methanol masers trace a pre-UCHii phase, and for those where there is an associated UCHii region it is young. Analysis of the scale-height of 6.7-GHz methanol masers in the Galaxy shows that it is significantly smaller than any other extreme Population I objects (van der Walt et al., 1996).
To test the scenario outlined above we have selected a sample of eight UCHii regions associated with 6.7-GHz methanol masers. Assuming that this criteria selects young Hii regions then we predict they should exhibit relatively little extended emission compared with the regions observed by Kurtz et al. (1999) and Kim & Koo (2001).
2 Observations & Data processing
Eight UCHii regions associated with 6.7-GHz methanol masers were imaged with the Australia Telescope Compact Array (ATCA) in the 750D configuration. For the 750D array the minimum baseline length is 107 m and the maximum is 719 m. The observations were made on 1999 July 10&11, with all sources being observed on both days to improve the overall coverage. For each of the UCHii regions a 3-minute scan was both preceded and followed by a 1-minute scan of a phase calibrator. Over the two days sources were observed approximately 20 times, for a total onsource integration time of approximately 1 hour. The correlator was configured to record a 128-MHz bandwidth, centred at a frequency of 8.64 GHz. The data were calibrated using the miriad software package applying the standard techniques for ATCA continuum observations. The data for each day were calibrated separately and merged into a single dataset for imaging. Table 1 lists the fields imaged, the RMS level in the residual image and similar information for the related 6-km array observations (see below).
| Field | Right Ascension | Declination | RMS in | 6km Obs. | RMS in 6km | Associated |
|---|---|---|---|---|---|---|
| Name | (J2000) | (J2000) | resid. image | Reference | resid. image | IRAS source |
| (mJy beam) | (mJy beam) | |||||
| G 308.92+0.12 | 13:43:02 | -62:08:51 | 0.1 | Phillips et al. (1998) | 0.2 | 13395-6153 |
| G 309.92+0.48 | 13:50:42 | -61:35:10 | 0.2 | Phillips et al. (1998) | 0.3 | 13471-6120 |
| G 318.95-0.20 | 15:00:55 | -58:58:42 | 1.0 | this work | 0.2 | 14567-5846 |
| G 328.81+0.63 | 15:55:48 | -52:43:07 | 0.5 | this work | 0.5 | 15520-5234 |
| G 336.40-0.25 | 16:34:11 | -48:06:26 | 0.2 | Phillips et al. (1998) | 1.5 | |
| G 339.88-1.26 | 16:52:05 | -46:08:34 | 0.08 | Ellingsen et al. (1996) | 0.15 | 16484-4603 |
| G 345.01+1.79 | 16:56:48 | -40:14:26 | 0.2 | this work | 0.5 | 16533-4009 |
| NGC6334F | 17:20:53 | -35:47:01 | 2.2 | Ellingsen et al. (1996) | 59.0 | 17175-3544 |
Imaging and self-calibration of the data was undertaken in difmap. To identify all sources of emission within the primary beam a 2048x2048 arcsecond image, centred at the phase centre was created and cleaned. The difmap model was then discarded and the image re-cleaned and self-calibrated with a small loop gain and clean boxes around all emission regions. The amplitude corrections applied by self-calibration were typically small (a few percent or less), indicating good basic calibration of the data. The only exceptions were the few sources that exhibited significant extended emission that was not well sampled with the 750D array. For the majority of the sources the resulting RMS after imaging was 1 mJy beam-1 or less.
High resolution ATCA observations have been published in the literature for G 318.91-0.16, G 339.88-1.26, NGC6334F (Ellingsen, Norris & McCulloch, 1996) and G 308.92+0.12, G 309.92+0.48, G 336.41-0.26 (Phillips et al., 1998). The imaging methodology used for the 750D observations was based on that of Phillips et al. (1998) and so for consistency the sources observed by Ellingsen et al. (1996) were re-imaged using the same approach. The remaining two UCHii regions (G 328.81+0.63 and G 345.01+1.79) had not previously been imaged at high resolution and sensitivity. These sources were observed at 8.59 GHz with the ATCA in the 6A configuration on 1994 July 4 (G 328.81+0.63) and July 5 (G 345.01+1.79). These data were calibrated using the software package, applying the standard techniques for ATCA continuum observations. Imaging was undertaken in difmap, using the same approach as for the 750D observations. PKS1934-638 was used as the primary flux density calibrator for all observations, its flux density at 8.59 and 8.64 GHz was assumed to be 2.86 and 2.84 Jy respectively.
3 Results
Figures 1-8 show contour plots of radio continuum images for each of the eight fields (containing a total of 11 Hii regions). In each figure (except Fig. 7) panel a shows a 50 x 50 arcsec 8.6-GHz image made using a 6-km array, panel b shows a 5 x 5 arcmin 8.6-GHz image obtained using a 750-m array and panel c shows a 10 x 10 arcmin 843-MHz MOST image from the Molonglo Galactic Plane Survey (MGPS1) (Green et al., 1999) for sources where they are available. The location of 6.7-GHz methanol maser clusters is marked with a plus symbol. The maximum angular resolution of the 6-km array observations is approximately 1 arcsec and the largest angular scales that can reliably be imaged is approximately 15 arcsec. For the 750-m array observations the angular resolution is approximately 7 arcsec and the largest angular scale that can be detected is of the order of 50 arcsec. The MGPS1 images have an angular resolution of 43 arcsec and the RMS noise is typically 1-2 mJy beam-1. The peak and integrated flux density for the ATCA observations are listed in Table 2. These observations are at the same frequency and have comparable angular scales and sensitivities to the VLA B- and D-array observations of Kurtz et al. (1999). In contrast to the IRAS selected Hii regions of Kurtz et al. where many of the D-array images (equivalent to the 750-m array images) show significant extended emission, for our sample that is not the case. The only source which shows significant large scale structure is G 336.41-0.26 and in this source the compact region lies at the edge of the diffuse emission and so is probably not directly associated.
Our sample was selected on the basis of having a detected UCHii region with an associated 6.7-GHz methanol maser site, the only exception being G 318.95-0.20 for which Ellingsen et al. (1996) detected no radio continuum emission at the maser site, but did detect an Hii (G 318.91-0.16) region associated with IRAS 14567-5846 which is 2 arcmin away. Our 750-m array observations are consistent with the higher resolution observations of Ellingsen et al. (1996), detecting radio continuum emission only at the IRAS site and not at the maser location. Three additional regions of radio continuum were detected which are not associated with methanol maser emission. G 345.00+1.79 and G 345.01+1.82 can clearly be see in Fig. 7 and NGC6334E is present to the north-west of NGC6334F in Fig. 8b and dominates the emission in Fig. 8c.
3.1 Individual sources
G 308.92+0.12: This Hii region has a core-halo morphology and in terms of the size of the emission region seen in the 6-km array image (Fig. 1a) it is one of the largest associated with a maser in this sample. Phillips et al. (1998) found the 6.7-GHz methanol masers are located near the northern tip of the region, offset by approximately 5 arcsec from the peak of the radio continuum emission and suggest that it is likely there is more than one ionizing source present. This is supported by mid-infrared observations which detected a strong 11.5-µm point source associated with the maser location, but nothing at the Hii region peak (Phillips et al., 2004). The 750-m array image (Fig. 1b) shows that the true extent of the Hii region is significantly larger than suggested by the observations of Phillips et al. (1998) and slight extensions are present to the north-west, east and south. The 750D observations show that the flux density is increasing with decreasing baseline length, suggesting there may be more flux density present on still larger scales. The MOST image (Fig. 1c) lends some support to this showing possible extension to the north-west.
(a)

(b)

(c)

G 309.92+0.48: This Hii region (IRAS 13471-6120) is the most compact in the sample with Table 2 showing only 8 per cent more integrated flux density in the 750-m array observations than in the 6-km, the lowest ratio observed. The 6-km array image (Fig. 2a) of Phillips et al. (1998) shows slight low-level extension of the main feature with a second region with a peak flux density of 5.4 mJy beam-1 to the north-east. Observations at 10.8 and 18.2µm by De Buizer, Piña & Telesco (De Buizer et al.2000) detect strong emission associated with the Hii region and a weaker more deeply embedded source associated with the weak radio continuum emission to the north-east. Phillips et al. (1998) found the 6.7-GHz methanol masers to be located close to the peak of the Hii region. The 750-m array image (Fig. 2b) also shows small deviations from a point source with lower level contours slightly extended to the north-east, south-east and west.
(a)

(b)

(c)

G 318.91-0.16: The Hii region shown in Fig. 3 (IRAS 14567-5846) has a shell morphology at the highest resolutions. There is no compact radio continuum emission associated with the masers to a 5- level of 0.82 mJy beam-1 (Ellingsen et al., 1996) and we did not detect any diffuse emission with a 5- limit of 5 mJy beam-1. The Hii region is quite symmetrical in the 750-m array image (Fig. 3b), but shows increasing flux density with decreasing baseline length. This, combined with low-level extension to the south-west (also present in the MOST image Fig. 3c) suggests further extended emission is present on still larger scales.
(a)

(b)

(c)

G 328.81+0.63: The Hii region (IRAS 15520-5234) shown in Fig. 4a appears to be a partial superposition of two nearby sources, a point source and a cometary Hii region. Our image is consistent with that of Walsh et al. (1998), but our higher dynamic range better reveals the cometary morphology. Walsh et al. found the majority of 6.7-GHz methanol masers to be located near the peak of the cometary region, but offset slightly in the direction of the unresolved peak. There is a single maser spot offset by approximately 3 arcsec from the others, close to the peak of the unresolved continuum emission (Norris et al., 1993; Dodson, Ojha & Ellingsen, 2004). Mid-infrared observations by (De Buizer et al.2000) detect at least 6 sources in this region and morphological comparison with the radio continuum emission suggests that the masers are coincident with the peak of the infrared emission. The 6-km image shows continuous low-level extensions to the north and south, and regions of emission further north and south are suggestive of large scale extensions not satisfactorily imaged with this array configuration. The 750m array image shows slightly resolved, nearly symmetrical emission with the flux density near constant on baselines shorter than 30k.
(a)

(b)

(c)

G 336.41-0.26: There is a large amount of extended emission in the vicinity of this Hii region and this is responsible for the poor dynamic range of both the 6-km and 750-m array images. Phillips et al. (1998) report four sites of 6.7-GHz methanol maser emission in this field, but none are directly associated with the strongest compact radio continuum emission in the region. Single featured, weak masers are associated with the continuum emission in Fig. 5a immediately to the west (G 336.409-0.257) and north-west (G 336.410-0.256) of the Hii region. Fig. 5b and 5c show a ridge of extended emission running south-west to north-east with the four maser sites lying along a line with the same position angle as the southern edge of the ridge. Interestingly there is no compact emission associated with the other two maser sites (G 336.404-0.254 & G 336.433-0.262) each of which contains multiple components. (De Buizer et al.2000) didn’t detect any mid-infrared emission associated with the G 336.433-0.262 masers, but the other masers and compact radio continuum peak were not within the field of view of their observations. For this source it would appear that the extended emission is not directly associated with the UCHii region, as it lies at the edge, rather than near the centre. MSX images of the same region in the E-band (21 µm) show a similar morphology to the MOST image. We suggest that something has triggered a new epoch of star formation that we see projected along the southern edge of radio continuum emission associated with a previous episode. If this is the case then there are likely to be are a number of millimetre continuum sources along this southern ridge (corresponding to the maser locations) that will in time produce detectable Hii regions.
(a)

(b)

(c)

G 339.88-1.26: This Hii region (IRAS 16484-4603) is relatively weak and the 6-km image (Fig. 6a) shows signs of low-level extended emission, particularly to the north-east and north-west. The image in Fig. 6a is based on the same calibrated data set as that presented by Ellingsen et al. (1996), but has been cleaned and self-calibrated using difmap for consistency with the treatment applied to the other sources in the sample. Ellingsen et al. (1996) estimate G 339.88-1.26 to be produced by a B0.5 star. High resolution mid-infrared observations by De Buizer et al. (2002b) show three sources near the Hii region, elongated perpendicular to the radio continuum emission. The relative alignment of radio and mid-infrared emission is not certain, with that proposed by De Buizer et al. being predicated on the argument that the Hii region is associated an star visible at optical and near-infrared wavelengths located in front of the mid-infrared source. A counter argument to this is that there should be no compact radio continuum emission, nor 6.7-GHz methanol masers remaining if the exciting star is optically visible. The 750-m array image (Fig. 6b) shows significant extended emission and the additional low-level features surrounding the main region suggests that there is additional flux on still larger scales.
(a)

(b)

(c)

G 345.01+1.79 This Hii region (IRAS 16533-4009) is very compact with less than 10 per cent more integrated flux density in the 750-m array observations than for the 6-km. Walsh et al. (1998) found that the 6.7-GHz methanol masers are offset to the west of the centre of the Hii region. G 345.01+1.79 holds the distinction of exhibiting methanol maser emission in more transitions than any other known source (Val’tts, 1998; Val’tts et al., 1999; Cragg et al., 2001). The mid-infrared emission is also compact, being perhaps marginally resolved at 18.2µm (, De Buizer et al.2000). There are two additional radio continuum sources in the same field of view, a lower surface brightness region to the south-west of about 12 arcsec in size (G 345.00+1.79) and a compact region to the north-west (G 345.01+1.82) shown in Fig. 7b. There is no MGPS1 image for this source as it lies more than 1.5 degrees from the Galactic Plane.
(a)

(b)

(c)

NGC6334F: This cometary Hii region (IRAS 17175-3544) lies in a star formation region that has been extensively studied at radio (Rodríguez, Cantó & Moran, 1982), submillimetre (Sandell, 2000), near infrared (Straw, Hyland, McGregor, 1989), mid infrared (Kraemer et al., 1999), and x-ray (Sekimoto et al., 2000) wavelengths and in molecular lines (Kraemer & Jackson, 1999; McCutcheon et al., 2000). There are six Hii regions in the NGC6334 region of which F (Fig. 8a) is the most compact (Rodríguez et al., 1982). The profusion of sources in, and the large number of observations of the NGC6334 region has lead to a complex and confusing nomenclature which is detailed in the appendix of Kraemer & Jackson (1999). The NGC6334F Hii region is referred to as NGC6334I in infrared observations and here we have used the nomenclature appropriate to each wavelength.
NGC6334 provides nice a demonstration as to why class II methanol masers are thought to trace only the early stages of high-mass star formation. There are four sites of 6.7-GHz methanol masers in the NGC6334 region, two are close to NGC6334F (Fig. 8a), with one projected against the leading edge of the Hii region and the second offset to the north-west 6 arcseconds (Ellingsen et al., 1996). The third 6.7-GHz methanol maser G 351.54+0.66 (Fig. 8b) is associated with the high-mass class 0 candidate NGC6334I(N), although offset from the peak of the dust continuum emission (Sandell, 2000). The final 6.7-GHz methanol maser G 351.16+0.70 is associated with the NGC6334V region which also has water and ammonia maser emission. The NGC6334 region also contains three sites of OH maser emission (Brooks & Whiteoak, 2001). The strongest of these is coincident with the methanol masers in NGC6334F, while NGC6334V and the more evolved regions NGC6334A also have OH masers. The two class II methanol maser sites without associated OH maser emission both appear to be young star forming regions. NGC6334I(N) is cold, dense, optically thick at wavelengths shorter than 130 µm and has associated class I methanol masers (Cheung et al., 1978; Kuiper et al., 1995; Kogan & Slysh, 1998). NGC6334I:IRS I2 is a deeply embedded mid-infrared source approximately 6 arcsec to the northwest of NGC6334I/NGC6334F. It is much stronger at 18 than 10 µm with a dust temperature of about 110 K (De Buizer et al., 2002a). The astrometry of De Buizer et al. (2002a) find the methanol masers to be projected against mid-infrared emission, but offset by more than an arcsecond from the peak. They suggest that the methanol masers may instead be associated with a secondary peak in the (3,3) emission (Kuiper et al., 1995). In either scenario the methanol masers are associated with a very young source.
NGC6334F is the brightest Hii region in our sample and Fig. 8 shows significant extension in both the 6-km and 750-m array images. The dynamic range of images of this region are limited by the presence of nearby more extended Hii regions. NGC6334E can be seen in Fig. 8b offset to the north-west and there are signs of NGC6334B to the south-west, which is clearly seen in the MOST image (Fig. 8c). Fig. 8b shows that NGC6334E has an angular size of approximately 50 arcseconds, significantly more than the 20 arcsec estimate of Rodríguez et al. (1982) and demonstrates that as expected our 750-m array observations are able to image emission on this scale. The location and size of E are well matched to a void in the dust and molecular emission in the NGC6334 region (Sandell, 2000; McCutcheon et al., 2000), these have presumably been destroyed and driven away by UV photons and stellar winds.
(a)

(b)

(c)

4 Discussion
Comparison of Fig. 1-8 with comparable figures in Kurtz et al. (1999) qualitatively shows that degree of extended emission in our sample is in general much less. The 6-km and 750-m ATCA observations were made at the same frequency and have comparable sensitivity in both scale size and intensity to the B- and D-array VLA observations of Kurtz et al. (1999) and so the differences cannot be attributed to observational effects. Good quantitative measures of the degree of extended emission are difficult, due to the often complex morphology of the extended emission. One simple means is to compare the peak and integrated intensity and the relative intensity between observations made in different array configurations. For a point source the peak flux measured in mJy beam-1 will be equal to the integrated flux density measured in mJy. So the amount by which the integrated flux density exceeds the peak flux is a measure of the percentage of emission present on scales larger than the synthesised beam of the observations. Similarly, a comparison of the integrated intensity of the 6-km and 750-m array observations gives a direct measure of the percentage of emission resolved out by the higher resolution observations. These quantities are summarised in Table 2. The integrated flux reported in the table is from a boxed region that encompasses the emission to the level of the lowest contour shown in the figures.
| Source | 6km Array Observations | 750m Array Observations | Ratio of | |||
|---|---|---|---|---|---|---|
| Peak Flux | Integrated | Peak Flux | Integrated | 750m Int. to | 750m Int. to | |
| Density | Flux | Density | Flux | 750m Peak | 6km Int. | |
| (mJy beam-1) | (mJy) | (mJy beam-1) | (mJy) | |||
| G 308.92+0.12 | 25.0 | 363 | 263 | 488 | 1.86 | 1.34 |
| G 309.92+0.48 | 320.9 | 679 | 671 | 730 | 1.09 | 1.08 |
| G 318.91-0.16∗ | 40.8 | 1078 | 725 | 1513 | 2.09 | 1.40 |
| G 328.81+0.63 | 239.2 | 1680 | 1461 | 2033 | 1.39 | 1.21 |
| G 336.41-0.26 | 7.4 | 35 | 28 | 39 | 1.39 | 1.11 |
| G 339.88-1.26 | 7.6 | 10 | 6.6 | 22 | 3.33 | 2.20 |
| G 345.01+1.79 | 232.1 | 273 | 286 | 298 | 1.05 | 1.09 |
| G 345.00+1.79∗ | 7.3 | 62 | 60 | 128 | 2.13 | 2.06 |
| G 345.01+1.82∗ | 54.6 | 139 | 145 | 176 | 1.21 | 1.26 |
| NGC6334F | 479.6 | 2694 | 2130 | 4622 | 2.17 | 1.71 |
| NGC6334E∗ | 417 | 5100 | 12.23 | |||
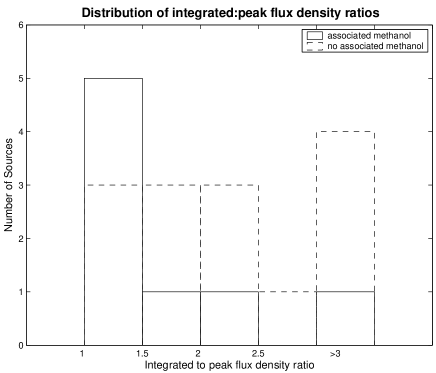
A direct quantitative comparison of the amount of extended emission in Hii regions with and without associated class II methanol masers is shown in Fig. 9. A sample of 22 sources has been compiled, the 11 reported in the current work and the 11 from Kurtz et al. (1999) for which emission was detected in the D-array observations. We have not included the observations of Kim & Koo (2001) in this analysis as they are significantly different from those we report here and those of Kurtz et al.. For the current observations we have calculated the ratio of the integrated to the peak flux density for each source detected in the 750-m array observations, while for Kurtz et al. we have taken the ratio of the integrated flux density within a 50 arcsec square at the centre of the field to the peak flux density for the D-array observations (columns 5 & 4 of their Table 4). There are a total of eight sources in the sample with associated methanol masers, the seven from the current work, plus IRAS 18496+0004 from Kurtz et al.. IRAS 22543+6145/Cep A from the Kurtz et al. list also has an associated 6.7-GHz methanol maser maser, but no emission is reported in their D-array observations. There are fourteen sources in the sample without associated methanol masers, the ten sources for which Kurtz et al. (1999) list D-array observations and four sources from the current work (marked with an asterisk in Table 2). Although the sample size is small, there is a clear tendency for sources with associated methanol masers to have quantitatively less extended emission. Three of the eight sources (38 per cent) with associated 6.7-GHz methanol masers have a ratio of integrated to peak flux density greater than 1.5 (G 308.92+0.12, G 339.88-1.26 and NGC6334F). In contrast eleven of the fourteen sources without an associated 6.7-GHz methanol maser (79 per cent) have a radio greater than 1.5. High-mass stars form in clusters and so we expect that for some regions the observed radio continuum emission will be due to more than one ionizing source, possibly at different evolutionary stages. Considering that this will confuse the simple scenario we have outlined and dilute the difference between the two samples, the difference we find is striking.
A fundamental issue relating to Hii regions with both compact components and extended emission is whether they are truly associated, that is are they both produced by a single exciting star? Kurtz et al. (1999) argued on the basis of morphology that in the majority of cases where they see extended emission it is associated with the compact component. Kim & Koo (2001) made single dish recombination line observations towards their sample and found that in all but one case both the compact and extended components have the same approximate velocity. For our sample of Hii regions associated with methanol masers the limited degree and morphology of the extended emission observed in most cases strongly suggests that it is associated with the compact region. This is confirmed by Shabala et al. (2004) which used the ATCA in the 750D array to make recombination line observations of the same sample of Hii regions. Recombination lines were detected towards five of the eight sources and in each case the moment maps demonstrate that the compact and extended emission are associated.
Our results and those of Shabala et al. (2004) and Kurtz et al. (1999) appear to be consistent with the scenario outlined in the introduction. This scenario is appealing as it explains both the lifetime problem and association between compact and extended emission. It is also consistent with the observation that the majority of IRAS sources with colours consistent with UCHii regions do not have associated 6.7-GHz methanol masers (Szymczak & Kus, 2000). Our observations suggest that those Hii regions with associated 6.7-GHz masers are the young ones, while those without are likely to exhibit significant extended radio continuum emission in addition to any compact components. The remaining hurdle for our scenario is a plausible mechanism through which it can occur. Kim & Koo (2001) suggested that the association between compact and extended radio continuum emission in Hii regions may be due to champagne flows in a hierarchically structure molecular cloud. Shabala et al. (2004) have used recombination line observations and information from the literature to derive a number of physical parameters for the Hii regions in this sample. They have modelled the evolution of Hii regions in a hierarchical molecular cloud formation and find good agreement between the observed and predicted radii and emission measures.
There is a well known tendency for the stellar type as estimated from the IR luminosity (typically IRAS observations) to exceed that obtained using the radio flux density. A variety of explanations have been forwarded for this, including that at the spatial resolution of IRAS the IR luminosity measured is that for the cluster, rather than for an individual star and that dust absorbs some of the UV flux from the star, hence reducing the radio flux density. Our observations and those of Kurtz et al. (1999) and Kim & Koo (2001) suggest that another factor in the discrepancy between IR and radio determined spectral types is that most high resolution interferometry observations significantly underestimate the total radio flux density from the Hii regions due to their insensitivity to the extended component. This effect will be greatest for older Hii regions where the fraction of the total flux density in the extended state becomes a significant.
5 Conclusions
Observations of eight Hii regions associated with 6.7-GHz methanol masers find a significantly lower degree of extended emission associated with these sources than in other samples. We suggest that this is consistent with a scenario where both compact and diffuse ionized structures co-exist for a significant fraction of Hii region lifetimes. Modelling by Shabala et al. (2004) of high-mass stars forming in hierarchically structured molecular clouds is consistent with our observations and appears to provide a consistent solution for the lifetime problem.
Acknowledgements
We would like to thank Marco Costa for his assistance with some of the observations presented in this paper. This research has made use of NASA’s Astrophysics Data System Abstract Service. Financial support for this work was provided by the Australian Research Council. This research has made use of the NASA/ IPAC Infrared Science Archive, which is operated by the Jet Propulsion Laboratory, California Institute of Technology, under contract with the National Aeronautics and Space Administration.
References
- Brooks & Whiteoak (2001) Brooks K. J., Whiteoak J. B., 2001, MNRAS, 320, 465
- Cheung et al. (1978) Cheung L., Frogel J. A., Gezari D. Y., Hauser M. G., 1978, ApJ, 226, L149
- Cragg et al. (2001) Cragg D. M., Sobolev A. M., Ellingsen S. P., Caswell J. L., Godfrey P. D., Salii S. V., Dodson R. G., 2001, MNRAS, 323, 939
- (4) De Buizer J. M., Piña R. K., Telesco C. M., 2000, ApJSS, 130, 437
- De Buizer et al. (2002a) De Buizer J. M., Radomski J. T., Piña R. K., Telesco C. M., 2002, ApJ, 580, 305
- De Buizer et al. (2002b) De Buizer J. M., Walsh A. J., Piña R. K., Phillips C. J., Telesco C. M., 2002, ApJ, 564, 327
- De Preeet al. (1995) De Pree C. G., Rodríguez L. F., Goss W. M., 1995, Rev. Mexicana Astron. Astrofis., 31, 39
- Dodson et al. (2004) Dodson R., Ojha R., Ellingsen S. P., 2004, MNRAS, 351, 779
- Dyson et al. (1995) Dyson J. E., Williams R. J. R., Redman M. P., 1995, MNRAS, 277, 700
- Ellingsen et al. (1996) Ellingsen S. P., Norris R. P., McCulloch P. M., 1996, MNRAS, 279, 101
- Green et al. (1999) Green A. J., Cram L. E., Large M. I., Ye T., 1999, ApJS, 122, 207
- Hollenbach et al. (1994) Hollenbach D., Johnstone D., Lizano S., Shu F. 1994, ApJ, 428, 654
- Kahn (1954) Kahn F. D., 1954, Bull Astron. Inst. Netherlands, 12, 187
- Kim & Koo (2001) Kim K-T., Koo B-C., 2001, ApJ, 549, 979
- Kogan & Slysh (1998) Kogan L., Slysh V., 1998, ApJ, 497, 800
- Kraemer & Jackson (1999) Kraemer K. E., Jackson J. M., 1999, ApJS, 124 439
- Kraemer et al. (1999) Kraemer K. E., Deutsch L. K., Jackson J. M., Hora J. L., Fazio G. G., Hoffmann W. F., Dayal A., 1999, ApJ, 516, 817
- Kurtz et al. (1999) Kurtz S. E., Watson A. M., Hofner P., Otte B., 1999, ApJ, 514, 232
- Kurtz et al. (2000) Kurtz S. E., Cesaroni R., Churchwell E., Hofner P., Walmsley C. M., 2000, in Protostars & Planets IV, Ed V. Mannings, A. Boss, S. Russell (Tuscon: Univ. Arizona Press), 299
- Kuiper et al. (1995) Kuiper T. B. H., Peters W. L. III, Foster J. R., Gardner F. F., Whiteoak J. B., 1995, ApJ, 446, 692
- McCutcheon et al. (2000) McCutcheon W. H., Sandell G., Matthews H. E., Kuiper T. B. H., Sutton E. C., Danchi W. C., Sato T., 2000, MNRAS, 316, 152
- Minier et al. (2003) Minier V., Ellingsen S. P., Norris R. P., Booth R. S., 2003 A&A, 403, 1095
- Norris et al. (1993) Norris R. P., Whiteoak J. B., Caswell J. L., Wieringa M. H., Gough R. G., 1993, ApJ, 412, 222
- Pestalozzi et al. (2002) Pestalozzi M., Humphreys E. M. L., Booth R. S., 2002, A&A, 384, L15
- Phillips et al. (1998) Phillips C. J., Norris R. P., Ellingsen S. P., McCulloch P. M., 1998, MNRAS, 300, 1131
- Phillips et al. (2004) Phillips C. J., Smith C. H., Ellingsen S. P., Norris R. P., McCulloch P. M. 2004, MNRAS submitted.
- Reid et al. (1980) Reid M. J., Haschick A. D., Burke B. F., Moran J. M., Johnston K. J., Swenson Jr G. W., 1980, ApJ, 239, 89
- Rodríguez et al. (1982) Rodríguez L. F., Cantó J., Moran J. M., 1982, ApJ, 255, 103
- Sandell (2000) Sandell G., 2000, A&A, 358, 242
- Sekimoto et al. (2000) Sekimoto Y., Matsuzaki K., Kamae T., Tatematsu K., Yamamoto S., Umemoto T., 2000, PASJ, 52, L31
- Shabala et al. (2004) Shabala S. S., Ellingsen S. P., Kurtz S. E., Forbes L. K., 2004, MNRAS submitted
- Straw et al. (1989) Straw S. M., Hyland A. R., McGregor P. J., 1989, ApJS, 69, 99
- Szymczak & Kus (2000) Szymczak M., Kus A. J., 2000, A&A, 360, 311
- Tenorio-Tagle (1979) Tenorio-Tagle G., 1979, A&A, 71, 59
- Val’tts (1998) Val’tts I. E., 1998, Astron. Lett, 24, 788
- Val’tts et al. (1999) Val’tts I. E., Ellingsen S. P., Slysh V. I., Kalenskii S. V., Otrupcek R., Voronkov M. A., 1999, MNRAS, 310, 1077
- Van Buren et al. (1990) Van Buren D., Mac Low M. -M, Wood D. O. S., Churchwell E., 1990, ApJ, 353, 570
- van der Walt et al. (1996) van der Walt D. J., Retief S. J. P., Gaylard M. J., MacLeod G. C., 1996, MNRAS, 282, 1085
- Walsh et al. (1998) Walsh A. J., Burton M. G., Hyland A. R., Robinson G., 1998, MNRAS, 301, 640
- Walsh et al. (2003) Walsh A. J., Macdonald G. H., Alvey N. D. S., Burton M. G., Lee J. -K., 2003, A&A, 410, 597
- Wood & Churchwell (1989a) Wood D. O. S., Churchwell E., 1989a, ApJ, 340, 265
- Wood & Churchwell (1989b) Wood D. O. S., Churchwell E., 1989b, ApJSS, 69, 831
- Xie et al. (1996) Xie T., Mundy L. G., Vogel S. N., Hofner P., 1996, ApJ, 473, L131