The galaxy-dark matter bias in the Garching-Bonn Deep Survey
Abstract:
We measured the bias and correlation factor of galaxies with respect to the dark matter using the aperture statistics including the aperture mass from weak gravitational lensing. The analysis was performed for three galaxy samples selected by R-band magnitudes; the median redshifts of the samples were and , respectively. The brightest sample has the strongest peak in redshift and can therefore be most accurately represented by a single redshift. The data used is the GaBoDS, and the COMBO-17 survey for an accurate estimate of the redshift distribution of the galaxies. Assuming the currently favoured model as cosmology, we obtained values for the linear stochastic galaxy-dark matter bias on angular scales . At , the median redshifts of the samples correspond to a typical physical scale of with , respectively.
Over the investigated range of physical scales the bias factor stays almost constant, possibly rising on the smallest scales. Here the errors are largest, however. Averaging the measurements for the bias over the range , weighting with the cosmic variance error, yields , respectively (). Galaxies are thus less clustered than the total matter on that particular range of scales (anti-biased). This is what also has been observed by Hoekstra et al. (2002), albeit that their increasing trend towards a larger bias factor on larger scales is not visible in our analysis. As for the correlation factor we see, as Hoekstra et al., a slight increase to in the last angular bin from an almost constant value on smaller scales; the weighted average here over the same range as before is , respectively. Therefore, on these scales we find a degree of stochasticity or/and nonlinearity in the relation between dark matter and galaxy density. Within the measurement uncertainties and over the redshift range represented by our galaxy samples we do not see an evolution with redshift of the bias.
PoS(BDMH2004)097
1 Introduction
The current paradigm of the model is mainly supported by observations of the cosmic microwave background, the apparent luminosity-distance relation, the element ratios in the primordial gas and the ages of the oldest objects. The most recent surprising discovery is the dark energy (). According to the model the structure in the matter distribution formed from an almost homogeneous state with primordial adiabatic fluctuations by gravitational collapse in a globally expanding Universe. Mainly responsible for the collapse is a collisionless, pressureless kind of matter with a small velocity dispersion, the cold dark matter (); it reveals itself only indirectly through its effect on the baryonic matter () by its gravitational field: for instance in the dynamics of galaxies, galaxy rotation curves, the distribution of x-ray emitting gas in galaxy clusters or gravitational lensing.
In this picture, galaxies take only a minor part, in the sense that their mass is completely negligible compared to the total mass content. The laws determining the variety of galaxy types and their distribution are very complex. It would be very surprising if this complexity would eventually have resulted in a simple linear one-to-one relationship between the galaxy density and total matter density making the galaxies so-called unbiased tracers of the total matter distribution. On the other hand, if we knew the differences in the distribution of galaxies with respect to the dark matter as a function of galaxy type and redshift we could learn more about the galaxy formation and evolution process.
Biasing between two density fields, say for the dark matter density and for the galaxy number density, can in general be quantified invoking the joint probability distribution function (pdf), , of the density contrasts, , at the same point in the density fields at some redshift (local Eulerian bias). Using second order statistics only, we can distinguish between two possibly scale-dependent bias parameters and , which we call the linear stochastic bias. The quantity is a measure of the difference in clustering while measures the stochasticity and non-linearity in the relation between and . A more advanced scheme that also separates non-linearity and stochasticity has been proposed by Dekel & Lavav (1999). This scheme is, however, not applicable if only second order statistics are used as in the technique applied in this paper.
As we know from observations (cf. Simon (2004), introduction therein) galaxy biasing is a function of smoothing scale, redshift, galaxy type and luminosity. As some examples, on scales larger than about and at low redshifts, galaxies as a whole are not biased with respect to the dark matter but slightly anti-biased, , on intermediate scales. The large-scale bias increases towards larger redshifts, and red and blue galaxies are differently biased.
In this paper, we apply the method of Hoekstra et al. (2002) (Sect. 2) to the Garching-Bonn Deep Survey (Sect. 3) to obtain the linear stochastic biasing coefficients, and , of three galaxy samples, binned by their apparent R-band magnitude, with respect to the total matter distribution. The final result is presented in Sect. 4.
2 Method
The method we are applying here, based on the work of Schneider (1998) and van Waerbeke (1998), is explained in more detail Hoekstra et al. (2002). This technique uses the weak gravitational lensing effect to map the total matter distribution along the line-of-sight; the tidal gravitational field of the matter inhomogeneities is imprinted in the coherent shape distortions of distant background galaxies. Considering the tangential alignments of these galaxies about some aperture centre, the aperture mass gives a noisy measure for the projected line-of-sight dark matter density contrast smoothed to some typical scale. The scale depends on the aperture filter and aperture size . Employing the same kind of aperture statistics also provides the aperture number count which is the projected number density contrast of foreground galaxies. Averaging over many apertures results in an estimate for the linear stochastic bias between galaxies and dark matter
| (1) |
and are calibration factors computed based on the cosmological model and the redshift distribution of the background and foreground galaxies. In practise, the second order moments with are obtained as integral transforms of observed two-point correlation functions: the angular correlation of the foreground galaxies (), galaxy-galaxy lensing () and cosmic shear correlations ().
3 GaBoDS: The Garching-Bonn Deep Survey
The GaBoDS (Schirmer et al. 2003) comprises roughly of high-quality data (seeing better than one arcsec) in R-band taken with the Wide Field Imager (WFI) at the 2.2m telescope of MPG/ESO at La Silla, Chile; the field of view is covered with 8 CCD chips. The data set was compiled by Mischa Schirmer and Thomas Erben partly from archived ESO data, partly from new observations (). They selected and reduced the data especially for applications with focus on weak gravitational lensing. The data set can roughly be categorised into a shallow (, ), medium (, ) and deep (, ) set depending on the total number of frames usable for the co-addition of each field. This work uses only the deep and medium deep category, in total consisting of WFI fields.
We subdivided the galaxy catalogues into three foreground (FORE-I, FORE-II, FORE-III) and one background bin (BACK, for lensing) representing different median redshifts:
| sample | bin limits [mag] | #objects | |
|---|---|---|---|
| FORE-I | |||
| FORE-II | |||
| FORE-III | |||
| BACK |
Three of the patches were part of the COMBO-17 survey (Wolf et al. 2004). They provide, among other things, highly accurate photometric redshifts of galaxies brighter than with an uncertainty of roughly ; see Fig. 1. The average redshift distribution in these fields was used as an estimate for the distribution of all galaxies in the GaBoDS sample.
4 Results
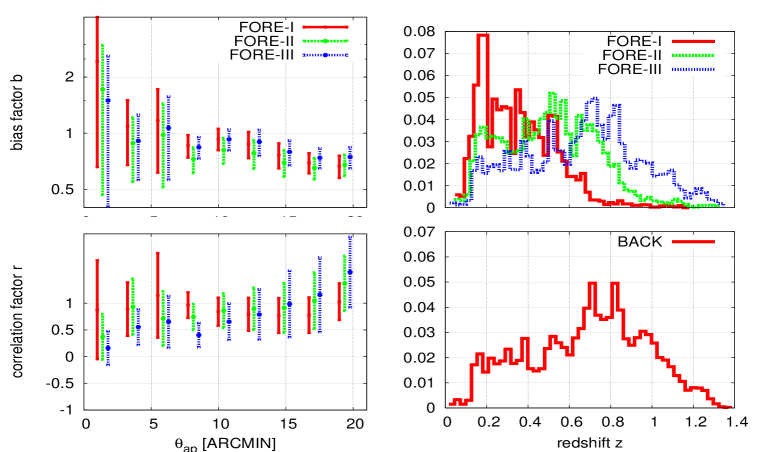
The final result of our effort is comprised in Fig. 1. Within the measurement uncertainties ( cosmic variance) the bias parameters stay approximately constant over the probed physical scales, maybe rising towards larger scales, for , or smaller scales, for . The results for FORE-I are comparable to Hoekstra et al. (2002). Considering the uncertainties and the mean redshifts of the three galaxy foreground samples the bias evolution on these scales has to be smaller than and ( confidence) for .
References
- [1] Dekel, A., Lahav, O., 1999, ApJ, 520, 24
- [2] Hoekstra, H., van Waerbeke, L., Gladders, et al., 2002, ApJ, 577, 604
- [3] Schirmer, M., Erben, T., Schneider, P., et al., 2003, A&A, 407, 869
- [4] Schneider, P., 1998, ApJ, 498, 43
- [5] Simon, P., 2004, A&A, in press, astroph/0409435
- [6] van Waerbeke, L., 1998, A&A, 334, 1
- [7] Wolf, C., Meisenheimer, K., Kleinheinrich, M., et al., 2004, A & A, 421, 913