Three Additional Quiescent Low-Mass X-ray Binary Candidates in 47 Tucanae
Abstract
We identify through their X-ray spectra one certain (W37) and two probable (W17 and X4) quiescent low-mass X-ray binaries (qLMXBs) containing neutron stars in a long X-ray exposure of the globular cluster 47 Tucanae, in addition to the two previously known qLMXBs. W37’s spectrum is dominated by a blackbody-like component consistent with radiation from the hydrogen atmosphere of a 10 km neutron star. W37’s lightcurve shows strong X-ray variability which we attribute to variations in its absorbing column depth, and eclipses with a probable 3.087 hour period. For most of our exposures, W37’s blackbody-like emission (assumed to be from the neutron star surface) is almost completely obscured, yet some soft X-rays (of uncertain origin) remain. Two additional candidates, W17 and X4, present X-ray spectra dominated by a harder component, fit by a power-law of photon index 1.6-3. An additional soft component is required for both W17 and X4, which can be fit with a 10 km hydrogen-atmosphere neutron star model. X4 shows significant variability, which may arise from either its power-law or hydrogen-atmosphere spectral component. Both W17 and X4 show rather low X-ray luminosities, (0.5-10 keV) ergs s-1. All three candidate qLMXBs would be difficult to identify in other globular clusters, suggesting an additional reservoir of fainter qLMXBs in globular clusters that may be of similar numbers as the group of previously identified objects. The number of millisecond pulsars inferred to exist in 47 Tuc is less than 10 times larger than the number of qLMXBs in 47 Tuc, indicating that for typical inferred lifetimes of 10 and 1 Gyr respectively, their birthrates are comparable.
Subject headings:
accretion disks — binaries: close, eclipsing — binaries : X-rays — globular clusters: individual (NGC 104) — stars: neutron1. Introduction
Several soft X-ray transients, identified in outburst to be accreting neutron star (NS) systems, have been observed in quiescence (see Campana et al., 1998; Rutledge et al., 2002b). These systems show soft spectra, generally consisting of a thermal, blackbody-like component, and in most cases a harder component extending to higher energies, usually fit with a power-law of photon index 1-2. The nature of their X-ray emission remains unsolved. Brown et al. (1998, see also Campana et al. 1998) advanced the idea that the soft thermal component seen in these systems can be explained by the release, over long timescales, of heat injected into the deep crust by pycnonuclear reactions driven during accretion (the “deep crustal heating” model). This scenario accurately predicts the quiescent luminosity of some qLMXBs, based on their outburst history (Rutledge et al., 2000, 2001a), and must operate at some level. (Recent observations of low quiescent luminosities in some qLMXBs (Colpi et al., 2001; Campana et al., 2002; Yakovlev et al., 2003; Wijnands, 2004) may require nonstandard cooling processes.)
However, the deep crustal heating model cannot explain the hard power-law component, which is attributed to continued accretion and/or a shock from a pulsar wind (see Campana et al., 1998; Menou & McClintock, 2001). Continued accretion has also been suggested as an explanation for the thermal component, as the radiation spectrum from matter accreting radially onto a neutron star should be similar to that from the ionized hydrogen atmosphere of a hot non-accreting neutron star (Zampieri et al., 1995). Models without any continuing accretion have difficulty explaining the short-timescale ( s) variability observed from Aquila X-1 and Cen X-4 (Rutledge et al., 2002b; Campana et al., 2004), and the days-timescale variability observed from Cen X-4 (Campana et al., 1997) and other qLMXBs. However, many qLMXBs in globular clusters show neither significant variability nor an additional power-law spectral component (Heinke et al., 2003a, hereafter HGL03). Understanding the emission process will be critical for modeling the observed spectrum and deriving fundamental physical parameters, such as mass, radius, and magnetic field (Lattimer & Prakash, 2004; Brown et al., 1998).
Globular clusters are overabundant in accreting NS systems compared to the field, with thirty-eight probable qLMXBs and active LMXBs known so far (Heinke et al., 2003b). The well-studied globular cluster 47 Tucanae (NGC 104; hereafter 47 Tuc) is ideal for X-ray studies of its binary populations (Grindlay et al., 2001a) due to its close distance (4.85 kpc, Gratton et al., 2003) and low reddening (, Gratton et al., 2003). Two qLMXBs in 47 Tuc, X5 and X7 (originally detected by ROSAT, Verbunt & Hasinger, 1998), have been spectrally identified by HGL03. HGL03 constrained the range of mass and radius space for X7 using several different possible assumptions about its spectrum, and showed that X5 is an eclipsing system with an 8.67 hour period and strong dipping activity.
We have shown (HGL03, Heinke et al., 2003b) that the identified qLMXBs in 47 Tuc, and in globular clusters generally, have little to no hard power-law component in contrast to the best-studied field systems, Cen X-4 and Aql X-1 (Rutledge et al., 2001a, 2002b). The exceptions thus far have been the transient LMXB in NGC 6440, which entered outburst 13 months after the observation (in’t Zand et al., 2001), and the transient LMXB in Terzan 5 (Wijnands et al., 2003), both relatively bright qLMXBs. If the strength of the power-law component (and short-term variability) measures continuing low-level accretion (Campana et al., 1998; Rutledge et al., 2002a), then the absence of these indicators in globular cluster systems might be taken to indicate extremely low levels of accretion activity. Recently, Jonker et al. (2004a) noted that the relative strength of the spectral component fit with power-laws in quiescent NS transients seems to increase for X-ray luminosities significantly larger or smaller than ergs s-1, where its relative strength is often at a minimum (but cf. Wijnands et al., 2003). They suggested that this spectral component arises from different processes (accretion vs. pulsar wind shock?) in systems with X-ray luminosities above or below ergs s-1.
In late 2002, we obtained deeper observations of 47 Tuc (Heinke et al., 2004), allowing detailed spectral modeling of X-ray sources as faint as ergs s-1. Most sources were found to be consistent with powerlaw or thermal plasma models, but some sources required more complicated models. The highly variable X-ray source W37 (=CXOGLB J002404.9-720451) showed a steep spectrum well-described by a blackbody, and the X-ray sources W17 (=CXOGLB J002408.3-720431) and X4 (=W125, or CXOGLB J002353.9-720350) showed two-component spectra in which the soft component could be well-represented by a model of a hydrogen atmosphere appropriate for a neutron star. X4 was first identified in ROSAT HRI data (Verbunt & Hasinger, 1998), while W17 and W37 are located in areas too crowded to have been identified in lower-resolution ROSAT data at their current fluxes. None of these three have been positively identified with optical counterparts of any category (Edmonds et al., 2003a, b). In this paper, we study these three strong qLMXB candidates in detail. We describe the observations and our reduction in § 2, the timing analysis in § 2.1, and the spectral analyses in § 2.2. Discussion and conclusions are in § 3.
2. Observations and Analysis
The data used in this paper are from the 2000 and 2002 observations of the globular cluster 47 Tuc. Both sets of observations and their initial reduction are described in detail in Heinke et al. (2004); prior analyses of the 2000 dataset are described in Grindlay et al. (2001a, 2002) and HGL03. Both observations interleaved short exposures using subarrays (chosen to reduce pileup, which is not a significant issue for the three sources in this paper) with longer exposures. The observations are summarized in Table 1; we note that OBS_ID 3385 suffered strongly increased background, so we do not use that short observation. We reprocessed (using CIAO 3.0) both the 2000 and 2002 observations to remove the 025 pixel randomization added in standard processing, implement the CTI correction algorithm on the 2000 data, and use updated (Feb. 2004, CALDB v. 2.26) calibration files. We did not remove events flagged as cosmic-ray afterglows by the standard processing. 290 sources were detected using the WAVDETECT routine in the 0.3-6 and 0.3-2 keV energy bands, and ten additional sources (missed by WAVDETECT due to crowding) were added to the source list by hand.
We used the ACIS_EXTRACT routine (Broos et al., 2002) from the Tools for X-ray Analysis (TARA111http://www.astro.psu.edu/xray/docs/TARA/) to construct polygonal extraction regions generally chosen to match the 90% encircled energy (at 1.5 keV) from the point-spread function (PSF). We extracted source spectra and background spectra from nearby source-free regions, and corrected the ancillary response function (ARF) for the energy-varying fraction of the PSF enclosed by the extraction region. We used the Jan. 2004 release of the ACIS contamination model to correct for the hydrocarbon buildup on the detectors (Marshall et al., 2004). We adjusted all event times to the solar system barycenter using satellite orbit files provided by the X-ray Center.
2.1. Timing Analysis
Kolmogorov-Smirnov (KS) tests on the 2002 event arrival times from W37 and X4 confirm that both are clearly variable on short timescales, with KS probabilities of constancy reaching and for the first 2002 observations of W37 and X4 respectively. W17 shows only marginal evidence for variability, with KS probabilities reaching only 0.04. X4 falls on a chip gap in the 2000 data, and W37 is much fainter in the 2000 data. W37 receives a photon flux over five times higher in the first 2002 observation than in any other observation, and 75% of the 2002 photons from W37 arrive in the first quarter of the data. X4 appears to have dimmed slightly between the first and fourth long 2002 observations (at 99% conf.).
We show the first (and most variable) sections of the 2002 lightcurves for W37 and X4 in Figures 1 and 2. Generating a power spectrum for W37 (using XRONOS, 222http://heasarc.gsfc.nasa.gov/docs/xanadu/xronos/xronos.html) gives a possible peak around 11000 seconds along with strong red noise. An epoch folding search using all the 2002 observations finds a periodicity at 11112.5 () seconds. Careful inspection of W37’s lightcurves reveals likely eclipses, indicated in Figures 1 and 3 (left; a folded lightcurve), consistent with the 11112.5 second period. The two clearest eclipses are separated by 6.2 hours, so we also include a lightcurve folded on twice our preferred period (Figure 3, right), showing two apparent eclipses. This indicates that our preferred period is probably correct, but the low count rate of the data may allow for alternative solutions. The folded lightcurve suggests eclipses seconds in length.
We note that W37’s lightcurve is similar to that of X5, presented in HGL03 and Heinke et al. (2005, in prep), suggesting that the strong variability seen in W37 is also probably due to a varying column of cold gas associated with an accretion disk viewed nearly edge-on. However, W37 may show residual emission during eclipses, which is not seen for X5 (HGL03). The period indicates a companion mass of order 0.34 , if the companion has a density appropriate for lower main sequence stars (Frank et al., 1992, eq. 4.9). Since these companions are sometimes bloated (King & Ritter, 1999; Podsiadlowski et al., 2002; Orosz & van Kerkwijk, 2003; Kaluzny & Thompson, 2003), the true mass may be smaller. Assuming a 1.4 neutron star, the orbital separation would be cm.
We calculate the hardness ratio for W37 as the ratio of the counts detected in the 1-6 keV and 0.3-1 keV bands (this choice divides the detected counts roughly evenly), and plot this ratio in the lower panel of Figure 1. Comparison with the upper panel shows that decreases in the observed flux correlate well with increasing hardness. We confirm this with a Spearman rank-order correlation test (Press et al., 1992) comparing the binned (1200 second) lightcurve with the similarly binned hardness ratio. This gives =-0.446, a negative correlation, with chance probability . This is a strong sign that the variation is due to changing photoelectric absorption. We divide W37’s long 2002 observations into high and low flux states (e.g., the high flux state portions indicated in Figure 1), which we use to extract spectra.
X4’s total and hardness ratio lightcurve for OBS_IDs 2735 and 3384 are shown in Figure 2. No periodicities are apparent in X4’s lightcurve or power spectra. X4’s spectrum appears to harden as it brightens, in contrast to W37, which indicates the variability is not due to increasing photoelectric absorption. We confirm this with a Spearman rank-order correlation test on OBS_ID 2735, finding =0.444 and chance probability for the binned (1200 second) lightcurve and hardness ratio. We extract high and low portions of X4’s lightcurve from the first observation for spectral fitting, which are marked in Figure 2.
2.2. Spectral Analysis
In Heinke et al. (2004), we identify W37, X4, and W17 as possible qLMXBs by their agreement with models consisting of a hydrogen-atmosphere model and a power-law, along with their failure to fit single-component models typical of thermal plasma (such as seen in cataclysmic variables and X-ray active binaries). Here, we analyze time-resolved spectra for W37 and X4, and use the merged spectra (2000 and 2002) for W17 (since it shows no variability). We use the XSPEC phabs model to describe neutral absorbing gas. We use the Lloyd (2003) model to describe thermal blackbody-like emission from the hydrogen atmosphere of a neutron star, fixing the redshift to 0.306 (appropriate for a 1.4 , 10 km neutron star) and take the distance to be 4.85 kpc (Gratton et al., 2003). The total number of counts in the 2002 spectra of W37, W17 and X4 were 1277, 909, and 1426, while from the 2000 data 46, 114, and 62 counts were available. We binned spectra with more than 1000 counts with 40 counts/bin, spectra from the 2000 observations or with fewer than 50 counts at 10 counts/bin, and other spectra at 20 counts/bin.
2.2.1 W17
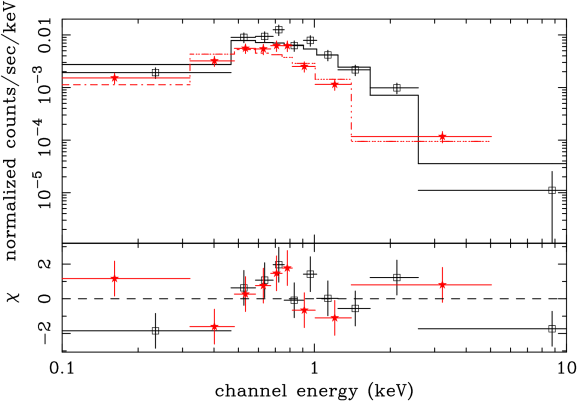
W17 shows no variability on short or long timescales, so we fit the combined 2002 and combined 2000 datasets simultaneously. We try a variety of absorbed single-component models including blackbody, bremsstrahlung, MEKAL, power-law, and hydrogen atmosphere neutron star models, but do not find good fits with any. The best fit of these, a power-law model, gives , for a 2% null hypothesis probability (nhp). Models consisting of two mekal components also do not produce good fits. Adding a soft component, such as the hydrogen-atmosphere neutron star model of Lloyd (2003), to the power-law model improves the statistics tremendously (, nhp=37%; F-test gives probability of that the extra component is not needed). The inferred radius of the neutron star model, km, is perfectly consistent with the canonical 1.4 , 10 km neutron star predictions, although it cannot usefully constrain the neutron star structure. (The inferred radius for a blackbody would be only km.) A qLMXB model is thus an excellent explanation for this spectrum, shown in Figure 4. The parameters for a fit with a Lloyd H-atmosphere model and power-law are listed in Table 2. The power-law component provides a majority (%) of the 0.5-10 keV flux, and the thermal component is quite weak, with unabsorbed X-ray luminosity ergs s-1 and inferred bolometric luminosity ergs s-1.
2.2.2 W37
We identify pieces of W37’s lightcurves at high and low flux levels in the four long observations, with only a low flux level in the second long observation; the (barycentered) times are listed in Table 3. We extracted spectra from these periods, as well as from the summed 2000 observations, and background spectra from surrounding source-free regions, producing eight spectra of varied quality.
The hardening of the spectrum with decreasing flux suggests that variation of the column density is responsible for the spectral variations, and so we allow the gas column to vary between spectral segments. However, no absorbed single-component model was able to describe the eight spectra simultaneously by only varying the absorption and one other model parameter. (Allowing all the parameters to vary freely allows some reasonable fits, but loses physical meaning. For instance, a blackbody with strongly varying normalization, temperature and absorbing column, while a reasonable fit, is difficult to interpret.) No single- or double-temperature thermal plasma model (represented by VMEKAL models in XSPEC, set to cluster abundances) provides a good fit to the brightest portions of the data. The brightest portions of the data are best fit by a blackbody or hydrogen atmosphere neutron star model with varying absorption. If described by a blackbody, the inferred radius is only km in size. This component is well-described by a hydrogen-atmosphere neutron star model with a constant physical radius of order 10 km ( km) and constant temperature ( eV). Therefore we infer that W37 is a qLMXB containing a neutron star.
The fainter portions show additional soft flux beyond what can be accounted for by an absorbed H-atmosphere (or blackbody) component. This suggests a second component that does not suffer the same absorption as the primary spectral component. We model this component with a separately absorbed power-law, although a variety of models can account for this low-count component equally well (including a 0.6 keV bremsstrahlung spectrum, a 0.1 keV blackbody with inferred 1 km radius, or a 0.13 keV thermal plasma model), and we do not know its physical origin. We hold the faint component, its absorption, and the H-atmosphere model parameters fixed between data portions, and vary only the absorption to the H-atmosphere model. This is the XSPEC model PHABS ( POW + PHABS * HATM ), varying only the second PHABS component between observations. We find a good fit ( for 57 degrees of freedom, or dof, and an nhp of 10.6%). We are unable to impose serious constraints upon this model if additional parameters are allowed to vary, since the faint portions of the data have very few counts. Therefore we cannot usefully constrain any temporal or spectral variability in the faint component. We show part of this fit (only 4 of 8 spectra to reduce confusion) in Figure 5, and give details of the fit in Tables 2 and 3. The fitted absorption column to the probable neutron star varies by a factor , decreasing to a value consistent with the cluster column during parts of the first 2002 observation. The faint component is responsible for a very small portion (%) of the unabsorbed flux, and produces a photon index of . The absorption column to the faint component is poorly constrained () but consistent with the column to the cluster. The lowest-flux spectrum (from OBS_ID 2736), dominated by the faint component, is one of the spectra shown in Figure 5.
2.2.3 X4
X4 varies during the first 2002 observation, but is not clearly variable within other observations. We separately fit the high-flux and low-flux parts of the first 2002 observation (OBS_ID 2735), and data from each of the other three long 2002 observations, plus one spectrum from the combined 2000 observations. We found that the remaining 2002 observations were spectrally indistinguishable, so we combined all 2002 data except OBS_ID 2735 into one spectrum, and fit the high and low-flux parts of 2735, the rest of the 2002 data, and the combined 2000 data simultaneously. Fits with any single absorbed component, with all parameters allowed to vary, failed to give reasonable fits to the spectra. A power-law fit gave the lowest , nhp=3.9%, if is allowed to vary substantially along with the power-law parameters. However, if is not allowed to vary during the 2002 data (as indicated in § 2.1 above), then =1.52, nhp=1.9%. Adding a H-atmosphere model improves the fit substantially (F-statistic=4.38, prob. 1.9% extra component not required), and results in an inferred radius consistent with the 10 km canonical NS radius. We conclude that X4 is a good candidate for a qLMXB. Alternate models involving two VMEKAL components with all temperatures and normalizations free do not produce good fits.
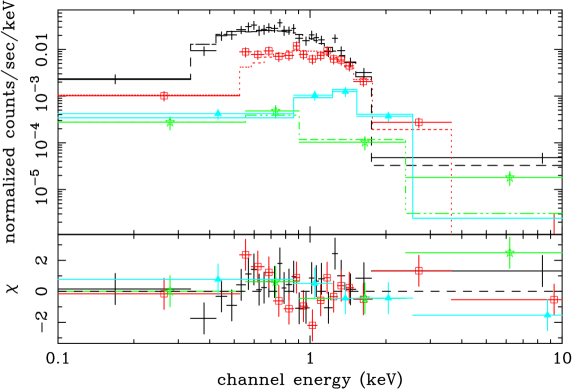
The variability during OBS_ID 2735 demands that at least one component of the spectrum varies. Varying alone does not produce a good fit (, nhp=%). Varying the power-law component does produce a good fit (, nhp=11%; see Table 2). We show this fit for the two components of OBS_ID 2735 (Fig. 6) and for the remainder of the 2002 observations, indicating the contributions of the two components (Fig. 7). Varying only the H-atmosphere component’s temperature and radius also produces a good fit (, nhp=7.3%; see Table 2). Varying both the power-law and H-atmosphere parameters (, nhp=20%) is only a marginal improvement over varying a single component, and requires correlated swings in numerous parameters (which we assume is less likely than one or two varying parameters). Varying only the power-law normalization also produces a good fit (, nhp=7.5%), with a power-law photon index of 2.2. Varying the H-atmosphere temperature alone does not produce a good fit (, nhp=0.7%), nor does varying the normalization (and inferred radius) alone (, nhp=0.07%). If the thermal component is due to continued accretion, and the variation is due to changes in the accretion rate onto the neutron star, we would expect only the temperature to vary, not the inferred radius. It is possible that the emitting area varies if accretion is ongoing, but variation in the emitting area has not been clearly seen in field qLMXBs with higher statistics (Rutledge et al., 2002b; Campana et al., 2004). Therefore we conclude that the power-law probably varies, and that we do not have strong evidence for variability of the thermal component in this source.
We can also compare X4’s flux in our observations to its flux in ROSAT HRI observations from 1992-1996 (which contain very little spectral information). Verbunt & Hasinger (1998) report 49 counts from X4 (which we confidently identify with our source) in 58820 seconds of exposure. Using a power-law spectral fit to only the 0.5-2.5 keV data (with fixed to the cluster value, cm-2), we find a power-law index of 2.9, with (absorbed) 0.5-2.5 keV X-ray fluxes ranging between to ergs s-1 cm-2 (for different parts of the data, as above). Using this spectrum, the PIMMS tool333Available at http://asc.harvard.edu/toolkit/pimms.jsp gives an absorbed 0.5-2.5 keV X-ray flux of ergs s-1 cm-2 for the ROSAT HRI data. This flux is consistent with the upper end of the range of fluxes observed with .
3. Discussion
The 47 Tuc X-ray sources W37, W17 and X4 are very probably qLMXBs. No other identified source types observed in globular clusters show spectral components consistent with the emission from a 10 km radius hydrogen atmosphere, as observed in these objects. Millisecond pulsars show thermal emission from a much smaller area, and at lower luminosities (Zavlin et al., 2002; Grindlay et al., 2002; Bogdanov et al., 2004). Magnetic CVs show soft, blackbody-like components plus harder emission, but with emission radii that are much larger (generally hundreds of km) than the implied radii (0.5-2 km) from blackbody fits to these sources. We also note that these three objects are the three X-ray brightest objects (excepting X7, another known qLMXB) not yet positively identified in our optical identification program (Edmonds et al., 2003a, b). If W17 were a cataclysmic variable (or, even less likely, an X-ray active binary), its faint upper limit of would produce an unusual X-ray to optical flux ratio, which led Edmonds et al. (2003a) to suggest this object as a possible qLMXB. X4 fell outside the fields of view analyzed by Edmonds et al. (2003a), but its X-ray spectral similarities to W17 are convincing. W37’s error circle showed no blue or variable objects, but two bright main-sequence stars fall within a 2 error circle (not unusual considering its projected location at the center of the cluster), likely obscuring the true (fainter) companion (as for X7, Edmonds et al., 2002). The far-UV imaging observations of Knigge et al. (2002) include W37’s position, and may be able to provide stronger constraints on a possible UV counterpart. We conclude that W37’s varying and eclipses indicate that it is a transiently accreting qLMXB, with marked similarities to X5 (HGL03). We also note that W37 is the second qLMXB without a recorded outburst to have an identified period, after X5, and that its short period implies a very dim low-mass companion.
We can not rule out possibilities other than qLMXBs for W17 and X4. It is possible that W17 and X4 are neutron stars without Roche-lobe filling low-mass companions, accreting from the intracluster medium (Pfahl & Rappaport, 2001) or from the normal stellar winds of low-mass stellar companions in close orbits, in so called pre-LMXB systems (Willems & Kolb, 2003). Either of these is possible, but we judge a stellar wind model to be more likely, because neutron stars that accrete from the intracluster medium must also be able to accrete the higher-density wind from a low-mass star, and because all the (slowly spinning) neutron stars in the cluster should display signals of accretion from the intracluster medium if any do. The low bolometric luminosities from the neutron star surfaces of W17 and X4 indicate a very low level of time-averaged mass transfer in the Brown et al. (1998) model, or enhanced neutrino cooling. Mass transfer from a pre-LMXB by a stellar wind thus seems a reasonable possibility. However, similarly low quiescent luminosities and power-law dominated spectra have recently been found for several transient LMXBs: (0.5-10 keV)= ergs s-1 for SAX J1808.4-3658 in quiescence (Campana et al., 2002), (0.5-10 keV)= ergs s-1 (/8.5 kpc)2 for XTE J2123-058 (Tomsick et al., 2004), and (0.5-10 keV)= ergs s-1(/4.9 kpc)2 for SAX J1810.8-2609 (Jonker et al., 2004b). This suggests that W17 and X4 may be normal qLMXBs. They seem to be generally consistent with the anticorrelation between X-ray luminosity, and the fraction of that luminosity seen in the power-law component, suggested by Jonker et al. (2004a). On the other hand, W37 (like the qLMXB in NGC 6397, Grindlay et al., 2001b), appears to show a smaller power-law component than expected from the anticorrelation of Jonker et al. (2004a).
The faint soft component in W37’s spectrum must be associated with W37, since the position of the source does not change between the brightest and faintest intervals (as would be expected if another X-ray source produced this component). The X-rays might be produced by the rapidly rotating companion star’s corona, as suggested Bildsten & Rutledge (2000) and disproved (Lasota, 2000; Kong et al., 2002) for quiescent black hole systems. We can estimate the coronal saturation luminosity of a companion as , where and are measured in units of the solar luminosity and radius respectively (Fleming et al., 1989). Assuming a companion mass of 0.3 (appropriate for a lower main-sequence star in a 3-hour orbit; see § 2.1), we compute a radius cm, and thus a coronal saturation luminosity ergs s-1, which is significantly less than the ergs s-1 required for the additional component. Scattering of W37’s X-rays in an accretion disk wind might produce a similar spectrum, as observed in the eclipsing CVs OY Car, DQ Her and UX UMa (Naylor et al., 1988; Mukai et al., 2003; Pratt et al., 2004). We are not able to make predictions about the efficiency of scattering in such a wind, but we do not see any outstanding objections to this scenario.
Alternatively, this faint less-absorbed component might be identified with the power-law component observed in many field qLMXBs (e.g., Campana et al., 1998; Rutledge et al., 2001b, a), and in W17 and X4. If this identification is correct, then this component must be generated in an extended environment around the neutron star, and not near the surface. A rough estimate of its size can be estimated by assuming that the place of its generation is large compared to the size of variations in the accretion disk. (This assumes that the variations in observed for the neutron star component are due to material in the accretion disk.) The accretion disk is probably of order cm in radius, for typical masses of the components (1.4 and 0.1 ) and an accretion disk size one-half the orbital separation. Assuming that variations in the accretion disk height may be up to one-tenth the radius of the disk, this suggests that the environment that generates the faint soft component should be larger than cm. This is significantly larger than the light-cylinder radius for neutron stars spinning at millisecond periods. If the X-rays are generated within or at the edge of the magnetosphere, the size of the emitting region implies that a pulsar mechanism is operating, and that the observed X-rays may be a shock from the pulsar wind as suggested by Campana et al. (1998). The physical nature of the additional component to W37’s spectrum cannot be conclusively determined from this small amount of data, but the possibility that we are seeing a pulsar wind in a system with an accretion disk is intriguing.
W17 and X4 indicate that a class of faint qLMXBs dominated by harder nonthermal emission may exist in similar numbers as the class of qLMXBs dominated by thermal emission from the neutron star surface (Heinke et al., 2003b). Additional qLMXBs with quiescent properties similar to SAX J1808.4-3658 hiding among the low-luminosity sources in 47 Tuc cannot be ruled out, since the neutron star atmosphere is not always clearly detectable (Campana et al., 2002). These particular identifications would be difficult with shorter exposures, as have been performed for other globular clusters, due to the burying of their telltale thermal components under a stronger nonthermal component and/or a blanket of absorbing gas, and their significantly lower fluxes. However, it will be worthwhile to look for similar objects in the nearest, best-studied clusters. The numbers of faint qLMXBs with ergs s-1 may be similar to those of the identified qLMXBs. We note that there are few hard qLMXBs among sources with ergs s-1, using the results of detailed X-ray and optical studies of 47 Tuc, NGC 6397, and NGC 6752 (Edmonds et al., 2003a, b; Grindlay et al., 2001b; Pooley et al., 2002), but a significant population below ergs s-1 cannot be ruled out. If we extrapolate from these two faint, nonthermally-dominated qLMXBs to the globular cluster system (using their close encounter frequencies, as in Heinke et al., 2003b, and Poisson statistics), an additional 56 such systems are suggested, added to the 100 qLMXBs already anticipated (Pooley et al., 2003; Heinke et al., 2003b). Study of faint qLMXB systems may shed light on the interior physics of neutron stars, the physics of accretion at low mass transfer rates, and possibly the transition as LMXBs evolve to become millisecond pulsars (Burderi et al., 2002, 2003).
Early estimates of the numbers of millisecond pulsars (10000) and their suggested progenitors, LMXBs (12), in globular clusters indicated (for LMXB lifetimes 1/10 those of millisecond pulsars, 1 and 10 Gyr) a large discrepancy in their respective birthrates (Kulkarni et al., 1990; Hut et al., 1991), thus implying that other formation processes may have created some globular cluster pulsars (Bailyn & Grindlay, 1990). Radio timing surveys of 47 Tuc have identified 22 millisecond pulsars (Camilo et al., 2000; Freire et al., 2001), and X-ray, optical and radio imaging surveys indicate that the total number of millisecond pulsars in 47 Tuc is of order 30 (Heinke et al., 2004; Edmonds et al., 2003b; McConnell et al., 2004; Grindlay et al., 2002). When these constraints are compared with the current number of likely quiescent LMXBs in 47 Tuc (5), the birthrate discrepancy between millisecond pulsars and LMXBs disappears, indicating that LMXBs are probably sufficient to produce the observed millisecond pulsars.
References
- Bailyn & Grindlay (1990) Bailyn, C. D., & Grindlay, J. E. 1990, ApJ, 353, 159
- Bildsten & Rutledge (2000) Bildsten, L., & Rutledge, R. E. 2000, ApJ, 541, 908
- Bogdanov et al. (2004) Bogdanov, S., Grindlay, J. E., Heinke, C. O., Camilo, F., & Becker, W. 2004, ApJ, to be submitted
- Broos et al. (2002) Broos, P., Townsley, L., Getman, K., & Bauer, F. 2002, ACIS Extract, An ACIS Point Source Extraction Package, Pennsylvania State University, http://www.astro.psu.edu/xray/docs/TARA/ae_users_guide.html
- Brown et al. (1998) Brown, E. F., Bildsten, L., & Rutledge, R. E. 1998, ApJ, 504, L95
- Burderi et al. (2002) Burderi, L., D’Antona, F., & Burgay, M. 2002, ApJ, 574, 325
- Burderi et al. (2003) Burderi, L., Di Salvo, T., D’Antona, F., Robba, N. R., & Testa, V. 2003, A&A, 404, L43
- Camilo et al. (2000) Camilo, F., Lorimer, D. R., Freire, P., Lyne, A. G., & Manchester, R. N. 2000, ApJ, 535, 975
- Campana et al. (1998) Campana, S., Colpi, M., Mereghetti, S., Stella, L., & Tavani, M. 1998, A&A Rev., 8, 279
- Campana et al. (2004) Campana, S., Israel, G. L., Stella, L., Gastaldello, F., & Mereghetti, S. 2004, ApJ, 601, 474
- Campana et al. (1997) Campana, S., Mereghetti, S., Stella, L., & Colpi, M. 1997, A&A, 324, 941
- Campana et al. (2002) Campana, S., Stella, L., Gastaldello, F., Mereghetti, S., Colpi, M., Israel, G. L., Burderi, L., Di Salvo, T., & Robba, R. N. 2002, ApJ, 575, L15
- Colpi et al. (2001) Colpi, M., Geppert, U., Page, D., & Possenti, A. 2001, ApJ, 548, L175
- Edmonds et al. (2003a) Edmonds, P. D., Gilliland, R. L., Heinke, C. O., & Grindlay, J. E. 2003a, ApJ, 596, 1177
- Edmonds et al. (2003b) —. 2003b, ApJ, 596, 1197
- Edmonds et al. (2002) Edmonds, P. D., Heinke, C. O., Grindlay, J. E., & Gilliland, R. L. 2002, ApJ, 564, L17
- Fleming et al. (1989) Fleming, T. A., Gioia, I. M., & Maccacaro, T. 1989, ApJ, 340, 1011
- Frank et al. (1992) Frank, J., King, A., & Raine, D. 1992, Accretion Power in Astrophysics (Accretion Power in Astrophysics, ISBN 0521408636, Cambridge University Press, 1992.)
- Freire et al. (2001) Freire, P. C., Camilo, F., Lorimer, D. R., Lyne, A. G., Manchester, R. N., & D’Amico, N. 2001, MNRAS, 326, 901
- Gratton et al. (2003) Gratton, R. G., Bragaglia, A., Carretta, E., & et al. 2003, A&A, 408, 529
- Grindlay et al. (2002) Grindlay, J. E., Camilo, F., Heinke, C. O., Edmonds, P. D., Cohn, H., & Lugger, P. 2002, ApJ, 581, 470
- Grindlay et al. (2001a) Grindlay, J. E., Heinke, C., Edmonds, P. D., & Murray, S. S. 2001a, Science, 292, 2290
- Grindlay et al. (2001b) Grindlay, J. E., Heinke, C. O., Edmonds, P. D., Murray, S. S., & Cool, A. M. 2001b, ApJ, 563, L53
- Heinke et al. (2004) Heinke, C. O., Grindlay, J. E., Edmonds, P. D., Cohn, H. N., Lugger, P. M., Camilo, F., Bogdanov, S., & Freire, P. C. 2004, ApJ, submitted
- Heinke et al. (2003a) Heinke, C. O., Grindlay, J. E., Lloyd, D. A., & Edmonds, P. D. 2003a, ApJ, 588, 452 (HGL03)
- Heinke et al. (2003b) Heinke, C. O., Grindlay, J. E., Lugger, P. M., Cohn, H. N., Edmonds, P. D., Lloyd, D. A., & Cool, A. M. 2003b, ApJ, 598, 501
- Hut et al. (1991) Hut, P., Murphy, B. W., & Verbunt, F. 1991, A&A, 241, 137
- in’t Zand et al. (2001) in’t Zand, J. J. M., van Kerkwijk, M. H., Pooley, D., Verbunt, F., Wijnands, R., & Lewin, W. H. G. 2001, ApJ, 563, L41
- Jonker et al. (2004a) Jonker, P. G., Galloway, D. K., McClintock, J. E., Buxton, M., Garcia, M., & Murray, S. 2004a, MNRAS, 354, 666
- Jonker et al. (2004b) Jonker, P. G., Wijnands, R., & van der Klis, M. 2004b, MNRAS, 349, 94
- Kaluzny & Thompson (2003) Kaluzny, J., & Thompson, I. B. 2003, AJ, 125, 2534
- King & Ritter (1999) King, A. R., & Ritter, H. 1999, MNRAS, 309, 253
- Knigge et al. (2002) Knigge, C., Zurek, D. R., Shara, M. M., & Long, K. S. 2002, ApJ, 579, 752
- Kong et al. (2002) Kong, A. K. H., McClintock, J. E., Garcia, M. R., Murray, S. S., & Barret, D. 2002, ApJ, 570, 277
- Kulkarni et al. (1990) Kulkarni, S. R., Narayan, R., & Romani, R. W. 1990, ApJ, 356, 174
- Lasota (2000) Lasota, J.-P. 2000, A&A, 360, 575
- Lattimer & Prakash (2004) Lattimer, J. M., & Prakash, M. 2004, Science, 304, 536
- Lloyd (2003) Lloyd, D. A. 2003, astro-ph/0303561
- Marshall et al. (2004) Marshall, H. L., Tennant, A., Grant, C. E., Hitchcock, A. P., O’Dell, S. L., & Plucinsky, P. P. 2004, in X-Ray and Gamma-Ray Instrumentation for Astronomy XIII. Edited by Flanagan & Siegmund. SPIE, 5165, 497 (2004).
- McConnell et al. (2004) McConnell, D., Deshpande, A. A., Connors, T., & Ables, J. G. 2004, MNRAS, 348, 1409
- Menou & McClintock (2001) Menou, K., & McClintock, J. E. 2001, ApJ, 557, 304
- Mukai et al. (2003) Mukai, K., Still, M., & Ringwald, F. A. 2003, ApJ, 594, 428
- Naylor et al. (1988) Naylor, T., Bath, G. T., Charles, P. A., Hassal, B. J. M., Sonneborn, G., van der Woerd, H., & van Paradijs, J. 1988, MNRAS, 231, 237
- Orosz & van Kerkwijk (2003) Orosz, J. A., & van Kerkwijk, M. H. 2003, A&A, 397, 237
- Pfahl & Rappaport (2001) Pfahl, E., & Rappaport, S. 2001, ApJ, 550, 172
- Podsiadlowski et al. (2002) Podsiadlowski, P., Rappaport, S., & Pfahl, E. D. 2002, ApJ, 565, 1107
- Pooley et al. (2003) Pooley, D., Lewin, W. H. G., Anderson, S. F., & et al. 2003, ApJ, 591, L131
- Pooley et al. (2002) Pooley, D., Lewin, W. H. G., Verbunt, F., & et al. 2002, ApJ, 573, 184
- Pratt et al. (2004) Pratt, G. W., Mukai, K., Hassall, B. J. M., Naylor, T., & Wood, J. H. 2004, MNRAS, 348, L49
- Press et al. (1992) Press, W. H., Teukolsky, S. A., Vetterling, W. T., & Flannery, B. P. 1992, Numerical recipes in FORTRAN. The art of scientific computing (Cambridge: University Press, —c1992, 2nd ed.)
- Rutledge et al. (2000) Rutledge, R. E., Bildsten, L., Brown, E. F., Pavlov, G. G., & Zavlin, V. E. 2000, ApJ, 529, 985
- Rutledge et al. (2001a) —. 2001a, ApJ, 559, 1054
- Rutledge et al. (2001b) —. 2001b, ApJ, 551, 921
- Rutledge et al. (2002a) —. 2002a, ApJ, 578, 405
- Rutledge et al. (2002b) —. 2002b, ApJ, 577, 346
- Tomsick et al. (2004) Tomsick, J. A., Gelino, D. M., Halpern, J. P., & Kaaret, P. 2004, ApJ, 610, 933
- Verbunt & Hasinger (1998) Verbunt, F., & Hasinger, G. 1998, A&A, 336, 895
- Wijnands (2004) Wijnands, R. 2004, astro-ph/0405089
- Wijnands et al. (2003) Wijnands, R., Heinke, C. O., Pooley, D., & et al. 2003, astro-ph/0310144
- Willems & Kolb (2003) Willems, B., & Kolb, U. 2003, MNRAS, 343, 949
- Yakovlev et al. (2003) Yakovlev, D. G., Levenfish, K. P., & Haensel, P. 2003, A&A, 407, 265
- Zampieri et al. (1995) Zampieri, L., Turolla, R., Zane, S., & Treves, A. 1995, ApJ, 439, 849
- Zavlin et al. (2002) Zavlin, V. E., Pavlov, G. G., Sanwal, D., Manchester, R. N., Trümper, J., Halpern, J. P., & Becker, W. 2002, ApJ, 569, 894


| Seq,OBS_ID | Start Time | Exposure | Aimpoint | Frametime | CCDs |
|---|---|---|---|---|---|
| 300003,078 | 2000 Mar 16 07:18:30 | 3875 | ACIS-I | 0.94 | 1/4 |
| 300028,953 | 2000 Mar 16 08:39:44 | 31421 | ACIS-I | 3.24 | 6 |
| 300029,954 | 2000 Mar 16 18:03:03 | 845 | ACIS-I | 0.54 | 1/8 |
| 300030,955 | 2000 Mar 16 18:33:03 | 31354 | ACIS-I | 3.24 | 6 |
| 300031,956 | 2000 Mar 17 03:56:23 | 4656 | ACIS-I | 0.94 | 1/4 |
| 400215,2735 | 2002 Sep 29 16:59:00 | 65237 | ACIS-S | 3.14 | 5 |
| 400215,3384 | 2002 Sep 30 11:38:22 | 5307 | ACIS-S | 0.84 | 1/4 |
| 400216,2736 | 2002 Sep 30 13:25:32 | 65243 | ACIS-S | 3.14 | 5 |
| 400216,3385 | 2002 Oct 01 08:13:32 | 5307 | ACIS-S | 0.84 | 1/4 |
| 400217,2737 | 2002 Oct 02 18:51:10 | 65243 | ACIS-S | 3.14 | 5 |
| 400217,3386 | 2002 Oct 03 13:38:21 | 5545 | ACIS-S | 0.84 | 1/4 |
| 400218,2738 | 2002 Oct 11 01:42:59 | 68771 | ACIS-S | 3.14 | 5 |
| 400218,3387 | 2002 Oct 11 21:23:12 | 5735 | ACIS-S | 0.84 | 1/4 |
Note. — Times in seconds. Subarrays are indicated by fractional numbers of CCDs.
| Obs | (0.5-10 keV) | kT | R | (0.5-10 keV) | (0.5-10 keV) | /DoF(nhp) | |||
|---|---|---|---|---|---|---|---|---|---|
| ( ergs s-1) | ( cm-2) | (eV) | (km) | ( ergs s-1) | ( ergs s-1) | ( ergs s-1) | |||
| W17, 2000 and 2002 data | |||||||||
| - | 1.28/43(10%) | ||||||||
| W37, 2000 and 2002 data | |||||||||
| - | -a | -a | 26 | 53 | 3.0 | 0.56 | 1.24/57(11%) | ||
| X4, and H-atmosphere fixed, power-law varies | |||||||||
| 2735 high | 3.7 | 2.0 | 7.3 | 9.8 | 1.30/38(11%) | ||||
| 2735 low | 1.3 | - | - | - | - | - | 2.5 | - | |
| Other 2002 | 2.0 | - | - | - | - | - | 4.6 | - | |
| 2000 | 1.3 | - | - | - | - | - | 2.4 | - | |
| X4, and power-law fixed, H-atmosphere varies | |||||||||
| 2735 high | 4.1+2.9-1.7 | 6.6 | 12 | 2.1 | 3.8 | 1.35/38(7%) | |||
| 2735 low | - | 2.0 | 10 | - | - | - | |||
| Other 2002 | - | 2.7 | 7.1 | - | - | - | |||
| 2000 | - | 1.5 | 24 | - | - | - | |||
Note. — Spectral fits to W37, W17 and separate parts of X4 data, using Lloyd (2003) hydrogen-atmosphere neutron star model plus a power-law model. For X4, some parameters are held fixed between observations, while others are allowed to vary. All errors are 90% confidence limits. Distance of 4.85 kpc is assumed. Flux measurements are absorbed (no correction for ), while and are unabsorbed. Neutron star H-atmosphere radius and temperature for assumed grav. redshift of 0.306, implying 10 km, 1.4 NS; this tests for consistency with the standard model.
a These parameters vary among W37’s observations, and are presented in Table 3.
b This parameter reached the hard limit of the model.
| Obs. | Cts | , (0.5-2.5 keV) | Intervals of spectral extractions | |
|---|---|---|---|---|
| ( ergs s-1) | ( cm-2) | ( s) | ||
| 2735,H | 618 | 29.006:43.006, 53.006:66.102 | ||
| 2735,L | 338 | 0:29.006, 43.006:53.006 | ||
| 2736 | 40 | 74.104:140.209 | ||
| 2737,H | 94 | 266.385:278.006, 287.506:289.506 | ||
| 2737,L | 87 | 278.006:287.506, 289.506:332.490 | ||
| 2738,H | 29 | 1038.010:1045.010 | ||
| 2738,L | 71 | 980.879:1038.010, 1045.010:1051.550 | ||
| 2000 | 46 | - |
Note. — Spectral fits to various parts of W37 data, using Lloyd (2003) hydrogen-atmosphere neutron star model and power-law model (as in Table 2), with the only variable parameter. Times are barycentered and should be added to reference time 149706994.3 (seconds after MJD 50814.0). All errors are 90% confidence limits. Distance of 4.85 kpc is assumed.
a This parameter reached the hard limit of the model.