Discovery of a bright X-ray transient in the Galactic Center with XMM-Newton
We report the discovery of a bright X-ray transient object, XMMU J174554.4$-$285456, observed in outburst with XMM-Newton on October 3, 2002, and located at 6.3′ from Sgr A*, the supermassive black hole at the Galactic center. This object exhibits a very large X-ray luminosity variability of a factor of about 1 300 between two X-ray observations separated by four months. The X-ray spectrum is best fitted by a power-law with a photon index of 1.60.2 and absorption column density of 14.11022 cm-2. This large absorption suggests this source is located at the distance of the Galactic center, i.e., 8 kpc. The 2–10 keV luminosity is about erg s-1. A pulsation period of about 172 s is hinted by the timing analysis. The X-ray properties strongly suggest a binary system with either a black hole or a neutron star for the compact object.
Key Words.:
Galaxy: center – X-rays: binaries – X-rays: individuals: XMMU J174554.4-285456(dporquet@mpe.mpg.de)
1 Introduction
The Galactic center region (, ) is very complex in X-rays with both diffuse emission and point-like sources, counterparts of fluorescent molecular clouds, supernova remnants, compact objects, and stellar clusters. In addition to Sgr A*, the supermassive black hole at the Galactic center, this region shelters accreting compact objects, such as neutron stars and black hole candidates (e.g., Churazov et al. Ch97 (1997), Sidoli et al. Si99 (1999), Sakano et al. Sa02 (2002), Porquet et al. 2003a ), which can be transient sources in X-rays. Therefore, repeated X-ray observations of this region, achieved for the monitoring of Sgr A*, give us the opportunity to catch one of these compact objects during an outburst phase, and to shed light on their nature. We report here the serendipitous discovery on October 3, 2002 with XMM-Newton of a bright X-ray transient source located at 6.3′ from Sgr A*.
2 XMM-Newton observation
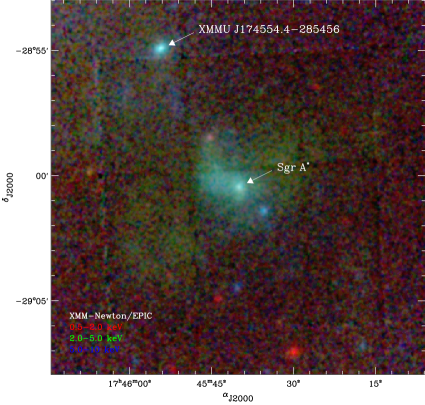
The XMM-Newton observation is the one obtained on October 3, 2002, where a very bright X-ray flare was reported from Sgr A* (Porquet et al. 2003b ). The observation exposure times are 16.8 ks and 13.9 ks for the MOS and PN cameras, respectively. The data were processed with SAS (version 6.0). X-ray events with patterns 0–12 and 0–4 are used for MOS and PN, respectively. We select only events with data quality flag equal to 0. The astrometry is the one reported in Porquet et al. (2003b ). Fig. 1 shows the central part of this observation in the 0.5–10 keV energy range: a new X-ray source, as bright as Sgr A*, is clearly seen at 6.3 from Sgr A*. Its position in J2000 coordinates is =17h45m54.4s, = with a 90 confidence level error position of 2.3′′ in radius. We name this new X-ray source XMMU J174554.4285456. We did not find any known counterpart of this source in the SIMBAD data base. We note that this area was previously observed in X-rays with higher sensitivity both with XMM-Newton (e.g., Sakano et al. Sa04 (2004)) and Chandra (e.g., Muno et al. Mu2003 (2003)), and that this source was not detected. In addition, during the Chandra observation on June 19, 2003, about eight months after the present observation, the source was not detected, hence XMMU J174554.4285456 is a transient X-ray source.

We extract the source events from a circular region of 12′′-radius centered on the X-ray source position, and the background events from a rectangular region free of X-ray sources lying on the same CCD and close to the transient. Photon arrival times were computed for the solar system barycenter. Fig. 2 displays the background subtracted EPIC light curve of XMMU J174554.4285456 in the 2–10 keV energy band, during the time interval when the three cameras were observing together. We do not see any obvious variations of the light curve as type-I burst, or eclipse.
3 Spectral analysis

We use for the spectral analysis only PN data, which have a higher S/N and better energy coverage than the MOS data. The spectrum is binned to a minimum of 20 counts per bin. The fitting parameter errors quoted correspond to 90 confidence ranges for one interesting parameter (=2.71). In the following, we use the updated X-ray absorption cross-sections and abundances of the interstellar medium (ISM) of Wilms et al. (Wi00 (2000)). The PN spectrum, shown in Fig. 3, is strongly absorbed below 2 keV, evidence of a large absorption by the ISM along the line-of-sight. We fit the data taking into account the scattering of X-rays by dust, using the scatter model (Predehl & Schmitt PS95 (1995)) assuming a visual extinction value =30 mag, as determined from IR observations of stars close to Sgr A* (e.g., Rieke et al. Rieke89 (1989)).
| Model | or | ||||||
|---|---|---|---|---|---|---|---|
| 2–10 keV | 0.5–10 keV | ||||||
| po | 14.1 | 1.65 | 0.87 | 1.4 | 1.0 | 2.1 | 1.5 |
| bb | 7.30.9 | 1.90.1 | 1.08 | 1.0 | 0.7 | 1.0 | 0.7 |
| diskbb | 11.01.0 | 3.70.5 | 0.93 | 1.2 | 0.9 | 1.4 | 1.0 |
| brems | 13.61.2 | 22 | 0.88 | 1.3 | 0.9 | 1.8 | 1.3 |
The PN spectrum is well fitted by the standard absorbed continuum models, such as power-law, black-body, multi black body, and bremsstrahlung (Table 1). However, the temperatures found for the latter three models are rather high, and the spectrum is not well fitted above 10 keV by the black-body and the multi black body models. According to Predehl & Schmitt (PS95 (1995)), =30 mag corresponds to an hydrogen column density of about cm-2 towards the Galactic center located at about 8 kpc. The updated ISM abundance used here lead to absorption column density values about 30 larger than those derived assuming solar abundance as in Predehl & Schmitt (PS95 (1995)). For comparison we found for Sgr A* (during its X-ray flare) a column density of about 201022 cm-2 (Porquet et al. 2003b ).
 |
 |
Therefore, the hydrogen column density estimated here for the absorbed power law model is consistent with a location of this transient object at the distance of the Galactic center. We also test a thin thermal model mekal but in case of solar metal abundance, we obtain an unphysically high temperature greater than 50 keV. If the metal abundance is let as a free parameter, the temperature is lower with keV, and the upper limit of the metal abundance is about 0.3, due mainly to the lack of obvious spectral emission lines. Therefore the power-law model is our best fit. We obtain an upper limit of the equivalent widths for a narrow iron K line (=10 eV) between 6.4 (“neutral”) and 7 keV (H-like) of 30–86 eV. To look for a possible time variability of the spectrum, we split the observation into two parts, but we find no statistically significant variations of the photon index, the absorption column and the 2–10 keV flux.
4 Period analysis
We have searched the combined EPIC data with a time bin of 2.6 s for X-ray pulsations in the 2–10 keV range. The FFT power density spectrum shows a peak at 5.850.07 mHz or 1712 s (Fig. 4 left). The probability that the peak at this frequency is produced by just white photon noise is 2 has been found by Monte Carlo simulations. To cope with the possibility that the signal is not constant with just random fluctuations, we assessed the false alarm probability making use of the periodogram analysis (Lomb L76 (1976), Scargle’s S82 (1982)) in the form suggested by Andronov (A94 (1994)): , where is the 2.6 s-binned signal at time , is phase-averaged mean value, is the semi-amplitude, is the trial period, and is an initial epoch. The MOS1, MOS2 and PN data as well as their sum have been analysed separately, and a candidate period at P = 171.570.25 s has been found consistent with the period found by the FFT analysis. The candidate period has a signal to noise ratio (S/N) of 2.9 (MOS1), 3.3 (MOS2), 6.0 (PN) and 9.7 (total). The S/N ratio is defined as the ratio of the count rate obtained for the candidate frequency divided by the count rate averaged over the full frequency band. Monte Carlo simulations were done for 50 000 evenly spaced trial frequencies ranging from 10-5 s-1 up to the Nyquist frequency of 1/2 s-1, and resulted in a false alarm probability of 0.37 for 7638 independent frequencies. We have also exercised a test on the phase relation among the three instruments by comparing the fitted values for T0, which are =767811 s, =768211 s, and 76658 s. The largest phase shift is 0.100.08 which suggests that there is no significant shift. In the context of this approach, we have estimated a false alarm probability, defined as the probability to get by chance the observed phase “coincidence”, by computing 108 trial data sets with uniformly distributed phases. For each trial set, a weighted mean and variance is computed using the previous measured instrumental uncertainties. The simulated variance of the phases exceeds the measured variance in 3.4 of all trials. In summary the false alarm probability for the suggested period is somewhere between 2 and 3.4 ignoring any modulation of the signal and could be around 37 otherwise. Finally, we give the best fit parameters of the signal function for the data of the three instruments combined: s (corresponding to mjd=2550.80667, i.e. October 3, 2002 at 7:21:36.0). The peak-to-peak amplitude of the periodic variations is , which is the same for all three instruments within the error estimates. Fig. 4 (right) shows the light curve folded with this period. We have extracted phase resolved spectra selecting data corresponding to peak (phase=0.2–0.6), and to trough (phase=0.6–1.2), and we found no significant spectral differences.
5 The nature of XMMU J174554.4285456
We estimate the amplitude of the luminosity outburst from the deepest
Chandra observation of Sgr A*, 167 ks of exposure obtained on
May 25, 2002, i.e. four months before our XMM-Newton observation.
We found a 3- count rate upper limit of 1.2 10-4 count s-1 at the location of XMMU J174554.4285456 in the 0.5–10 keV energy band.
Assuming =1.6 (see Table 1),
we find (0.5–10 keV) erg s-1 during the quiescent state.
Therefore, this source has exhibited a luminosity increase of a factor of
about 1 300
over four months. In addition the source was not detected eight months
after the present XMM-Newton observation by Chandra during a
short exposure (25 ks) obtained on June 19, 2003
leading to a 3- 0.5–10 keV count rate upper limit of 3.7
10-4 count s-1 at the location of XMMU J174554.4285456,
corresponding to (0.5–10 keV) erg s-1.
Then XMMU J174554.4285456 is a transient source detected here, for the first time, during an outburst
on October 3, 2002, ruling out for example the outburst of a supernova.
Such very rapid luminosity decrease is not compatible with a tidal
disruption of a star as observed in some non active galaxies (e.g., Halpern et al. HGK04 (2004)).
The X-ray properties suggests an X-ray binary nature, involving a
compact object which could be either a white dwarf, or a neutron star, or a
black hole.
The typical outburst luminosity of white dwarf system
is only up to about 1034 erg s-1 (e.g., GK Per, Sen & Osborne SO98 (1998)),
implying a distance upper limit of about 2.5 kpc, and the bulk of the observed
hydrogen column density would be for instance intrinsic, produced by the accreting material.
However, here the amplitude between the outburst phase and the quiescent phase is
much larger than the one observed in cataclysmic variables. For example, GK Per,
which has the most similar X-ray properties
(e.g., , kTbrems, period pulsation), has only an amplitude of
about 10 (Hellier et al. H04 (2004)), and a significant Fe K line is seen
during outburst with an equivalent width of 16020 eV typical for cataclysmic variables
(see Ezuka & Ishida EI99 (1999)).
Therefore, a cataclysmic variable origin is very unlikely for XMMU J174554.4285456.
The companion of the neutron star or of the black hole
can be either a low mass object or a high-mass object.
A subclass of low mass X-ray binaries are transient systems, called X-ray novae,
which undergo sometimes outbursts.
For most of the time, X-ray novae are in quiescent state,
where the mass accretion rate from the disk to the compact object is very small,
producing a low-level of X-ray emission.
The quiescent 0.5–10 keV X-ray luminosities of neutron star X-ray novae are about
1032–1034 erg s-1, i.e., 100 times higher than those for black
hole X-ray novae (1030–1033 erg s-1),
as shown by Garcia et al. (G01 (2001)).
Here we find an upper limit of the luminosity in the quiescent state of
1.2 10 erg s-1, i.e., compatible with
a black hole X-ray nova or a neutron star X-ray nova.
The lower limit amplitude between the outburst phase and the quiescent phase is
consistent with both a neutron star and a black hole (Chen et al. C97 (1997)).
Therefore XMMU J174554.4285456 can be either a neutron star X-ray nova or a black hole X-ray nova.
XMMU J174554.4285456 can also be a high mass X-ray binary formed by a neutron star or a black hole
and a primary Be star companion.
Indeed, as reported by Liu et al. (Liu00 (2000)),
most of the transient high mass X-ray binaries are Be star systems.
Roughly two-third of a sample of 130 high mass X-ray binaries are Be/X-ray binaries,
and X-ray pulsations have been found in about 60 Be/X-ray binary systems
(Ziólkowski Z02 (2002)).
We conclude that a higher X-ray observation of XMMU J174554.4285456 during its outburst phase is needed to confirm or reject the candidate X-ray pulsation at 172 s suggested by our timing analysis. If confirmed, we will be able to firmly identify the compact object as a neutron star. Moreover near-infrared follow-up observations are needed to identify and to characterize the companion star.
Acknowledgements.
This work is based on observations obtained with XMM-Newton, an ESA science mission with instruments and contributions directly funded by ESA Member States and the USA (NASA). D.P. is supported by a MPE fellowship.References
- (1)
- (2) Andronov I.L. 1994, Odessa Astron. Publ., 7, 49, http://il-a.pochta.ru/oap7049.ps
- (3) Chen W., Shrader C.R., Livio M., 1997, ApJ, 491, 312
- (4) Churazov, E., Gilfanov, M., Sunyaev, R., et al. 1997, Advances in Space Research, 19, 55
- (5) Ezuka H., Ishida M., 1999, ApJS, 120, 277
- (6) Garcia M.R., McClintock J.E., Narayan R. et al. 2001, ApJ, 553, L47
- (7) Halpern, J.P., Gezari, S., & Komossa, S. 2004, ApJ, 604, 572
- (8) Hellier C., Harmer S., Beardmore A.P., 2004, MNRAS, 349, 710
- (9) Liu, Q.Z., van Paradijs, J., & van den Heuvel, E.P.J. 2000, A&AS, 147, 25
- (10) Lomb N.R., 1976, Astrophys.Space Sci., 39, 447
- (11) Mitsuda, K., Inoue, H., Koyama, K. et al. 1984, PASJ, 36, 741
- (12) Muno, M. P., Baganoff, F.K., Bautz, M.W. 2003, ApJ, 589, 225
- (13) Porquet, D., Rodriguez, J., Corbel, S. et al. 2003a, A&A, 406, 299
- (14) Porquet, D., Predehl, P., Aschenbach B. et al. 2003b, A&A, 407, L17
- (15) Predehl, P. & Schmitt, J.H.M.M. 1995, A&A, 293, 889
- (16) Rieke, G.H., Rieke, M.J. & Paul, A.E. 1989, ApJ, 336, 752
- (17) Sakano, M., Koyama, K., Murakami, H. et al. 2002, ApJS, 138, 19
- (18) Sakano, M., Warwick, R.S., Hands, A., Decourchelle, A. 2004, MmSAI, 75, 498
- (19) Scargle J.D. 1982, ApJ, 263, 835
- (20) Sen C. & Osborne J.P., 1998, ASP Conf. Series, Vol. 137, 463
- (21) Sidoli, L., Mereghetti, S., Israel, G.L. et al. 1999, ApJ, 525, 215
- (22) Wilms, J., Allen, A., McCray, R., 2000, ApJ, 542, 914
- (23) Ziólkowski J., 2002, Mem. Soc. Astron. Ital., 73, 1038