Stars in the Hubble Ultra Deep Field
Abstract
We identified 46 unresolved source candidates in the Hubble Ultra Deep Field, down to . Unresolved objects were identified using a parameter , which measures the deviation from the curve-of-growth of a point source. Extensive testing of this parameter was carried out, including the effects of decreasing signal-to-noise and of the apparent motions of stars, which demonstrated that stars brighter than could be robustly identified. Low resolution grism spectra of the 28 objects brighter than identify 18 M and later stellar type dwarfs, 2 candidate L-dwarfs, 2 QSOs, and 4 white dwarfs. Using the observed population of dwarfs with spectral type M4 or later, we derive a Galactic disk scale height of for M and L stars. The local white dwarf density is computed to be as high as . Based on observations taken 73 days apart, we determined that no object in the field has a proper motion larger than 0.027”/year ( detection limit). No high velocity white dwarfs were identified in the HUDF, and all four candidates appear more likely to be part of the Galactic thick disk. The lack of detected halo white dwarfs implies that, if the dark matter halo is 12 Gyr old, white dwarfs account for less than 10% of the dark matter halo mass.
1 Introduction
Studying the stellar content of our galaxy down to the faintest possible magnitudes is necessary to study the structures of the Galactic disk and population II halo (referred to as Galactic halo thereafter) and stellar population (Méndez et al., 1996). The nature of the Galactic dark matter halo has in addition been the subject of some debate since the MACHO project (Alcock et al., 2000) observed lensing events in the direction of the Large Magellanic Cloud (LMC) and claimed that 20% of the dark matter halo mass could be in the form of low mass objects with masses smaller than (Alcock et al., 2000). While there are alternative explanations for the observed lensing events (Sahu, 1994, 2003; Gates & Gyuk, 2001, and references therein), the detection of faint, blue unresolved objects with high proper motion has been used as evidence for the existence of a large population of old white dwarfs in the Galactic dark matter halo. Oppenheimer et al. (2001) estimated that about 2% of the dark matter halo mass could be accounted for by old halo white dwarfs. There has since been some debate as to whether the former result might have been caused by a dynamically warmer thick disk component (Reid, Sahu & Hawley, 2001) and the latter might have been affected by the misidentification of faint blue extra-galactic sources (Kilic et al. (2004), also see Reid (2004) for a complete review).
The existence of ultra cool white dwarfs () has however been confirmed in recent SLOAN data (Gates et al., 2004).
A search for distant white dwarfs using deeper observations provides another opportunity to firmly examine the existence of a significant population of old white dwarfs in the Galactic halo and the dark matter halo. As shown by Kawaler (1996), deep broad band imaging can probe a significant portion of the Galactic dark matter halo and should identify Galactic dark halo white dwarfs in the process.
Ideally, one would like to identify white dwarf candidates spectroscopically, instead of relying on broadband colors only, and to determine their Galactic disk or halo memberships using sensitive proper motion measurements.
The Advanced Camera for Survey (ACS) HST observations of the Hubble Ultra Deep Field (HUDF, Beckwith et al., 2004) and their unprecedented depths offer a new opportunity to detect faint stars, such as white dwarfs, at high galactic latitude. Additionally, the GRAPES survey (GRism ACS Program for Extragalactic Science. PI: Malhotra, see description in Pirzkal et al., 2004) provides low resolution spectra of most sources in the HUDF. These spectra can be used to confidently determine spectral types of stars in the HUDF, down to mag. More importantly, these spectra allow one to differentiate unresolved, blue, faint extra-galactic objects (e.g. QSO) from white dwarfs and other stars.
Section 3 outlines how unresolved sources were identified in the HUDF, while the spectroscopic identification of unresolved sources is discussed in Section 4. Section 5 describes an analysis of the cumulative number distribution of the late-type dwarfs identified in the HUDF and its implication for the Galactic disk structure (Section 5.1). Section 5 also includes a description of the white dwarf content of the Galactic disk and halo (Section 5.2).
2 Description of the data
The HUDF was imaged using the ACS and the F435W (), F606W (), F775W () and F850LP () bands at different epochs. The observations were carried out by cycling through each filter while using a small dither pattern to mask out the ACS inter-chip gap and other cosmetic problems.
The HUDF was observed during 4 different visits, rotating the field of view to a different position angle each time (0°, 8°, 85°, 91° with respect to the first visit, Beckwith et al., 2004).
The individual ACS images had an integration time of 1200 seconds, a size of 4096x4096 pixels and a pixel scale of 0.050”/pixel. These images were combined together by drizzling them onto a finer pixel grid with a pixel scale of 0.030”/pixel, while geometrically correcting these images. The limiting AB magnitudes (S/N=10) of the and images are 29.0 and 28.7 mag, respectively.
In this paper, images taken from 09/24/2003 to 10/28/2003 and from 12/04/2003 to 01/15/2004 are referred to as Epoch 1 and 2 images, respectively. The elapsed time between the mean observing dates of the two epochs is 73 days. Images from Epoch 1 and Epoch 2 were taken at position angles that are nearly 90° apart.
While the deep, combined ACS HUDF images described above were used to determine which objects are unresolved (Section 3), eight special partial image stacks were also assembled to take advantage of the fact that the data were taken over a period of several months. Four partial image stacks were created for each HUDF Epoch, using the exact same method used to create the original combined HUDF images. These partial image stacks can be used to determine the variability (Cohen et al., 2004) as well as measure the proper and parallax motions of the objects in the field. The eight partial image stacks have the same physical properties as the combined ACS HUDF images but with one eighth of the integration time. Note that the cosmic ray rejection step was done separately while assembling each partial image stack so that any strongly varying or moving object would not be removed by the cosmic ray rejection process.
The astrometric registration of the combined HUDF images and the eight partial image stacks is estimated to be better than 0.1 ACS pixel (0.005” or 0.16 HUDF image pixel) (Beckwith et al., 2004).
Spectroscopic observations of the UDF using the ACS slitless grism mode (G800L) were carried out as part of the GRAPES project. The reader is referred to Pirzkal et al. (2004) for an in-depth description of these spectra. These spectra are low resolution spectra (R=100), span a wavelength range of , and can be used to spectroscopically identify objects in the field.
The HUDF Public Catalog 1.0, containing 10181 objects, was used to identify objects in the field and all objects are referred to by their ID in this catalog (UID). The magnitudes of these objects were re-measured using matched aperture photometry with apertures defined using Sextractor (Bertin & Arnouts, 1996) and the band HUDF image. The photometric ACS magnitude zero-points (25.65288, 26.49341, 25.64053, 24.84315 in the , , , bands respectively) were taken from the GOODS survey (Giavalisco et al., 2004) .
3 Identification of point sources in the HUDF
We identified unresolved objects in the HUDF using a single-index () method that is based on a simple analysis of the curve of growth of the light distribution of an object. The IRAF task RADPROF was used to produce these light curves of growth. This task first computes the intensity weighted center of the object (in a 3x3 pixel box), and then performs aperture photometry using increasing aperture sizes (up to a radius of 10 pixels). These photometric measurements are then fit (using eight 3 rejection cycles) to a cubic spline of order 5. RADPROF was applied to stamp images of objects which were masked using Sextractor segmentation maps. These segmentation maps were used to avoid contamination from neighboring objects. The RADPROF parameters described here were selected because, following extensive initial testing, they were found to result in curves of growth that are not too sensitive to the presence of faint nearby objects while consistently remaining sensitive to the presence of faint, diffuse extended emission around objects. The stellarity of an object is defined as
where and denote the curve of growth of light, normalized to 1.0 at a distance of , of the object and of a point source. A value of 10. was used for .
The index is then simply the square root of the sum of the squared differences between the two curves. Unresolved objects have values that are close to 0.0 while increasingly resolved objects produce increasingly larger (unbound) values of . The detailed calibration of was done in several stages, each time refining the reference curve of growth that was used. This is described in some detail below.
First, a few obvious, bright, unresolved and unsaturated sources were pre-selected for further study. This was done in both the and band images separately. The GRAPES spectra of these sources were examined and a main-sequence star was selected (UID 911). The curves of growth of this object were measured separately in the and bands and were used to compute and values for all 10181 objects in the HUDF.
A new set of 25 bright point sources, well distributed over the whole ACS field, were then carefully selected based on their low values (arbitrarily chosen to be ). The GRAPES spectra of these 25 objects were visually inspected to ensure that these objects were stars. Stamp images of these objects were individually drizzled (Fruchter & Hook, 2002) and carefully re-centered to produce a stack of images which were then combined together to produce empirical and PSF images. A sigma-based rejection algorithm was used to avoid the effect of any faint neighbor in the final combined images.
Final and band reference curves of growth were generated using these empirical PSF estimates and all of the and values were re-computed. Figure 1 shows the distributions of the values in both the and bands, as a function of magnitude. There are clearly two distinct groups of object in the HUDF images: one group consists of object that are completely or partially resolved, forming a large distribution around the value of 0.2 and mag. A second group consists of unresolved objects with low values at all magnitudes. Bright stars in Figure 1 are observed to have values which are consistently lower than 0.05. The exception to this are bright stars near mag. which are saturated and have artificially high values of () . The effect of bright star saturation on the measured values of were investigated and values of are expected if the center of a star is saturated or missing in the HUDF images. Nevertheless, the populations of resolved and unresolved objects appear to be well separated at brighter magnitudes in Figure 1.
Unresolved sources in the HUDF were selected using the criterion that mag. Four bright saturated stars were added to the final object list manually. The final list of unresolved UDF sources contains 46 objects, spanning the magnitude ranges of mag and mag. Table 1 summarizes some of the properties of these objects.
3.1 Testing the selection process
The ability to distinguish between resolved and unresolved objects using values was extensively tested, using a subset of the HUDF object catalog containing the 369 brightest ( mag) objects in the field. Simulated and band images of these objects — made 0.0, 0.75, 2.0, 3.0, 4.0, 5.0, 6.0, 7.0, 8.0, and 9.0 magnitudes fainter — were created and values measured using each simulated image, exactly as described in Section 3. The value of each of these 369 test objects was thus measured 10 times, each measurement corresponding to a different apparent magnitude. Figure 2 shows how the value remains largely unchanged as an object is made fainter and noisier, all the way down to mag. The vertical pattern seen in this figure is a result of the 10 magnitude steps used in this simulation. This test demonstrates a very small fraction of misclassification: not a single extended object was misclassified as a star (e.g. no object with originally in the HUDF images was measured to have as the object was made fainter), and fewer than 5% of stars were misclassified down to mag. While some objects shown in Table 1 are fainter than this, only objects significantly brighter than this limit ( mag) are actually included in the analysis described below and these are expected to be bona fide unresolved objects.
3.2 Testing the effect of proper motion
Some of the stars in the HUDF objects could have a high tangential-velocity () and a correspondingly large proper motion. Such objects would be blurred in the combined HUDF images and would appear to be resolved. Similarly, nearby objects would suffer from a significant amount of parallax, again causing these objects to be blurred and mis-identified. The index proved relatively insensitive to a small amount of object motion. This is not unexpected since was tuned to the detection of faint extended components, The curves of growth produced by RADPROF were computed by summing, using several sigma rejection steps, the pixel intensities inside annuli of increasing radii. The effect of a nearby source is strongly diminished as its separation from the main source increases and the number of unaffected pixels increases. In addition, the use of a fifth order spline imposes some smoothness on the curve of growth which further lowers the effect of a nearby object. Still, the effect of object motion on measured values of was carefully investigated by generating images of the 46 unresolved HUDF objects that were selected as described in Section 3. These were appropriately shift-and-added, accounting for the orientation and pointing used for each individual HUDF observation while allowing objects to move as a function of time, to simulate the effect of proper motion. As larger values of proper motion were introduced, the values increased only slightly and was found to be mostly unaffected by shifts smaller than 2.5 HUDF pixel (). 70% of objects were still properly identified as point sources when shifts 2.5 and 5.0 HUDF pixels were applied ().
4 Identifying stars
4.1 Using Grism spectra to identify stars
The spectral type of 28 unresolved objects brighter than could be determined robustly using template fitting of their GRAPES spectra (Pirzkal et al., 2004). The template set included Pickles (1998) main-sequence templates, L and T dwarf spectra (Kirkpatrick et al., 2000; Burgasser et al., 2003), DA and DB white dwarf spectra (Harris et al., 2003) obtained from the SDSS archive, and some low temperature (3000°K, 5000°K, and 8000°K) model spectra of white dwarfs (Harris et al., 2001). The quality of each spectral fit was evaluated visually and the results of these fits are given in Table 2. Objects too faint to have reliable fits are indicated. The GRAPES spectra and the two best-fits listed in Table 2 are shown in Figures 3, 4, and 5. Unresolved extra-galactic sources are labelled as GAL in Table 2 and are discussed in more details in Section 4.3.
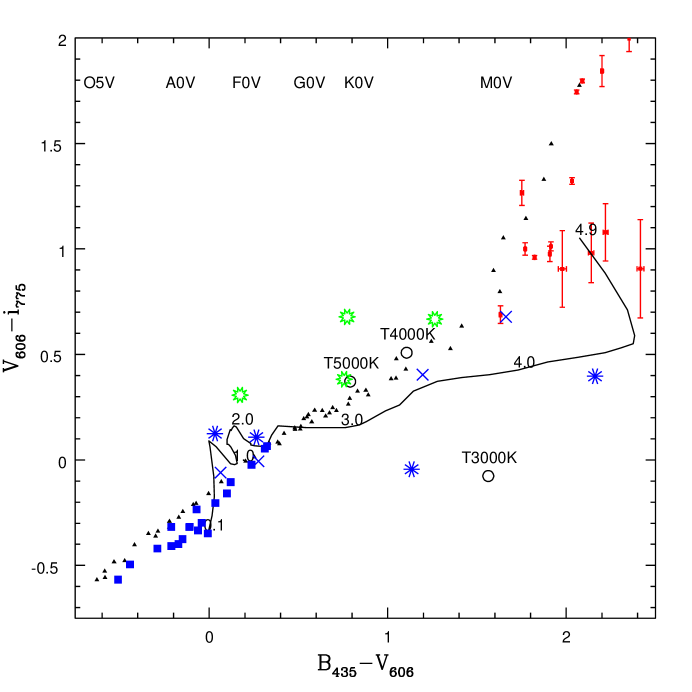
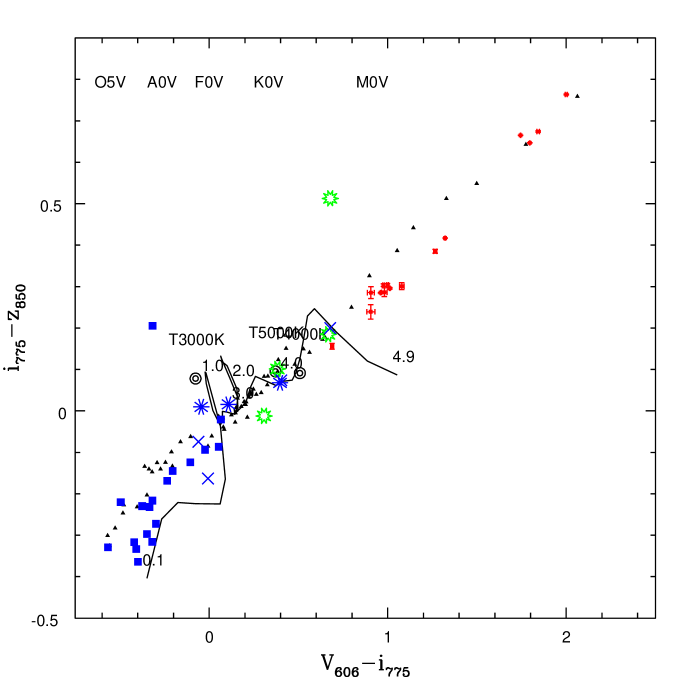
Of the 46 point sources detected in the HUDF, 26 stars, all brighter than mag were identified. As shown in Table 2, the majority of stars in the HUDF (18 out of 26 ) are found to be M dwarfs. Figures 6 and 7 show these objects in vs. - and vs. - plots. Such plots have in the past shown a lack of faint red objects in the region mag and (Méndez et al., 1996). Objects found in this region of the plot, appear to be either extra-galactic or L-type dwarf spectra (UID 443, 366). Further NIR observations will be required to verify the nature of these 2 L-dwarf candidates by confirming that they both have the expected blue NIR colors of this type of object.
The HUDF field is at high galactic latitude (b=223°, l=–54°) and the effects of extinction and reddening are small (, Schlegel et al., 1998). The distances to the HUDF stars, which are shown in Table 2, were determined using their observed magnitudes, their estimated stellar types, and the dwarf star main-sequence absolute Johnson V magnitudes from Allen (2000). The latter were converted to the filter bandpass and AB magnitudes to be consistent with the data at hand. Distance estimates obtained under the assumption that these objects are white dwarfs with intrinsic magnitudes of are also given.
4.2 Proper motion measurements
The Galactic halo is isotropic and has no or little overall rotation. Halo objects are therefore expected to lag behind the rapidly rotating Galactic disk component (and the local standard of rest) with an average velocity of . As done in Oppenheimer et al. (2001), it is assumed here that Galactic halo objects have a velocity that is more than above the velocity expected for an object that is in the Galactic disk (i.e. Chiba et al., 2000).
The HUDF image stacks (Section 2) were subtracted from one another and the results were examined to see if any object, whether classified to be extended or not based on its value, had moved significantly (e.g. more than 2.5 UDF pixel) from one image to the next. No such object was found.
The motion of objects in the HUDF was further investigated by carefully measuring the position of objects separately in each of the eight available band HUDF partial image stacks. These positions were measured using the IDL task MPFIT2DPEAK 111http://astrog.physics.wisc.edu/~craigm/idl/, using a fixed width (FWHM=2.5 pixel) Gaussian fit.
Initially, the positions of the 360 most compact sources ( and mag) were examined. An average position and a standard deviation of the mean were computed for each object in the field using Epoch 1 and Epoch 2 HUDF image stacks separately. Average Epoch 1 and Epoch 2 positions were subtracted from one another to compute the observed shift of each object. These are shown (scaled up by a factor of 500) in the left panel of Figure 8. Repeated measurements of the position of sources in the field using HUDF image stacks taken within the same Epoch were always within 0.1 HUDF pixel, or 0.003”. Still, and as shown in Figure 8, there is a systematic, field dependent disagreement between the Epoch 1 and Epoch 2 measurements. This is likely caused by Epoch 1 and Epoch 2 images having been taken at position angles that are 90° apart, and/or the effect of telescope breathing, and/or very small amount of residual image distortion that is not taken into account in the current model of the ACS distortion maps. To produce a detection with these data, an object must have a measured proper motion larger than 0.54 HUDF pixel or . No object in Table 1 was observed to have such a large proper motion.
The situation was however improved using a simple third order two dimensional polynomial fit to the observed distribution shown in the left panel of Figure 8. This fit, when applied as a correction, results in significantly lower systematics across the field, as shown in the right panel of Figure 8. The accuracy of the corrected shifts (of compact objects) between Epoch 1 and Epoch 2 is improved by a factor of 3, with a detection now corresponding to a shift of 0.18 HUDF pixel or .
The search for high proper motion objects in the HUDF was extended to all 10181 objects in the field by measuring and correcting (using the correction determined above) the observed shifts of these objects. Only four sources were found to have moved significantly (but with a significance slightly lower than ) from Epoch 1 to Epoch 2. These objects are UID 443, 9020, 911, and 7525 and they are all unresolved objects that are listed in Table 1. Their measured shifts are 0.17, 0.17, 0.14, and 0.15 HUDF pixels respectively, or approximately 0.02”/year, which is smaller than our imposed limit.
4.3 Extragalactic Unresolved Sources
Two unresolved, extra-galactic sources with were identified (UID 6732, 9397). The GRAPES spectrum of these objects show prominent emission lines and the redshift of these objects is estimated to be z=3.2 and z=3.0, respectively (Xu, 2004). Identification of such objects using GRAPES spectra could easily be carried out down to magnitudes fainter than =27.0 mag, as demonstrated by the fact that several fainter extragalactic objects with were easily identified (e.g. UID 4120, 8157). Without spectral information, these objects would have been misidentified as stars (e.g. UID 9397 would be a good candidate for a cool white dwarf at a distance of 1 Kpc). The issue of contamination by faint, blue extra-galactic objects in previous studies (Ibata et al., 1999; Méndez & Minniti, 2000) has been discussed in the past (Kilic et al., 2004) and Figures 6 and 7 illustrate how these objects could be mistaken for a variety of stellar objects ranging from M and L dwarfs to white dwarfs. Spectroscopic confirmation is therefore crucial to accurately determine stellar counts in deep fields such as the HUDF.
There are 2 extra-galactic objects amongst the 28 point sources with mag, which corresponds to a 7% contamination level at these Galactic coordinates.
The 2 extra-galactic objects (UID 6732, 9397) were used to check the accuracy of the proper motion measurements described in Section 3.2. The measured shifts of these objects between Epoch 1 and Epoch 2 are smaller than 0.04 HUDF pixel (0.0012”), which is what one would expect based on the proper motion error estimate quoted in Section 3.2).
There are a total of 14 faint (), blue (, ) objects listed in Table 1 that were not included in the analysis above because they are either too faint to have useable GRAPES spectra or robust based classifications. Some of these sources might well be faint white dwarfs in either the Galactic disk or halo but are hard to distinguish from extra-galactic sources without higher signal-to-noise spectra or more accurate proper motion measurements.
5 Discussion
5.1 M and L Dwarfs and the Galactic disk scale height
18 objects were identified to be M (or early L) dwarf main-sequence stars. Two objects were found to be best fit by early L dwarf templates (Kirkpatrick et al., 2000). Both of these objects are red enough to be outside of the color range shown in Figures 9 and 10 with and . Deep infrared observations of these two objects will be required to confirm that they are L dwarfs. NICMOS observations of the HUDF did not detect these objects in either the J or H bands. All other very red objects are best fit using M dwarf templates. The broad spectral features of M dwarfs listed in Table 2 were well fitted using M dwarf Pickles (1998) templates, and for objects brighter than mag we believe the identification to be secure.
Because these late-type sources can be seen to great distances, they can be used to probe the structure of the Galactic disk and halo as traced by the lowest-mass stellar components of these populations. This was explored using Monte Carlo mass function (MF) simulations based on those developed by Burgasser et al. (2004). Assuming power-law representations of the MF, dN/dM M-α, for masses 0.005 to 0.2 M☉, luminosity (LF) and effective temperature (Teff) distributions were created using evolutionary models from Burrows et al. (1997) over the range 100 Teff 4000 K. For all simulations, was fixed at 1.13 for (Reid et al., 1999) but allowed to vary between 0.5–1.5 for ; number densities are normalized to the empirical value at 0.1 M☉ from the 8 pc sample (Reid et al., 1999).
Two separate populations were simulated: a disk population with a flat age distribution spanning 10 Myr to 10 Gyr (the majority of sources have age greater than 1 Gyr), and a halo population with uniformly sampled ages between 9-10 Gyr and a relative number density of 0.25% (Digby et al., 2003). The resulting bolometric LFs were converted to (Cousins) LF’s using a polynomial fit to empirical data (spanning ; i.e., M4 to T8) from Dahn et al. (2002) and Golimowski et al. (2004). Note that this fit is based on measurements for Solar metallicity field dwarfs, and may not be appropriate for a subsolar metallicity halo subdwarf population. Apparent -band distributions were determined by first assuming a constant density population out to a limiting magnitude mI = 27.5 (taking into account the difference between HUDF AB-magnitudes and Vega magnitudes from the empirical data) and then applying a correction for the vertical distribution of sources. For the disk population, we assumed a density distribution (Reid & Hawley, 2000), where , is the source distance, is the Galactic latitude of the HUDF, and is the 1/e disk scale height, assumed to range between 200 and 500 pc. For the halo population, a Galactocentric oblate spheroid distribution as given in Digby et al. (2003) was assumed, using the values derived there and an axial ratio q = c/a = 0.7.
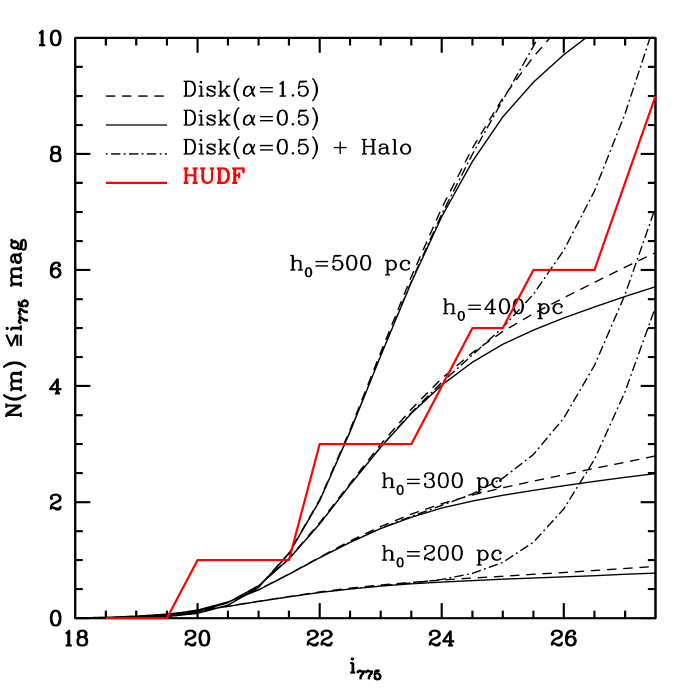
Figure 11 presents the results of these simulations in the form of cumulative number distributions as a function of magnitude down to the limiting magnitude of our sample. These distributions show that variations in the disk scale height are far more pronounced than those from the different MF’s assumed, and this analysis is limited to the former parameter. The cumulative distribution of the six dwarfs in Table 2 with spectral types M4 and later (consistent with the mass constraints of the simulations) is also shown. The observed distribution matches that of the disk simulation very well, particularly out to mag where the halo population makes negligible contribution. Because the simulated distributions are rather sensitive to the disk scale height, particularly at fainter apparent magnitudes, one can conservatively constrain to 100 pc assuming Poisson uncertainties. This is in good agreement with the estimate of from Ryan et al. (2004) which was computed using ACS HUDF parallel fields i-drops. For mag, the observed distribution is slightly greater than the disk population alone but does not increase as sharply as the combined disk+halo distribution. Indeed, the shape of the observed number distribution implies few if any halo stars in the HUDF down to mag, consistent with the lack of significant proper motion sources in this sample. This suggests that either the number density ratio of halo to disk stars, or the adopted axial ratio for the halo density distribution, or both, may be smaller than assumed here. With no late-type halo subdwarf detections in this sample, we cannot usefully constrain these possibilities.
5.2 White Dwarfs
5.2.1 White Dwarf candidates
Objects brighter than were individually examined and distances were estimated under various assumptions of what the exact nature of each object might be: (1) a main sequence star; (2) a young white dwarf; (3) an old white dwarf. The reddest objects, which are all well-fitted by M-and-later type templates, as well as the few extra-galactic objects identified in Section 4.3 were excluded from this analysis. The remaining 8 objects were all initially considered to potentially be white dwarfs.
Assuming that an object is a white dwarf, one can use the measured color of that object (Table 1) and the cooling curves of Richer et al. (2000) (after accounting for passbands and zeropoints differences), to derive an absolute band magnitude, an age, and a distance to that object. As shown in figure 2 of Richer et al. (2000), blue white dwarfs can either be young, hot objects (, T K, mag) or older, cooler, intrinsically dimmer ones (Age 10 Gyr, T , mag). This results in several white dwarf distance estimates for each object.
Proceeding via a process of elimination, the distinction between main sequence stars, young white dwarfs, old white dwarfs, and disk or halo white dwarfs is possible. Assuming that a star is a main sequence star, which is intrinsically much more luminous than a white dwarf, can cause the distance estimate for that object to be unreasonably large. Assuming that a star is a young white dwarf () implies that this object is less likely to be part of the Galactic halo since the latter is composed of much older objects. Also, and based on the lack of proper motion detection discussed in Section 4.2, one can define an upper limit to the tangential velocity () of each object once its distance is determined. The motion of an object moving by more than 0.18 HUDF pixel (0.027 ”/ yr) should have been detected at the significance level as discussed in Section 3.2. As discussed above, objects in the Galactic halo are expected to have velocities around 100-200 km/s. Even if projection effects should result in lower values of , one would expect at least some of them to have values larger than 30-60 km/s. A final clue to help narrow down the nature of a particular object is provided by the fact that an object that is nearby would suffer from a significant, easily measurable, parallax during the 73 days interval between Epoch 1 and Epoch 2 observations. Calculating the parallax vector for the HUDF exposures shows that an object 30 pc away would produce a parallax of about 0.060” or 2 HUDF pixel between Epoch 1 and Epoch 2 observations. Objects that are closer than 200 pc are therefore expected to produce a parallax that would be detected at more than level.
Examining Table 3, objects 4322, 4839, 7768, 9020 are unlikely to be main-sequence stars as this would make them very distant objects. The Magellanic Stream (Mathewson & Ford, 1984) is too far away from the HUDF to possibly explain the existence of main-sequence stars at such large distances. Objects 1147, 3166, and 5921 which do not (this is true of all objects listed in Table 3) have measurable parallax or proper motion, are not likely to be white dwarfs. Being either young or old white dwarfs would place these two objects less than 200 pc away and would have resulted in measurable parallax in the HUDF image stacks. Another object unlikely to be a white dwarf is object 9230 which was observed to have a fainter, unresolved companion 0.5” away. This companion, for which we have no GRAPES spectrum, has a band magnitude of mag and the colors mag. Based on these colors, this object should be an early M dwarf that is away. This places both object 9230 and its companion at the same distance (within error bars). The likelihood of any two stars being within 0.5” in the HUDF, and at nearly the same distance, is very small () and these two objects are likely to be part of a binary system, with object 9230 being a K type main-sequence star. Independently of this, object 9230 cannot be an old white dwarf since this would place this object at distance of 34 pc where its parallax motion would have been very easily detected.
5.2.2 Disk or halo white dwarfs?
Four objects (4322, 4839, 7768, 9020) remain as white dwarf candidates. Using a simple 1/ (Schmidt, 1968; Tinney et al., 1993; Méndez, 2000) analysis, the white dwarf number density in the direction of the HUDF can be computed. The detection of 4 white dwarfs in the HUDF implies a local density of . The upper and lower limits on the density are computed using old or young white dwarfs respectively, while the errors reflect the large uncertainties in the intrinsic luminosities of young and old white dwarfs ( mag). Note that this estimate is actually not affected by whether or not object 9230 was included as a HUDF white dwarf. The contribution of this object to the 1/ is negligible. For comparison, Liebert, Dahn & Monet (1988) previously determined the local white dwarf density to be , while Reid, Sahu & Hawley (2001) found a value of , and Méndez (2000) derived a density of white dwarfs in the thick disk of . The white dwarf density derived here is consistent with most of the previous density estimates. Properly determining the disk and halo membership of the 4 white dwarfs identified in the HUDF will be needed before a stronger conclusion can be made. Re-observing the HUDF field in the band in 1.5 years would allow (assuming that a 0.18 HUDF pixel shift corresponds to a level detection) one to unambiguously detect the proper motion of halo white dwarfs with km/s at distances up to 1000 pc.
The above density estimate assumed that all four HUDF white dwarfs were Galactic disk objects. Could some of these objects be in the Galactic halo? At least two of these objects (4839, 7768) have values that are lower than 60 km/s. The probability that this is caused by a projection effect is under 10% (assuming a relatively low velocity of km/s for halo objects). The last two white dwarfs listed in Table 3 (4322, 9020) are at slightly larger distances which average to 583 pc, and more importantly have larger values of . The average distance of these objects still seems a bit low for objects which would be part of a Galactic halo whose density increases all the way up to 7 kpc (Reid, 1993), while white dwarfs with absolute magnitudes of mag (Harris et al., 2003) should be detected all the way out to 1000 pc. Unless these objects are intrinsically much dimmer, one would expect the average distance to these two objects to be larger than 583 pc and much closer to our limit of 1000pc. The values inferred for objects 4322 and 9020, while higher than those of objects 4839 and 7768, fall substantially short of expected typical halo velocities. The probability of observing each of the objects with the values listed in Table 3 is between 14–20%. As a group, the probability that objects 4322 and 9020 are halo objects is under 3%. Similarly, the hypothesis that all 4 detected white dwarfs in the HUDF are halo rather than disk objects is excluded at the 99.9986 % level. Overall, the distances to the four white dwarf candidates identified here is more consistent with them being part of a Galactic thick disk. Majewski & Seigel (2002) derived a disk scale height of 400–600 pc using a study of low velocity white dwarfs. This value was somewhat larger than previous estimates of 250–350 pc but it is interesting to note that the M-dwarf disk scale height derived in Section 5.1, as well as the distance estimates of the white dwarfs listed in Table 3 all appear to agree with this value.
It would be interesting to attempt to set an upper limit on the halo white dwarf density based on the finding of up to two white dwarfs in the HUDF. Under this assumption, the upper limit to the Galactic halo white dwarf density is computed to be . This result is consistent with the previous work of Méndez & Minniti (2000) using the combined observations of the Hubble Deep Fields North and South ().
A population II halo white dwarf population that is older than 12-13 Gyr would have remained undetected here (An intrinsically fainter than mag white dwarf population would also help explaining the low average distances of the white dwarfs listed in Table 3). As discussed above, the white dwarfs identified in this work are more likely to be within the Galactic thick disk. It is to be noted that Kilic et al. (2004) recently observed a disproportionately large fraction of disk to halo white dwarfs in the Hubble Deep Field North (HDF-N). Kilic et al. (2004) found no evidence of any white dwarfs with tangential velocities larger than 30 km/s down to mag and the authors concluded that the blue objects they saw were all part of the Galactic disk. Similarly, the HUDF observations presented here successfully identified 4 white dwarf candidates with mag in the HUDF, none very likely to be in the Galactic halo while 2–3 detection would have been expected to be consistent with previous studies.
5.2.3 Dark halo white dwarfs?
While dynamical studies of the Galaxy predict the dark matter white dwarf density as high as (assuming that 100% of the dark matter halo mass is in the form of white dwarfs), the failure to detect a significant population of high velocity white dwarfs in the HUDF points to a dark matter halo devoid of a significant white dwarf population. Following the methodology of Kawaler (1996), one can estimate the amount of dark matter halo mass that is probed by the HUDF images, and directly compute the fraction of the dark matter halo mass that could be contained in a white dwarf population. Assuming a white dwarf absolute magnitude of 17.0 mag(Harris et al., 2003) and a limiting magnitude of mag, the maximum probed distance is 1000 pc. In the corresponding volume, and in the direction of the HUDF, the included dark matter halo mass is 3 . A population of dark matter halo white dwarfs could possibly have remained undetected in this study for several reasons: (1) The method used in this paper may be inefficient at properly identifying halo white dwarfs in Table 3. In this case, if one assumes that the HUDF contains 4 halo white dwarfs (), these would account for , a significant fraction of the expected dark matter halo mass. This would however increase the ratio of halo to disk white dwarfs to unrealistically high levels (i.e. ), and would assume that all the white dwarfs seen in the HUDF are from the dark matter halo and not from the pop II halo, which is highly unrealistic. The lack of proper motion detections also makes this scenario unlikely; (2) White dwarfs do not contribute significantly to the Galactic dark matter halo mass. From microlensing experiements towards the Magellanic clouds, the contribution of MACHOs to dark matter has been estimated to be anywhere between 20% to less than 2% (Alcock et al., 2000; Afonso et al., 2003; Sahu, 2003; Evans & Belokurov, 2004, and references therein). Furthermore, Majewski & Seigel (2002) showed how an increased thick disk scale height of 400-600 pc makes it unlikely that white dwarfs could be the MACHO objects; (3) White dwarfs could contribute significantly to the mass of the Galactic dark matter halo but are too faint to be detected in this study. Richer et al. (2000) showed that an increase in the age of the white dwarf halo population from 10 Gyr to 16 Gyr is expected to reduce the number of white dwarf detection (down to ) by a factor of 7. The lack of high velocity white dwarf detections in the HUDF puts upper limits on the contribution of an hypothetical white dwarf population to the Galactic dark matter halo. Based on the brightest objects in the HUDF for which we have spectra (i.e. ), if the dark matter halo is as old as about 12 Gyr (Hansen, 2002; Charboyer et al., 1998) then dark matter halo white dwarfs with () contribute less than 20% to the dark matter. If the age of the dark matter halo is 10 Gyr, white dwarfs () contribute less than 2% to the dark matter.
The possibility that there is a large population of faint white dwarfs that has remained unidentified in this study and which would account for a significant fraction of the dark matter halo can be investigated a little further. Recall that in Section 4.3, 14 sources with () and blue (, ) colors were identified. Not all of these sources were expected to be bona-fide stars and some are likely to be extra-galactic sources, but as discussed in Section 3.1, it is estimated that 95% of the stars in the HUDF were properly identified, so that this number should be considered to be an upper limit on the number of faint starts in the HUDF. Following the same methodology used above, but now using a limiting magnitude of , the HUDF images probe through 79 of the dark matter halo. Even under the extreme assumption that all 14 unresolved candidates in the UDF are high velocities white dwarfs, this implies that, when reaching down to =29.5, faint white dwarfs in the Galactic dark matter halo contributing less than 10% to the total dark matter halo mass for a dark matter halo age of 12 Gyr. Future observations of the HUDF would allow more sensitive measurements of the proper motion of these faint objects (Section 5.2.2). Setting tighter constraints on the maximum tangential velocities of these faint HUDF unresolved objects would allow to exclude some of these objects from high velocity white dwarfs and would allow to further lower the maximum fraction of the dark matter halo mass that could be accounted for by white dwarfs.
6 Conclusions
A systematic search for unresolved objects in the HUDF identified 46 objects with mag. Using the GRAPES spectra of these objects, 28 objects with mag were spectroscopically identified, including 18 M and later dwarfs (including 2 unconfirmed L dwarf candidates), and 2 QSOs. The M dwarf luminosity function of M4 and later-type stars was computed and compared to predictions based on Monte-Carlo simulations. Assuming a simple analytical model of the Galactic disk, the number of detected M dwarfs was shown to be large enough to constraint the scale height of the M and L dwarf Galactic disk to be . Out of 8 stars that were found to not be M or later-type stars, four stars were determined to be old white dwarf candidates. Not a single object was found to have a proper motion that is larger than 0.027”/year making them likely Galactic thick disk objects. Further imaging of the HUDF, using a time span larger than 1.5 year would provide more sensitive proper motion measurements. More sensitive proper measurements are required to positively place unresolved objects in the Galactic disk or halo. It would also allow to search for high tangential velocity objects amongst the 14 fainter () unresolved sources identified in the HUDF. Excluding halo membership of objects down to based on proper motion measurements would further constraint the maximum white dwarf contribution to the dark matter halo mass. The currently available observations of the HUDF, spanning 73 days, show the absence of a significant population of high velocity white dwarfs down to , and a relatively small number of unresolved, faint blue sources in the field down to . This is interpreted as a consequence of white dwarfs accounting for less than 10% of the dark matter halo, assuming that the dark matter halo is 12 Gyr old.
References
- Afonso et al. (2003) Afonso C. et al. 2003, A&A, 404, 145
- Alcock et al. (2000) Alcock, C., et al. 2000, ApJ, 542, 281
- Allen (2000) Allen, C. W. 2000, Astrophysl Quantities 4th ed. (Athlone Press, London), p388
- Beckwith et al. (2004) Beckwith S., et al. 2004, in preparation
- Bertin & Arnouts (1996) Bertin, E. Arnouts, S. 1996, A&AS, 117, 393
- Burgasser et al. (2003) Burgasser, A. J., Kirkpatrick, J. D., Liebert, J. & Burrows, A. 2003, ApJ, 594, 510
- Burgasser et al. (2004) Burgasser, A. J. 2004, ApJS, in press (astro-ph/0407624)
- Burrows et al. (1997) Burrows, A. et al. 1997, ApJ, 491, 856
- Charboyer et al. (1998) Chaboyer, B., Demarque, P., Kernan, P.J., Krauss, L.M. 199. Astrophys. J. 494:96-110
- Chiba et al. (2000) Chiba, M. & Beers, T. C., AJ, 199, 2843
- Cohen et al. (2004) Cohen, S. H., Ryan, R. E., Hathi, N., Windhorst, R. A., Koekemoer, A., Xu, C., Pirzkal, N., Malhotra, S. & Strolger, L. 2004, ApJ in preparation
- Dahn et al. (2002) Dahn, C. C. et al. 2002, AJ, 124, 1170
- Digby et al. (2003) Digby, A. P., Hambly, N. C., Cooke, J. A., Reid, I. N., & Cannon, R. D. 2003, MNRAS, 344, 583
- Evans & Belokurov (2004) Evans, N. W., Belokurov, V. 2004, in press (astroph/0411222)
- Fruchter & Hook (2002) Fruchter, A. S. Hook, R. N. 2002, PASP, 114, 144F
- Gates & Gyuk (2001) Gates, I. E. & Gyuk, G. 2001, ApJ, 547, 786
- Gates et al. (2004) Gates, I. E. et al. 2004, in press (astroph/0405566)
- Giavalisco et al. (2004) Giavalisco, H. C. et al. 2004, ApJ, L93
- Golimowski et al. (2004) Golimowski, D. A. et al. 2004, AJ, 127, 3516
- Harris et al. (2001) Harris, H. C. et al. 2001, ApJ, 549, L109
- Harris et al. (2003) Harris, H. C. et al. 2003, AJ, 126, 1023
- Hansen (2002) Hansen, B. M. S., et al. 2002, AJ, 574, L155
- Ibata et al. (1999) Ibata, R. A., Richer, H. B., Gilliland, R. L. & Scott, D. 1999, ApJ, 524, L95
- Ibata et al. (2000) Ibata, R. A., Irwin, M., Bienaymé, O., Scholz, R. & Guibert, J. 2000, ApJ, 532, L41
- Kawaler (1996) Kawaler, S., D. 1996, AJ, L61
- Kilic et al. (2004) Kilic, M., von Hippel, T., Mèndez, R. A. & Winget, D. E. 2004, ApJ, 609, 766
- Kirkpatrick et al. (2000) Kirkpatrick et al. 2000, AJ, 120, 447
- Liebert, Dahn & Monet (1988) Liebert, J., Dahn, C., C. & Monet, D. G. 1988, ApJ, 332, 891
- Majewski & Seigel (2002) Majewski, S. R., Siegel, M. H., 2002, ApJ, 569, 432
- Mathewson & Ford (1984) Mathewson, D., S. & Ford, V., L. 1984, IAUS, 108, 125
- Méndez et al. (1996) Méndez, R. A., Minniti, D., De Marchi, G., Baker, A. & Couch, W. J. 1996, MNRAS, 283, 666
- Méndez & Minniti (2000) Méndez, R. A. & Minniti, D. 2000, ApJ, 529, 911
- Méndez (2000) Méndez, R. A. 2002, A&A, 395, 779
- Oppenheimer et al. (2001) Oppenheimer, B. R., Hambly, N. C., Digby, A. P., Hodgkin, S. T. & and Saumon, D. 2001, Science, 292, 698
- Pirzkal et al. (2004) Pirzkal N., et al. 2004, ApJS, 154
- Pickles (1998) Pickles, A. J. 1998, PASP, 110, 863
- Reid (1993) Reid, I. N. & Majewski, S. R. 1993, ApJ, 409, 635
- Reid et al. (1999) Reid, I. N. et al. 1999, ApJ, 521, 613
- Reid & Hawley (2000) Reid, N. & Hawley, S. L. 2000, New Light on Dark Stars (Chichester: Praxis)
- Reid, Sahu & Hawley (2001) Reid, I. N., Sahu, K., C. & Hawley, S. L. 2001, ApJ, 559,942
- Reid (2004) Reid, I. N., ARA&A, 43, in press
- Richer et al. (2000) Richer, H. B., Hansen, B., Limongi, M., Chieffi, A., Straniero, O. & Fahlman, G. C. 2000, ApJ, 529, 318
- Robin et al. (2003) Robin, A. C., Reylé, C., Derrière, S. & Picaud, S. 2003, A&A, 409, 523
- Ryan et al. (2004) Ryan, R. E., Hathi, N. P., Cohen, S. H., & Windhorst, R. A., ApJ in preparation
- Sahu (2003) Sahu, K. C. 2003, Space Telescope Science Institute symposium series, Vol. 15, Cambridge University Press, p. 14 - 23 (astro-ph/0302325)
- Sahu (1994) Sahu, K. C. 1994, Nature, 370, 275
- Schlegel et al. (1998) Schlegel, D. J., Finkbeiner, D. P. & Davis, M. 1998, ApJ, 500, 525
- Schmidt (1968) Schmidt, M. 1968, ApJ, 151, 393
- Tinney et al. (1993) Tinney, C. G., Reid, I. N. & Mould, J. R. 1993, ApJ, 414, 254
- Xu (2004) Xu, C. et al. 2004, ApJS, in preparation
| UID | RA (J2000) | Dec (J2000) | - | - | - | |||
|---|---|---|---|---|---|---|---|---|
| 19 | 53.1623248 | -27.8269460 | 26.58 | 1.91 | 1.01 | 0.30 | 0.015 | 0.004 |
| 366 | 53.1753062 | -27.8198904 | 29.99 | 2.20 | 3.05 | 1.27 | 0.009 | 0.030 |
| 443 | 53.1583988 | -27.8189953 | 31.25 | 0.86 | 3.47 | 1.51 | 0.016 | 0.028 |
| 834 | 53.1648156 | -27.8143652 | 27.67 | 2.35 | 2.00 | 0.76 | 0.013 | 0.011 |
| 911 | 53.1460739 | -27.8123237 | 25.21 | 2.09 | 1.80 | 0.65 | 0.007 | 0.002 |
| 1147 | 53.1834639 | -27.8067589 | 19.58 | -0.16 | 0.52 | 0.13 | 0.091 | 0.002 |
| 1343 | 53.1398080 | -27.8100295 | 27.36 | -0.23 | -0.14 | -0.04 | 0.045 | 0.046 |
| 2150 | 53.1767483 | -27.7996684 | 22.60 | 1.99 | 1.43 | 0.80 | 0.147 | 0.003 |
| 2368 | 53.1676057 | -27.8037923 | 29.07 | 1.18 | 0.08 | -0.20 | 0.046 | 0.050 |
| 2457 | 53.1616105 | -27.8027738 | 26.98 | 1.91 | 0.98 | 0.30 | 0.004 | 0.008 |
| 2977 | 53.1726388 | -27.8006672 | 27.94 | -0.18 | -0.21 | 0.18 | 0.042 | 0.049 |
| 3166 | 53.1583425 | -27.7949215 | 20.80 | 0.96 | 0.80 | 0.37 | 0.086 | 0.007 |
| 3561 | 53.1483050 | -27.7977856 | 29.24 | 1.98 | 0.91 | 0.24 | 0.018 | 0.012 |
| 3794 | 53.1474097 | -27.7965561 | 28.89 | 2.14 | 0.98 | 0.29 | 0.010 | 0.007 |
| 3940 | 53.1498728 | -27.7961691 | 27.06 | -0.48 | -0.21 | -0.18 | 0.033 | 0.038 |
| 4120 | 53.1839107 | -27.7954147 | 28.04 | 0.03 | 0.12 | 1.31 | 0.023 | 0.012 |
| 4322 | 53.1349058 | -27.7944480 | 26.83 | 0.06 | -0.06 | -0.07 | 0.067 | 0.043 |
| 4643 | 53.1848922 | -27.7933971 | 31.73 | 1.52 | 0.74 | 0.25 | 0.019 | 0.050 |
| 4839 | 53.1883621 | -27.7923200 | 27.22 | 1.20 | 0.40 | 0.07 | 0.018 | 0.015 |
| 4945 | 53.2003709 | -27.7898451 | 25.06 | 2.06 | 1.74 | 0.67 | 0.020 | 0.013 |
| 5317 | 53.1257144 | -27.7904647 | 29.06 | 0.49 | -0.00 | -0.30 | 0.045 | 0.039 |
| 5441 | 53.1625253 | -27.7896458 | 27.81 | 1.75 | 1.27 | 0.39 | 0.016 | 0.019 |
| 5921 | 53.1322881 | -27.7828516 | 20.57 | 0.77 | 1.19 | 0.51 | 0.094 | 0.070 |
| 5992 | 53.1498432 | -27.7874448 | 27.52 | 1.63 | 0.69 | 0.16 | 0.014 | 0.005 |
| 6334 | 53.1782000 | -27.7861688 | 27.71 | -0.27 | -0.16 | -0.18 | 0.049 | 0.049 |
| 6442 | 53.1416300 | -27.7856726 | 28.16 | -0.19 | 0.04 | -0.07 | 0.044 | 0.030 |
| 6461 | 53.1984259 | -27.7848674 | 26.80 | 1.77 | 1.00 | 0.30 | 0.010 | 0.010 |
| 6620 | 53.1428439 | -27.7849376 | 31.27 | 3.19 | 0.25 | -0.14 | 0.041 | 0.049 |
| 6732 | 53.1784892 | -27.7840395 | 25.73 | 1.13 | -0.04 | 0.01 | 0.010 | 0.022 |
| 7113 | 53.1707114 | -27.7826303 | 30.83 | 2.49 | 0.65 | 0.20 | 0.026 | 0.024 |
| 7194 | 53.1860335 | -27.7822207 | 26.91 | -0.12 | -0.13 | -0.06 | 0.048 | 0.045 |
| 7357 | 53.1692789 | -27.7813943 | 27.93 | 0.10 | -0.21 | -0.16 | 0.024 | 0.031 |
| 7525 | 53.1318579 | -27.7820076 | 28.70 | 2.22 | 1.08 | 0.30 | 0.011 | 0.007 |
| 7768 | 53.1472186 | -27.7714786 | 27.12 | 1.66 | 0.68 | 0.20 | 0.014 | 0.005 |
| 7894 | 53.1831085 | -27.7802451 | 27.46 | 0.03 | -0.15 | -0.12 | 0.047 | 0.039 |
| 8081 | 53.1580838 | -27.7701503 | 27.92 | -0.32 | -0.40 | -0.30 | 0.038 | 0.020 |
| 8157 | 53.1649526 | -27.7736713 | 30.85 | 2.16 | 0.40 | 0.07 | 0.042 | 0.039 |
| 8186 | 53.1867094 | -27.7735490 | 27.72 | -0.13 | -0.14 | -0.34 | 0.044 | 0.029 |
| 9006 | 53.1853179 | -27.7799976 | 27.46 | -0.05 | -0.07 | 0.24 | 0.039 | 0.024 |
| 9020 | 53.1685421 | -27.7805214 | 27.00 | 0.28 | -0.01 | -0.16 | 0.025 | 0.034 |
| 9212 | 53.1485421 | -27.7701387 | 25.50 | 1.82 | 0.96 | 0.29 | 0.011 | 0.003 |
| 9230 | 53.1580164 | -27.7691869 | 21.18 | 0.76 | 0.38 | 0.10 | 0.037 | 0.007 |
| 9331 | 53.1638484 | -27.767128 | 27.95 | 2.20 | 1.84 | 0.67 | 0.025 | 0.005 |
| 9351 | 53.1781506 | -27.7691241 | 26.21 | 2.03 | 1.32 | 0.42 | 0.015 | 0.004 |
| 9397 | 53.162852 | -27.7671662 | 21.44 | 0.26 | 0.11 | 0.02 | 0.043 | 0.033 |
| 9959 | 53.1611698 | -27.7555109 | 29.12 | 2.42 | 0.91 | 0.29 | 0.022 | 0.021 |
| UID | Log(D) | |||||
|---|---|---|---|---|---|---|
| MS | WD | WD | ||||
| 19 | M1-M2 | no | 3.129 | 2.529 | ||
| 366 | L0-L1 | no | 3.750 | 3.150 | ||
| 443 | L0-M6 | no | 4.274 | 3.674 | ||
| 834 | M4-M5 | no | 3.258 | 2.658 | ||
| 911 | M4-M5 | no | 2.818 | 2.218 | ||
| 1147 | F6-F8 | no | 2.142 | 1.542 | ||
| 1343 | A0-K7 | yes | 3.713 | 3.113 | ||
| 2150 | M3-M4 | no | 2.315 | 1.715 | ||
| 2368 | O9-M6 | yes | 3.774 | 3.174 | ||
| 2457 | M0-M1 | no | 3.209 | 2.609 | ||
| 2977 | A0-M4 | yes | 3.818 | 3.218 | ||
| 3166 | K4-K5 | no | 2.164 | 1.564 | ||
| 3561 | M0-M1 | no | 3.647 | 3.047 | ||
| 3794 | M0-M1 | no | 3.544 | 2.944 | ||
| 3940 | O5-M3 | yes | 3.702 | 3.102 | ||
| 4120 | GAL | yes | ||||
| 4322 | A7-K5 | no | 3.548 | 2.948 | ||
| 4643 | A0-M6 | yes | 4.237 | 3.637 | ||
| 4839 | G5-K2 | no | 3.400 | 2.800 | ||
| 4945 | M4-M5 | no | 2.796 | 2.196 | ||
| 5317 | A0-M6 | yes | 3.910 | 3.310 | ||
| 5441 | M2-M3 | no | 3.407 | 2.807 | ||
| 5921 | K4-K5 | no | 2.155 | 1.555 | ||
| 5992 | K7-M0 | no | 3.373 | 2.773 | ||
| 6334 | F8-L0 | yes | 3.791 | 3.191 | ||
| 6442 | A0-G5 | yes | 3.865 | 3.265 | ||
| 6461 | M0-M1 | no | 3.202 | 2.602 | ||
| 6620 | B8-M4 | yes | 3.812 | 3.212 | ||
| 6732 | GAL | no | ||||
| 7113 | G8-K0 | yes | 3.861 | 3.261 | ||
| 7194 | O5-K5 | yes | 3.601 | 3.001 | ||
| 7357 | O9-M5 | yes | 3.760 | 3.160 | ||
| 7525 | M1-M2 | no | 3.491 | 2.892 | ||
| 7768 | K5-K7 | no | 3.286 | 2.686 | ||
| 7894 | B8-K7 | yes | 3.680 | 3.080 | ||
| 8081 | O5-A3 | yes | 3.843 | 3.243 | ||
| 8157 | GAL | yes | ||||
| 8186 | B0-K7 | yes | 3.764 | 3.164 | ||
| 9006 | B9-A3 | yes | 3.697 | 3.097 | ||
| 9020 | F0-F2 | no | 3.540 | 2.940 | ||
| 9212 | M0-M1 | no | 2.929 | 2.329 | ||
| 9230 | K2-K3 | no | 2.279 | 1.679 | ||
| 9331 | M5-M6 | no | 3.345 | 2.745 | ||
| 9351 | M1-M2 | no | 3.031 | 2.431 | ||
| 9397 | GAL | no | ||||
| 9959 | M0-M1 | no | 3.535 | 2.935 | ||
| UID | Type | D | Age | Possible | 1/ | ||
|---|---|---|---|---|---|---|---|
| (pc) | (Gyr) | (km/s) | Type | () | |||
| 1147 | MS F6-F8 | 3.7-4.0 | F6-F8 | ||||
| 1147 | Young WD | 14.0-15.0 | 110 24 | 1.4-3.9 | 14.1 | ||
| 1147 | Old WD | 17.4-18.3 | 24 5 | 10.3-12.1 | 3.0 | ||
| 3166 | MS K4-K5 | 6.8-7.1 | K4-K5 | ||||
| 3166 | Young WD | 14.8-15.8 | 80 18 | 2.5-5.7 | 10.2 | ||
| 3166 | Old WD | 17.2-18.2 | 27 6 | 9.9-11.5 | 3.5 | ||
| 4322 | MS A7-K5 | 2.3-7.1 | |||||
| 4322 | Young WD | 12.1-13.1 | 0.4-1.4 | 1545.6 | |||
| 4322 | Old WD | 17.5-18.4 | 590 126 | 10.7-12.9 | 75.5 | Disk or Halo | |
| 4839 | MS G5-K2 | 5.0-6.3 | |||||
| 4839 | Young WD | 12.5-13.5 | 1.1-3.3 | 885. | Disk | ||
| 4839 | Old WD | 17.4-18.3 | 417 88 | 10.4-12.3 | 53.4 | Disk or Halo | |
| 5921 | MS K4-K5 | 6.8-7.1 | K4-K5 | ||||
| 5921 | Young WD | 14.5-15.5 | 1.9-4.7 | 11.9 | |||
| 5921 | Old WD | 17.3-18.2 | 10.1-11.7 | 3.3 | |||
| 7768 | MS K5-K7 | 7.1-7.6 | |||||
| 7768 | Young WD | 14.5-15.5 | 1.9-4.7 | 160.2 | Disk | ||
| 7768 | Old WD | 17.3-18.2 | 345 70 | 10.1-11.7 | 44.1 | Disk or Halo | |
| 9020 | MS F0-F2 | 2.7-3.6 | |||||
| 9020 | Young WD | 13.3-13.3 | 0.5-1.6 | 793.9 | |||
| 9020 | Old WD | 17.5-18.4 | 576 123 | 10.7-12.9 | 73.7 | Disk or Halo | |
| 9230 | MS K2-K3 | 6.3-6.7 | K2-K3 | ||||
| 9230 | Young WD | 13.6-14.6 | 187 41 | 1.1-3.2 | 23.9 | ||
| 9230 | Old WD | 17.5-18.4 | 32 7 | 10.4-12.3 | 4.0 |