‘Sculptor’-ing the Galaxy?
The Chemical Compositions of Red Giants in the
Sculptor Dwarf Spheroidal Galaxy
Abstract
We have used high-resolution, high signal-to-noise spectra obtained with the VLT and UVES to determine abundances of 17 elements in 4 red giants in the Sculptor dwarf spheroidal galaxy. Our [Fe/H] values range from –2.10 to –0.97, confirming previous findings of a large metallicity spread. We have combined our data with similar data for five Sculptor giants studied recently by Shetrone et al. to form one of the largest samples of high resolution abundances yet obtained for a dwarf spheroidal galaxy, covering essentially the full known metallicity range in this galaxy. These properties allow us to establish trends of [X/Fe] with [Fe/H] for many elements, X. The trends are significantly different from the trends seen in galactic halo and globular cluster stars. This conclusion is evident for most of the elements from oxygen to manganese. We compare our Sculptor sample to their most similar Galactic counterparts and find substantial differences remain even with these stars. The many discrepancies in the relationships between [X/Fe] as seen in Sculptor compared with Galactic field stars indicates that our halo cannot be made up in bulk of stars similar to those presently seen in dwarf spheroidal galaxies like Sculptor, corroborating similar conclusions reached by Shetrone et al., Fulbright and Tolstoy et al. These results have serious implications for the Searle-Zinn and hierarchical galaxy formation scenarios. We also find that the most metal-rich star in our sample is a heavy element-rich star. This star and the [Ba/Eu] trend we see indicates that AGB stars must have played an important role in the evolution of the s-process elements in Sculptor. A very high percentage of such heavy element stars are now known in dwarf spheroidals compared to the halo, further mitigating against the formation of the halo from such objects.
1 Introduction
The complex relationships among the nearby dwarf spheroidal (dSph) galaxies, the globular clusters and the general halo of our galaxy are far from clear, though all belong to Baade’s (1944) original Population II. It is of interest to discuss the similarities and differences of their stellar populations in terms of possible scenarios for the origin of the Galactic halo. According to Eggen, Lynden-Bell & Sandage (1962) the Galactic halo, including the globular clusters, formed in a single monolithic event of gravitational collapse lasting about years. During that time, the vast majority of halo stars and stars in the globulars formed to provide the present population II. An alternative scenario was suggested by Searle & Zinn (1978) in which the halo was accumulated by the capture of many small systems such as dSphs over a timescale at least an order of magnitude longer. Many current versions of hierarchical galaxy formation theories invoke similar scenarios (e.g. Klypin et al. 1999, Moore et al. 1999). Strong observational evidence in favor of at least some contribution of dSph systems to the halo was first provided by Ibata, Gilmore & Irwin (1994) with the discovery that the Galaxy is currently capturing the Sagittarius system (Sgr) with its attendant globular clusters. More recent evidence (e.g. Yanny et al. 2003, Martin et al. 2004) indicates that the Galaxy may well be absorbing or has absorbed additional systems. In addition, the complicated history of gradual metal growth in Centauri indicates that it probably orbited our galaxy for several Gyr before being captured (Hughes & Wallerstein 2000; Hilker & Richtler 2000). That the Galaxy, as well as M31 and presumably other similar spirals, are intimately surrounded by a number of dSphs is made particularly clear in the graphic 3-dimensional galaxy distribution map of the Local Group given in Grebel (1999). A full review of current ideas regarding the formation of the Galaxy can be found in Freeman & Bland-Hawthorn (2002).
One approach that helps to constrain formation scenarios is to compare the populations of the surviving dSph systems with that of the halo. If the halo is indeed made up in large part by dissolved systems initially like the dSphs we see today, one would expect to find many similarities in their stellar populations . Of various methods of comparison, three stand out as potentially the most viable. The first is a comparison of the types and period distributions of variable stars (Renzini 1980). This method is not currently useable because of selection effects that plague any census of variables in the halo, although various surveys such as the Sloan Digital Sky Survey should help pin these down. The second is to compare the CMDs in detail and try to set limits on the percentage of present day dSph populations that may have contributed to the halo. By comparing the turnoff colors in these systems, Unavane, Wyse & Gilmore (1996) have set an upper limit of on this contribution, as the intermediate-age stars generally found in dSphs are lacking in the halo, hinting that dSphs may not be the generic galactic building blocks they are often imagined to be.
The third approach is a direct comparison of the detailed chemical compositions of stars from the two environments, based on high resolution spectroscopy. A large sample of Galactic field stars with detailed abundance analyses is now available (e.g. McWilliam 1997; Burris et al. 2000; Ryan, Norris & Beers 1996, Carretta et al. 2002, Nissen & Schuster 1997, Fulbright 2002, Johnson 2002, Gratton et al. 2003a, Stephens and Boesgaard 2002). A kinematic analysis of these and other Galactic field stars shows most belong to the halo below [Fe/H] = -1, although several thick disk stars have metallicities that extend below [Fe/H] = -2 (Venn et al. 2004). Here, we assume that stars with [Fe/H] below -1 are representative of the Galactic halo. The complementary studies of stars in dSph systems have only recently begun. In a pioneering study, Shetrone, Bolte & Stetson (1998) investigated four stars in the Draco dSph. They found a metallicity range from [Fe/H] = to with a mean value of [/Fe] of +0.2 and a spread in [O/Fe] from +0.38 to . Subsequently, Shetrone, Côté, & Sargent (2001 - hereafter S01) published results for an additional two stars in Draco, six in Ursa Minor and 5 in Sextans, and Shetrone et al. (2003 - hereafter S03) added five giants each in Carina and Sculptor (hereafter Scl), three in Fornax and two in Leo I. Combining their studies, they find that at a given metallicity the dSph giants exhibit significantly lower [ /Fe] abundance ratios than stars in the Galactic halo. They conclude that the general metal-poor Galactic halo could not be built up of stars like those seen in their dSph samples. However, they find that a small subset of stars, represented by the metal-rich , high , high halo stars studied by Nissen & Schuster (1997), do mimic the dSph stars of similar metallicity in their detailed chemical composition and support Nissen & Schuster’s claim that up to 50% of the metal-rich halo could be explained by dSph accretion, although this relied on only two dSph stars of the appropriate metallicity . However, Venn et al. (2004) further analysed the Nissen & Schuster (1997) stars and find that the Ni-Na relationship, the basis for the S03 claim about 50% of the metal-rich halo possibly being stripped dSphs, is a general nucleosynthetic signature and not relevant to the discussion of merged galaxies. Finally, Bonifacio et al. (2000), Bonifacio and Caffau (2003), Bonifacio et al. (2004) and Smecker-Hane & McWilliam (2002) have studied a large sample of stars in the Sgr dSph. The latter find significant differences between Sgr and Galactic field stars of comparable metallicity , in particular with regards to Al, Na and elements, in the same sense as for the samples of Shetrone and collaborators. Bonifacio et al. (2004) suggest that the chemical similarities of dSphs and damped Ly systems, particularly in regard to their depressed abundances , may demonstrate a common evolutionary history and nature.
Gratton et al (2003a) have used kinematics to divide field subdwarfs and early subgiants into two subpopulations, one which they ascribe to a dissipational collapse and one that is likely to represent accreted stars. In particular, they have compared the ratios of alpha-elements to iron in the two subpopulations. They find that on average the supposed accreted population has lower [ /Fe] than their dissipative collapse counterparts. If the accreted stars have been accumulated by the capture of systems like Scl, their compositions should be similar to those of Scl.
To expand the data base for dSph galaxies and to further test the hypothesis that the halo of the Milky Way may have been “sculpted” from galaxies like Scl, we have observed 4 red giants in the Scl galaxy. Scl was one of the first two dSph companions to the Milky Way to be discovered (Shapley 1938). Indeed, as the prototype, dSph galaxies were originally referred to as “Scl-like systems” (e.g. Shapley 1943). Photometry in Scl (e.g. Da Costa 1984, Schweitzer et al. 1995) has shown that the red giant branch is broad, indicating a spread in metallicity (as is seen in all dSphs and in Cen). In a survey of 37 red giants in Scl, Tolstoy et al. (2001) used the IR CaII triplet to derive metallicities111The estimation of metallicities by measurement of the CaII triplet has proven to be very efficient and useful. However, many authors refer to their results as [Fe/H] rather than [Ca/H] which was actually measured. The translation from [Ca/H] to [Fe/H] can be problematical (e.g. Cole et al. 2000), especially when [Ca/Fe] may vary between program objects and abundance calibrators. ranging from down to dex with most of the stars distributed between and . The distribution is asymmetric with a mean of and a peak near . Both the mean and spread are very similar to Cen (Norris, Freeman & Mighell 1996; Sunzeff & Kraft 1996) but the asymmetry in Cen is opposite to that of Scl with the peak of the distribution on the metal-poor side of the mean. Apparently the two systems had slightly different rates of self-enrichment and star formation.
Scl provides an excellent opportunity to compare the compositions of dSph stars with those in the halo. At a distance of 87 kpc (Mateo 1998), it is one of the nearest dSphs. Its brightest giants, at , are therefore accessible to 8m-class telescopes equipped with high resolution spectrographs. Since Scl shows a spread in metallicity, there is the possibility to compare the ratios of various species to iron as a function of metallicity with the same elemental ratios in the halo field and the globular clusters. Additionally, detailed abundances are required to disentangle age from metallicity effects when attempting to derive the star formation and chemical enrichment history of Scl, as discussed by Tolstoy et al. (2003) for their age determinations. Photometric data alone are not sufficient to break the age-metallicity degeneracy present in old – intermediate age stellar systems. Accurate age determinations require the knowledge of the element abundances as well as [Fe/H] .
Scl also is unusual or even unique in several respects. It appears to be composed mainly or almost exclusively of an old, Galactic globular cluster- aged population (e.g. Da Costa 1984, Hurley-Keller et al. 1999, Monkiewicz et al. 1999, Dolphin 2002). However, there are some blue stars brighter than the turnoff (Demers & Battinelli 1998) and it may contain neutral H gas (Carignan et al. 1998, Bouchard et al. 2003). Walcher et al. (2002) find evidence for tidal tails. Hurley-Keller et al. (1999), Majewski et al. (1999) and Harbeck et al. (2001) found a gradient in the morphology of the horizontal branch, with a much higher percentage of red HB stars in the inner regions than in the outer regions. Harbeck et al. (2001) found Scl to have the most significant HB morphology gradient of any of their sample of 9 dSphs. Majewski et al. even suggested the possibility of a bimodal metallicity distribution based on their CMD. However, Tolstoy et al. (2001) found no indication for either a metallicity gradient or bimodality in their low resolution spectroscopic abundances for a large sample of stars.
Because of its importance, several groups independently began high resolution studies of Scl stars. After we began our study we became aware of the other groups. The results of one of these groups have subsequently been published (S03) and we have combined our results with theirs. This allows for a substantial increase in sample size and metallicity coverage, allowing us to investigate any abundance trends with much greater confidence.
An additional aspect of a detailed analysis of Scl’s red giants is the internal evolution of the stars themselves. While all highly evolved, metal-poor, low-mass red giants show evidence of extra-mixing beyond the canonical first dredge-up (see references in, e.g., Weiss & Charbonnel 2003), the degree of mixing may depend on the initial stellar metallicity. In both field and globular cluster stars near the red giant tip, the very low 12C/13C ratio, ranging from 4 to 8, can be unambiguously attributed to an in situ (evolutionary) mixing mechanism. We can test the universality of this phenomenon by deriving the carbon isotopic ratios for our two most metal-rich stars.
On the other hand, the O/Fe, Na/Fe, and Al/Fe ratios vary greatly from star to star in globular clusters. The abundance anomalies of these isotopes from higher p-burning cycles, which are not seen in field halo stars, seem to be mostly of primordial origin according to the preponderance of observational evidence (e.g.., Gratton et al. 2001; Grundhal et al. 2002; Yong et al. 2003). Massive AGB stars have been claimed to be the favorite candidates to have polluted the intracluster gas or the surface of cluster stars (e.g., Cottrell & Da Costa 1981; Ventura et al. 2001). However Fenner et al. (2004) recently showed that the abundance patterns observed in a “classical” globular cluster like NGC 6752 could not be matched by a model of chemical evolution incorporating self-consistently the detailed nucleosynthesis yields from AGB stars. In particular, neither the O-Na nor the Mg-Al anticorrelations could be reproduced, in agreement with the previous findings by Denissenkov & Herwig (2003) and Herwig (2004). So the details of this primordial (or pollution) scenario still await clarification. By investigating the relative abundances of O, Na and Al we can see how the presence of these chemical variations depends on environment and probe the connection between dSphs and globular clusters.
Our paper is arranged as follows: In Section 2 we present the observations and reductions and in 3 the details of the abundance analysis. In 4 we present the abundance results. The heavy element star we discovered is discussed in detail in Section 5. In Section 6 we summarize our major findings.
2 Observations & Reductions
Echelle spectra of four giants in Scl were obtained on the nights of September 18 and 19, 2000 with the UVES instrument on the 8.2 m VLT UT2 telescope (Kueyen) of the European Southern Observatory. The target stars were selected from the study of Schweitzer et al. (1995) as being amongst the brightest giant members (with proper motion membership probabilities ) and covering the full color width near the tip of the giant branch. This latter should reflect to first order as complete coverage of the full metallicity range as possible. Each star was observed for a total of four hours, divided into one-hour exposures. The stars were observed simultaneously through the blue and red arms of UVES using a dichroic beam splitter. This yields complete coverage from in the red except for loss of a single order near the center where there is a gap between the two CCDs, and complete coverage from in the blue. The resolving power with a slit is about 22,000 in the red and 16,000 in the blue. The seeing was generally . Spectra of hot, rapidly rotating stars were also obtained in order to divide out telluric absorption lines. The data were sky subtracted, reduced to one-dimensional wavelength calibrated spectra, and then the individual spectra for each star were co-added, using the standard software packages available in IRAF. Typical S/N ratios for the final combined spectra are about 120 per pixel at 6700Å and 65 per pixel at 4500 Å. Radial velocities of all 4 stars, given in Table 1, show that they are indeed members, as the mean radial velocity of Scl stars is (Mateo 1998). Combining our four velocities with five velocities in S03, we find a mean of +110.0 km-s-1, with a dispersion (standard deviation) of 6.9 km s-1. A small segment of spectrum is shown for a metal-poor star (195, with [Fe/H]= -2.1) and for a more metal-rich star (1446, with [Fe/H]= -1.2) in Figure 1. The difference in the line strengths is obvious; as the stars have rather similar effective temperatures and gravities which would lead to only very modest differences in line absorption for the same abundances, most of the differences in the observed line strengths are caused by abundance differences. This is the most graphic evidence for a real abundance spread in this dSph.
3 Abundance Analysis
3.1 Stellar Effective Temperatures
One of the fundamental parameters needed in stellar abundance analyses is the effective temperature of the star in question. The procedure in this study is to base effective temperatures on two broadband color (V–K and J–K) calibrations of Teff. Table 1 lists the stars observed along with various apparent and absolute magnitudes and colors and the derived radial velocities. The star designations, V-magnitudes and (B–V) colors are taken from Schweitzer et al. (1995). The Two-Micron All Sky Survey (2MASS) database, accessed via “http://irsa.ipac.caltech.edu”, is the source of the K-magnitudes and (J–K) colors. The 2MASS magnitudes and colors have been transformed to the system defined by Bessell & Brett (1988), as we use Teff-calibrations from Bessell, Castelli & Plez (1998), who use the color system defined in Bessell & Brett (1988). The 2MASS corrections are those defined by Carpenter (2001) in his Appendix A and are fairly small: a constant 0.04 magnitude offset in K, and a small color term that is about 0.03 magnitude in (J–K). The V-magnitudes used to compute (V–K) are corrected for reddening based on the (B–V) color excess of (Mateo 1998) and AV= 3.3E(B–V). No absorption correction is applied to K, since the overall reddening to Scl is quite small and . In addition, in Table 1 are the absolute K-magnitudes (for a true distance modulus of - Mateo 1998), along with K-band bolometric corrections from Bessell et al. (1998) and the subsequent absolute bolometric magnitudes and luminosities.
Effective temperatures are derived for the program stars using the (V–K) and (J–K) colors from Table 1, along with calibrations discussed and defined in Bessell et al. (1998). These authors point out that (V–K) versus Teff has almost no sensitivity to metallicity (hereafter taken as [Fe/H]) so long as Teff is greater than 4000K, while (J–K) has only a small dependency; their near independence from [Fe/H] is why these two colors are used. Table 2 lists effective temperatures for each star as defined by (V–K) and (J–K) colors. With just the four program stars in question, there is no systematic offset between the two sets of Teff’s, and their differences scatter around 100K with no systematic trend. For the final Teff to be used in the abundance analyses, we adopt the average of the two values and round this to the nearest 25K in defining the model atmosphere effective temperature (shown in column 4 of Table 2). Other color – effective temperature relations are available in the literature and we compare one other source (McWilliam 1990) to the calibrations used here. Using McWilliam’s (V–K) calibration and comparing it to the values of colors and Teff’s in Tables 1 and 2, the mean difference (in the sense of Bessell et al. (1998) minus McWilliam) and standard deviation is found to be +719K: very good agreement. Using (J–K), the mean and standard deviation are +9051K. This comparison suggests that these various temperature scales for the types of red giants analyzed here are in good agreement with differences of less than about 100K.
3.2 Surface Gravities, Microturbulent Velocities, & Iron Abundances
With an effective temperature scale defined by broadband colors, the remaining global stellar parameters of surface gravity (parameterized as log g), microturbulent velocity (), and overall metallicity (defined by the Fe abundance) are set by the Fe I and Fe II lines. The spectroscopic analysis of the Fe lines, as well as all of the other elements to be discussed, uses a recent version of the LTE spectrum synthesis code MOOG, first described by Sneden (1973). The model atmospheres adopted are those generated from a version of the MARCS code as discussed by Gustafsson et al. (1975). The combination of LTE analysis from MOOG using MARCS model atmospheres has been used extensively in abundance analyses of K-giants, and yields accurate chemical abundances of many species. Recent examples of similar analyses of red giants includes Ivans et al. (1999, 2001), Ramirez et al. (2001), and S01 and S03.
The microturbulent velocity, at a given log g, is found by forcing all Fe I lines to yield the same iron abundance, i.e., with no significant slope of A(Fe)222 A(Fe)= log[N(Fe)/N(H)]+ 12.0. versus reduced equivalent width (log (W/). Once the microturbulent velocity is defined, the surface gravity is tested for consistency by comparing the Fe I and Fe II abundances, with ionization equilibrium demanding both neutral and singly ionized Fe to yield the same abundances. The now determined stellar parameters (Teff, log g, and ) along with the Fe I and Fe II lines are then used to derive the overall metallicity of the stellar atmosphere. The entire process of defining log g, , and [Fe/H] is iterated until a consistent set of stellar and model atmosphere parameters is found, and this atmosphere is finally used in the derivation of the other elemental abundances.
When enforcing the ionization equilibrium of Fe I and Fe II to derive surface gravity in metal-poor red giants, some care should be taken to investigate the possible influence of over-ionization on Fe I, as discussed by Thevenin & Idiart (1999). Data from three recent analyses of globular cluster giants can be used to partially address this question: Ivans et al. (1999) for M4, Ramirez et al. (2001) for M71, and Ivans et al. (2001) for M5. In all these studies, “evolutionary” gravities are calculated from stellar model tracks (with known masses) coupled to the derived red-giant effective temperatures and luminosities. Iron abundances are then computed and can be compared between Fe I and Fe II. From the three studies noted above, no significant effect is seen over the metallicity range from [Fe/H]= -0.84 (for M71 with (Fe I – Fe II)= +0.140.17), to [Fe/H]= -1.15 (for M4 with (Fe I – Fe II)= -0.010.09), and [Fe/H]= -1.21 (for M5 with (Fe I – Fe II)= -0.130.07). Based on the above observational constraints, overionization may affect derived gravities by 0.1 dex, and possibly lead to small over/underestimates of the iron abundance by 0.1 dex. Such a possibility will not, however, have a significant effect on the derived abundances and abundance trends to be discussed here.
The derived effective temperatures, gravities, microturbulent velocities, and iron abundances are listed in Table 2. The iron abundances are derived using the accurate sets of gf-values from Martin, Fuhr, & Wiese (1988), Bard, Kock, & Kock (1991), Holweger et al. (1991), and O’Brian et al. (1991). It is worth noting that the absolute accuracy of these Fe gf-values is now at the few percent level, and an analysis of solar Fe I and Fe II lines yields photospheric iron abundances with a scatter of 0.05 dex and essentially perfect agreement with the meteoritic abundance (A(Fe)= 7.50 - Grevesse & Sauval (1999)). Table 3 gives relevant parameters for all of our measured Fe lines.
We will later combine our abundances to those derived by S03 for five other Sculptor red giants in order to create a larger database. Abundances will be given as values of [X/Fe] so we must check for any offsets in the two abundance scales caused by either gf-values or adopted solar abundances. In the case here for iron, we note first that S03 used A(Fe)= 7.52 for the Sun, whereas we adopt 7.50; to strictly compare our respective Fe abundances, we should add +0.02 dex to the S03 values to bring them onto our scale. In addition, however, a comparison of gf values for Fe lines reveals that for 15 lines in common, there is a mean offset of +0.04 dex in log gf (in the sense of Us – S03). Based on this difference (if it is indicative of a general trend for all Fe lines), we should then subtract 0.04 dex from the S03 [Fe/H] values to bring them onto our gf-scale. The net result of considering the adopted Solar Fe and gf-value scales would be to shift by -0.02 dex the S03 values of [Fe/H] to bring them into agreement with our scale. This is such a small offset, well within the uncertainties of the gf-values themselves and even the Solar Fe abundance, that we consider such a difference to be insignificant and apply no corrections to the S03 values of [Fe/H]: both studies are effectively on the same abundance scale.
3.3 Elements Other Than Iron
Of the spectral species studied here in common with Smith et al. (2000), we have adopted the gf-values from that study, and their sources are discussed in detail in that paper. These elements are O I, Na I, Mg I, Al I, Si I, Ca I, Sc II, Ti I, Ti II, Fe I, Fe II, Ni I, Y I, Y II, Zr I, Zr II, Ba II, La II, and Eu II. Smith et al. (2000) analyzed both the Sun and Arcturus using this linelist and gf-values and derived expected abundances, indicating that these gf-values can be used to derive accurate abundances. In addition, we have added the species Mn I and Zn I in this study, with the Mn I gf-values taken from Prochaska & McWilliam (2000). Neutral zinc gf-values were adjusted to yield a Solar abundance of A(Zn)=4.60 using a 1-d MARCS model; this resulted in log gf= -0.44 for the 4722Å line (in excellent agreement with the value of -0.39 from S03), and log gf= -0.24 for the 4810Å line (again in excellent agreement with S03 who used -0.17). A comparison of the other elemental gf-values with the same lines used by S03 finds differences of less than 0.05 dex in log gf for all cases except Al I. In the case of differences having less than 0.05 dex, no offsets will be applied to the S03 abundances when adding them to our dataset. For Al I the offset is +0.26 dex (in the sense of Us – S03), this difference was applied in order to combine our Sculptor aluminium abundances with those from S03.
There are also a few other points concerning gf-values that should be noted. Two Ca I lines have differing log-gf values greater than 0.05 dex; the 6439.08Å gf-value used here is 0.08 dex larger than in Shetrone et al. (2003), but this is only marginally larger than 0.05 dex. The gf-value for the 6161.30Å line (Smith et al. 2000) is 0.24 dex larger than that adopted by Shetrone et al.; however the particular value used here, along with a MARCS solar model, yields a solar calcium abundance of A(Ca)=6.25. This is acceptably close to the recommended value of A(Ca)=6.34 from Lodders (2003). As calcium is represented by 8 lines in this study, and 9 lines from Shetrone et al., with the other gf-values in close agreement, the differences discussed above will not affect significantly the average Ca abundances.
The Mg I lines used here at 8717.83Å and 8736.04Å were not in Smith et al. (2000) and the gf-values here are taken from the Kurucz (1991) compilation. Analysis of these lines in the solar flux spectrum results in respective magnesium abundances of A(Mg)=7.51 and 7.54, close to the Lodders (2003) recommended value of 7.55.
There are no lines in common between this study and that of Shetrone et al. (2003) for Ti I, Ti II, Y I, and Y II, but later inspections of Figure 6 (for Ti) and Figure 8 (for Y) will find no significant differences in the respective behaviors of Ti and Y with metallicity between the two studies.
Hyperfine splitting (hfs) was included for the species Sc II (with the hfs data taken from Prochaska & McWilliam 2000), Mn I (hfs data also taken from Prochaska & McWilliam 2000), Y I (with hfs data taken from Biehl 1976), La II (with hfs data taken from Lawler, Bonvallet, & Sneden 2001), and Eu II (with hfs data taken from Biehl 1976). For those species with multiple isotopes, solar isotopic ratios were assumed.
Table 4 provides the relevant parameters for all of our measured non-Fe lines, as well as their equivalent widths in the Sculptor red giants. Although we present the equivalent widths, it must be noted that all abundances were derived via spectrum synthesis. The final abundances are given in Table 5, in the form of [X/H] values, as well as the adopted solar abundances in the form of A(X).
As discussed in Section 3.1, various comparisons between (V-K) and (J-K) temperature calibrations can reveal systematic differences of up to 90K, with a scatter of 50K, thus an expected uncertainty (1) of about 100K for Teff in red giants is a reasonable value. In addition, the 1 scatter set by the Fe I lines in defining a mean iron abundance is about 0.15 to 0.20 dex; this scatter is carried into the determination of the surface gravity from the Fe II lines, and leads to an uncertainty here of about 0.3 dex in log g. Finally, the microturbulence is defined by using the Fe I lines (with the criterion of no trend in Fe abundance with reduced equivalent width) and the minimum scatter in the Fe I abundances leads to an uncertainty in of about 0.3 km s-1. The uncertainties of 100k in Teff, 0.3 dex in log g, and 0.3 km s-1 represent approximate 1 values for these fundamental stellar parameters.
All of these elemental species present different sensitivities in their derived abundances to the primary stellar parameters of Teff, log g, and . Table 6 quantifies these sensitivities for star 770, which is near the middle of our sample in terms of effective temperature, gravity, and micorturbulence; the other stars will exhibit very similar sensitivities to changes in stellar parmaeters. The differences for each species are tabulated for a change of +100K in Teff, +0.3 in log g, and +0.3 km-s-1 in , with the final column showing the quadratic sum of these uncertainties. This final value is a fair estimate of the uncertainty in the derived abundances caused by realisitic uncertainties in defining the fundamental stellar parameters.
4 Abundance Results
4.1 Iron/Hydrogen
We first combine our data with that of S03 obtained with the same telescope and instrument. This gives us a total of 9 stars in Scl, the second largest sample of high resolution abundances yet obtained for a dSph, surpassed only by several Sagittarius studies, with a range in [Fe/H] from –2.10 to –0.97. Note that this substantially extends the metallicity range of S03’s sample, which covered –1.95 to –1.2. We also cover most of the known metallicity range in this galaxy, based both on the extreme colors of our sample in observed CMDs and the large sample of Ca-triplet abundances derived by Tolstoy et al. (2001) for 37 stars. Other than 2 stars with [Fe/H] of –2.2 to –2.3, their next most metal-poor star has [Fe/H] and at the metal-rich end their distribution stops at –1 except for a single star with –0.8. In particular, our combined sample allows us to see abundance trends with metallicity more clearly. Also note that our spectra are of significantly higher S/N than those of S03’s Scl observations.
Our mean [Fe/H] (standard error of the mean). This compares very well with the mean of found by Tolstoy et al. (2001) and the mean of –1.5 found by Dolphin (2002). We do not find any indication of a metallicity gradient, although our sample is small and only covers a limited radial range, from 0.1 – 1.1 core radii. Tolstoy et al. (2001) have a much larger sample and radial extent and found no gradient.
4.2 Sodium and Oxygen
Sodium is produced in the Ne-Na cycle in which protons are captured by the Ne isotopes accompanied by the necessary -decays. The stellar environment for the Ne-Na cycle is uncertain but it can occur at relatively low temperatures, near 30 million K, in evolved stable stars. In addition Na can be produced by carbon burning which requires temperatures that can be realized only in advanced stages of stellar evolution and in massive stars. In our nine Scl stars the mean [Na/Fe] ratio is , with no trend with metallicity . This ratio differs from recent analyses of globular clusters in which an excess of Na is usually seen. In M15 and M92 Sneden, Pilachowski and Kraft (2000) find [Na/Fe]=+0.2 on average. In M5 Ivans et al (2001) find [Na/Fe] -0.2 in oxygen-rich stars, rising to +0.4 in oxygen-poor stars. In M4 Ivans et al. (1999) find [Na/Fe] 0.0 for stars that do not show evidence of a deficiency of oxygen. Clearly the Na deficiency seen in Scl differs from the situation in the globulars. In the halo field, Fulbright (2002) found that [Na/Fe] scattered around 0.0 all the way down to [Fe/H]= –4.0 with some stars showing [Na/Fe] as large as +0.5 between [Fe/H]= –2.0 to –3.5 and some scattering down to [Na/Fe] = –0.5 between [Fe/H]= –1.5 to –2.5. Indeed the stars in his “high velocity” bin have [Na/Fe] very similar to our sample. Even if a correction of +0.2 is added to our [Na/Fe] values to compensate for potential non-LTE effects (e.g. Tautvaisiene et al. 2004), our Na abundances are still dex lower than typical Galactic stars of similar metallicity.
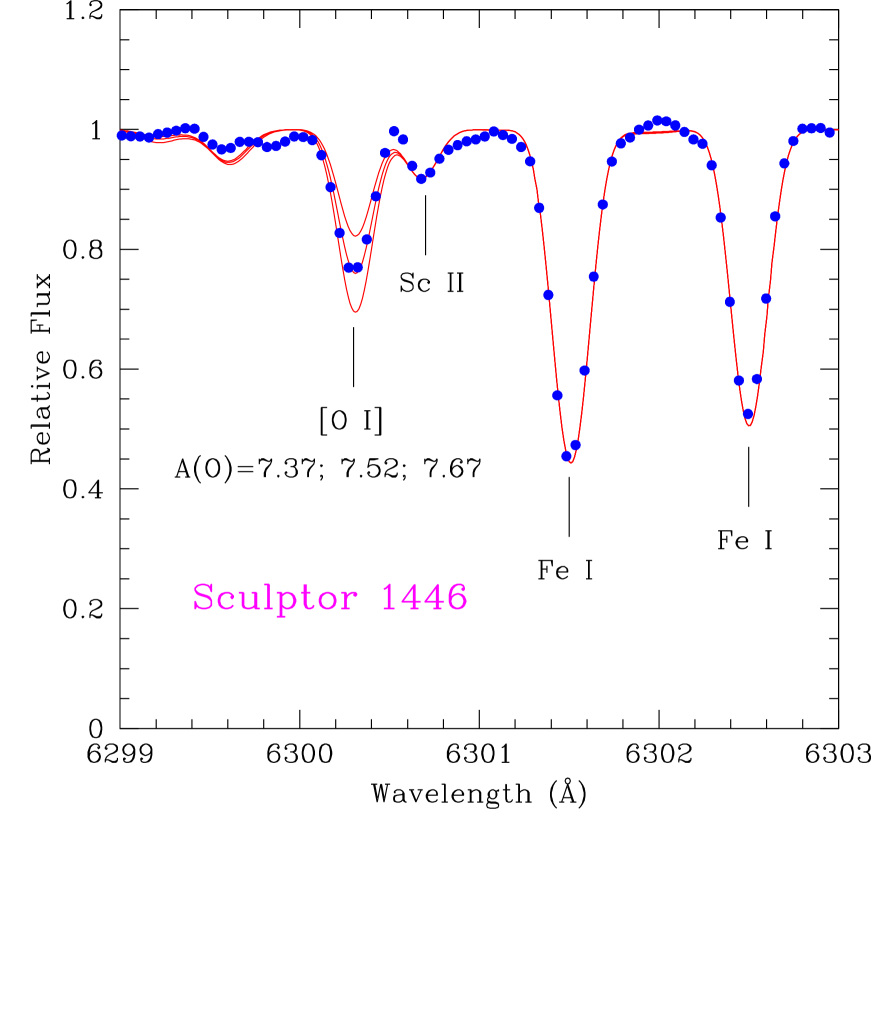
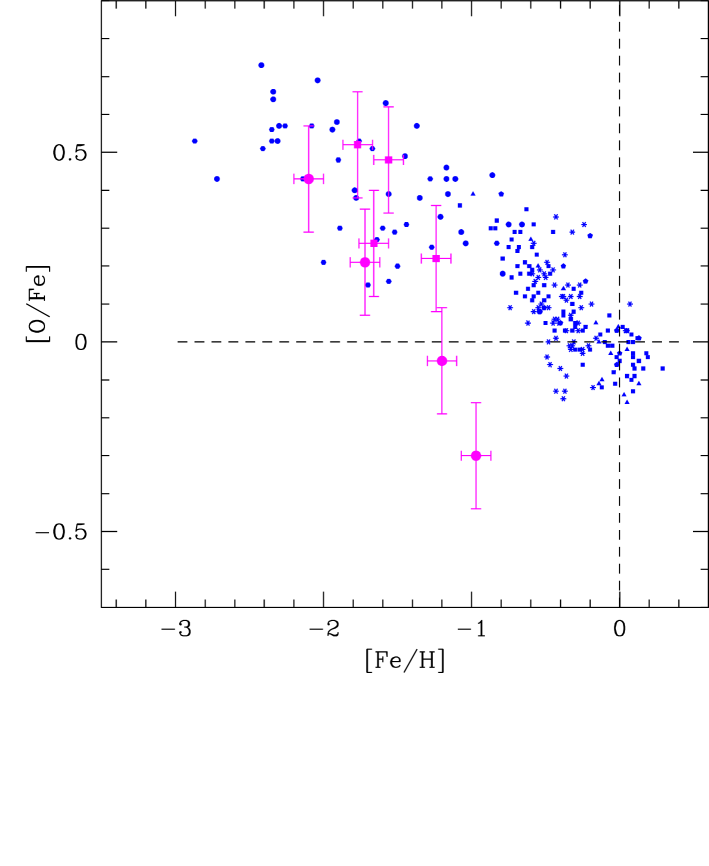
Our oxygen abundances were derived from the single 6300Å line of [OI], while S03 used both this line (mainly) as well as the 6363Å line when available (2 stars). Although generally weak and only a single line, we feel that our O abundances are well-determined via the spectrum synthesis technique. A comparison of observed and synthetic spectra covering the [O I] line in Star 1446 is shown in Figure 2 to illustrate the quality of the spectra and corresponding synthetic matches. In Figure 3 we show the correlation of [O/Fe] with [Fe/H] for both the Sculptor giants (8 stars sampled, with 4 from this study and 4 from S03), and a sample of Galactic field stars from a number of studies (noted in the figure caption). The Galactic studies shown in Figure 3 include those that rely either on the [O I] 6300Å line, or the infrared vibration-rotation lines from OH. At the metal-poor end, the [O/Fe] value is similar to, albeit a bit lower in the mean than, that which is seen in metal-poor globular clusters and the halo field (McWilliam 1997). However, the ratio of O/Fe decreases steadily and rapidly as [Fe/H] increases above –1.5, reaching [O/Fe] 0.0 at [Fe/H]= –1.2, and the most metal-rich star at [Fe/H] has a very low [O/Fe] abundance of –0.3. This is distinctly different from the globulars and the halo and disk field where [O/Fe] only begins to fall dramatically at [Fe/H]=–1 and does not reach zero until [Fe/H] is near zero. The O abundance of Star 982 is some 0.6 dex lower than the mean for the Galaxy at this metallicity . Note that this trend is seen much more clearly here than in S03 due to the extended metallicity range, or for that matter from our data alone, which suggest a strong monotonic decline.
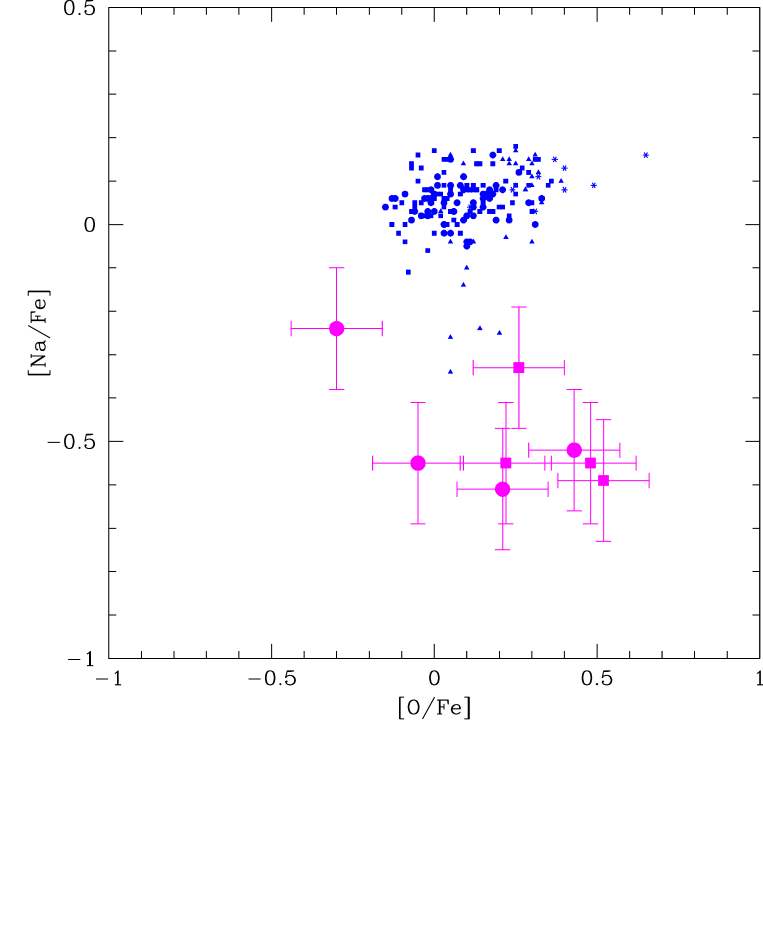
As noted in the Introduction, it is very important to check for the existence of any Na-O (anti)correlation in order to probe the connection between dSphs, the Galactic halo and globular clusters. In Figure 4 we present [Na/Fe] vs. [O/Fe] for the Sculptor red giants along with the data for Galactic field stars. There is no trend in Sculptor, although note that even the low-O star 982, the heavy element star (see Section 5), shows [Na/Fe]= -0.2. Where the anti-correlation is seen, it has often been ascribed to deep mixing within the star which has carried material to the stellar surface that had been processed by the ON, NeNa and MgAl cycles (see Dennisenkov and Weiss 2001 and references therein). However recent observational evidence and theoretical developments (see Charbonnel & Palacios 2003 and references therein) now point toward an alternative explanation. Namely, these anomalies may be due to stochastic enrichment by an earlier generation of stars followed by scattered incorporation into some, but not all, of the stars now seen in globular clusters (Cottrell & Da Costa 1981; D’Antona et al. 1983; Jehin et al. 1998; Parmentier et al. 1999). However the major source of pollution for GCs still remains to be determined. Indeed, based on current theories of intermediate mass stellar evolution and nucleosynthesis, it now appears that massive AGBs, which seemed to be the most plausible candidates for this pollution, are not responsible for the observed globular cluster abundance anomalies (Denissenkov & Herwig 2003; Herwig 2004; Fenner et al. 2004). Since we see neither the O/Na nor the O/Al anti-correlation in the Sculptor stars it appears that neither of the above scenarios (in situ extra-mixing of NeNa and MgAl cycle material or pollution) that induced the anomalous chemical patterns in globular clusters has occurred in this dwarf galaxy. The anti-correlation is never seen in field stars of the Galactic halo. These facts tend to associate Sculptor with field stars rather than with globular cluster stars. We note, however, that McWilliam et al. (2003) have found one star in Sgr with a mild excess of [Na/O].
The other light odd element is Al for which our fragmentary data (we only derive Al abundances for the two most metal-rich stars) shows a deficiency similar to that of Na, while in globulars the [Al/Fe] value varies, reaching as much as +0.6 in M4 in stars that show no evidence for the depletion of oxygen (Ivans et al. 1999).
4.3 The Ratio
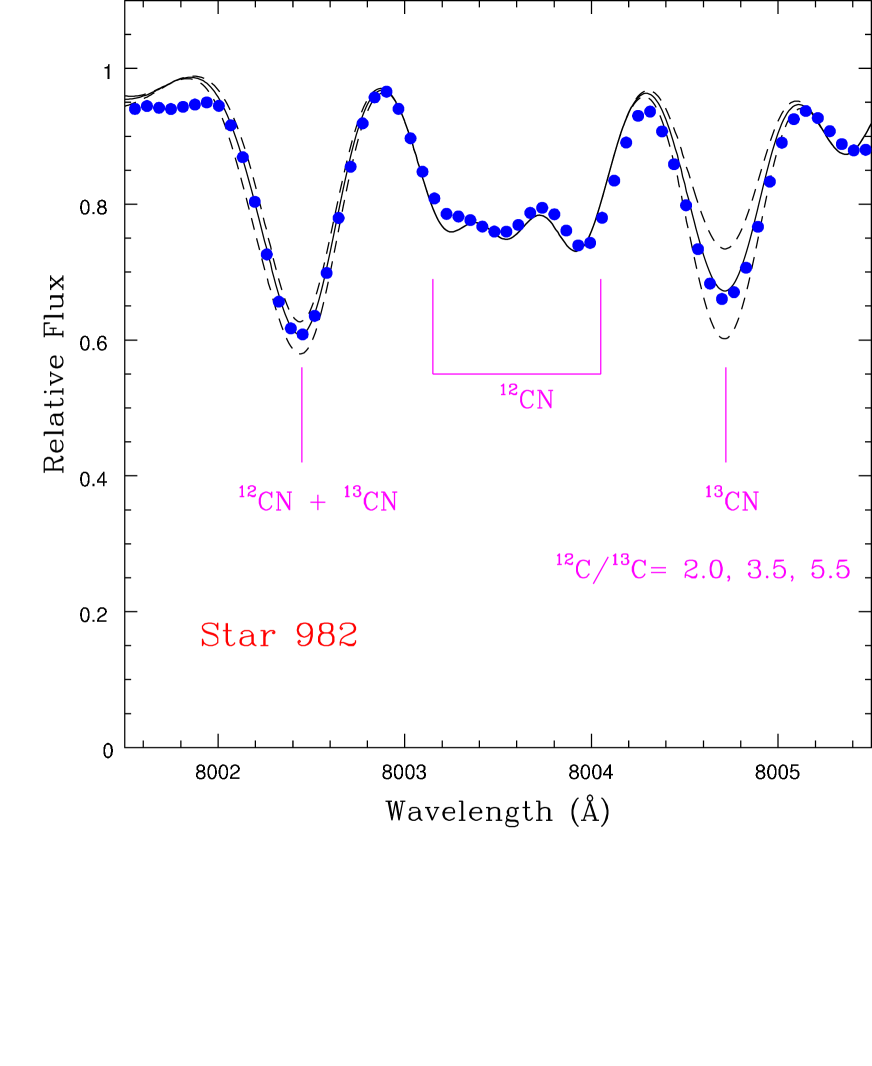
While the Na/O ratios in Scl do not provide evidence for deep mixing, the ratio of 12C/13C in two stars shows that moderately deep mixing has indeed occurred. For our two most metal-rich stars it was possible to derive the carbon isotope ratios from the 8005Å 13CN feature. For star 1446 the derived ratio is 3 with a substantial uncertainty. For the heavy element star, 982, the 13CN feature is strong enough for an estimate of the uncertainty and we find a ratio of . We show the fit for star 982 in Figure 5. These low ratios of 12C/13C are almost exactly the CNO equilibrium ratio and show that the vast majority of the material presently in the stellar atmosphere has been subject to proton capture at temperatures of at least 107K. Low 12C/13C ratios are the general rule for stars near the red giant tip in the field (Charbonnel, Brown & Wallerstein 1998; Gratton et al. 2000), and in galactic open (Gilroy 1989; Gilroy & Brown 1991) and globular clusters (see Charbonnel & do Nascimento 1998 for early references; Smith et al. 2000; Shetrone 2003). The same is true for RGB stars in the LMC (Smith et al. 2002) and in the SMC (Hill et al. 1997). Our results thus confirm the universality of an extra-mixing mechanism which transports matter between the outer layers of the hydrogen burning shell and the convective envelope in all low-mass red giants, and which is still not part of the standard evolution theory. This extra-mixing is independent of the stellar environment and metallicity, although it has been shown to depend on the initial stellar mass.
4.4 Alpha Elements
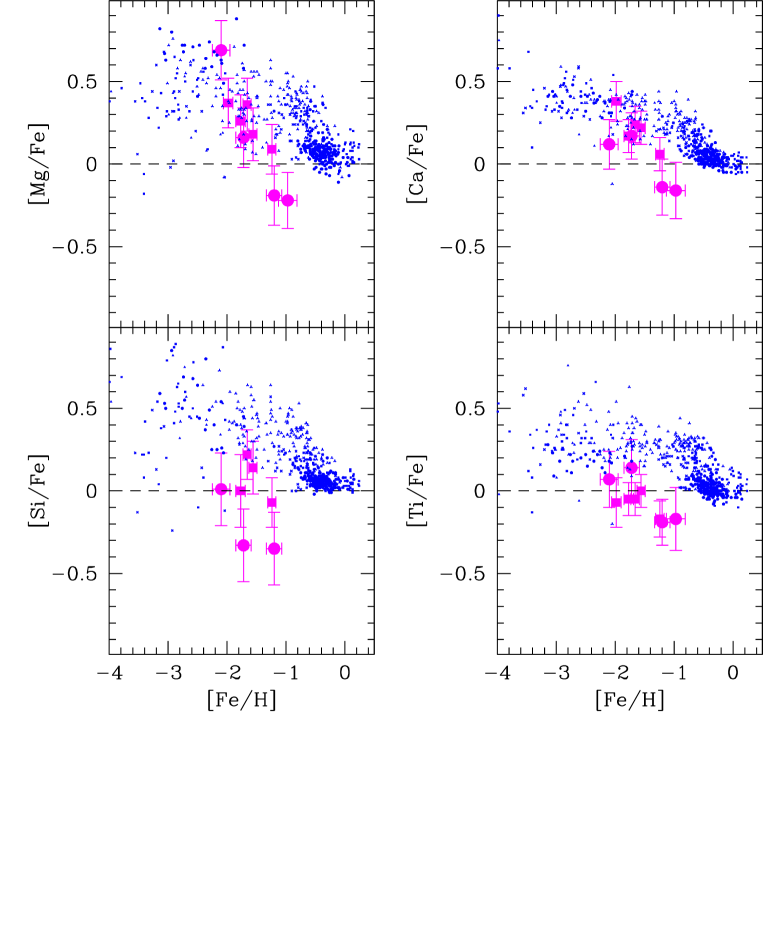
For the purposes of this Section, we will include here as alpha elements Mg, Si, Ca and Ti. See S03 for a more thorough discussion of the various nucleosynthetic origins for the alpha elements. Silicon scatters about a mean near solar while magnesium, calcium, and titanium show interesting and similar trends albeit at different significance levels, as shown in Figure 6. All three elements show trends generally similar to that of O, with solar or enhanced and relatively constant values for the stars with metallicity that are generally less than those of normal Galactic field stars at similar metallicities , but the more metal-rich stars have significantly lower abundances that are generally much lower than those of Galactic stars of the same metallicity . The abundance deficit with respect to Galactic field stars is in fact true for Si at all metallicities as well. In the case of Mg, the lowest metallicity star has the most enhanced abundance and the trend of decreasing abundance over the full metallicity range is the most pronounced. The decrease in abundance for the most metal-rich stars is smallest for Ti and indeed the difference between these and the more metal-poor stars is not very significant. [Ti/Fe] is nearly constant at about solar with only a small decrease to –0.2 for the three stars near –1.
This observed behavior in the Scl stars is different from the trends in the globulars and the halo where [Ti/Fe] is usually near +0.3 over the range of [Fe/H] from -2 to -1; though some metal-poor globulars show nearly the solar ratios (Lee and Carney, 2002). In fact, models of Type II supernovae usually place Ti as an iron-peak element rather than associate it with the alpha-elements (Arnett 1996). It appears that in Scl Ti follows SNII models better than do most of the globulars and field stars of low metallicty. But models comparing the relative yields of SNII and Ia (e.g. Lee and Carney 2002, Fig. 9, based on Woosley and Weaver 1995 models) show that Ti is the element most produced in SNII’s compared to SNIa’s. Shetrone (2004) suggested that the “light” (O and Mg) and “heavy” (Ca and Ti) elements may show differences in their behavior due to potential differences in their nucleosynthetic origins. We find that the mean enhancements of Mg and Ca in Scl (0.08 and 0.11 dex) are very similar but O (0.22 dex) is significantly enhanced with respect to Ti (-0.08 dex) and thus there is no clear trend.
4.5 The Iron Peak
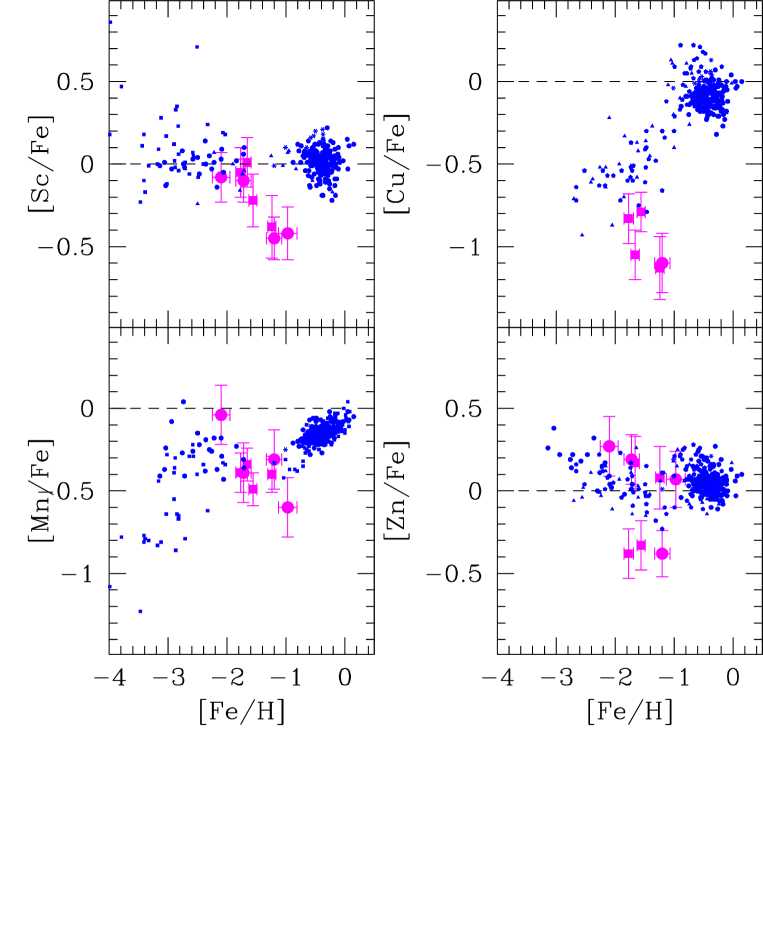
All of the elements from Sc to Zn are usually ascribed to the Fe-peak though a few of the odd elements may be enhanced by small neutron-capture processes. The relative abundances of Sc, Mn, Cu, and Zn are shown in Figure 7. In Galactic metal-poor stars Sc follows Fe very uniformly (McWilliam 1997). In Scl, between [Fe/H]=-2.1 and -1.5, Sc follows Fe just as in the Galaxy, although the mean [Sc/Fe] is slightly less than in the Galaxy. But the higher metallicity Scl stars deviate significantly from their Galactic counterparts: [Sc/Fe] begins to decrease at a metallicity of –1.5 and drops rapidly to about –0.5 by [Fe/H]=-1.0, very reminiscent of the general behavior. We know of no other object in which this phenomenon occurs. For Cr we must rely on the data of S03 whose Cr/Fe ratios for 5 stars lie close to -0.15 dex which is very similar to field stars in the halo (McWilliam 1997, Fig. 12a). The mean [Mn/Fe] ratio is near -0.4 which is similar to that in halo field stars of the same metallicity interval. However the [Mn/Fe] values for the largest and smallest deficiencies of Fe suggest a small downward trend in [Mn/Fe] with [Fe/H]. While the reality of this trend, which only depends on the two endpoints, is uncertain, especially when the error bars are taken seriously, the trend appears to be real. If so, this trend is contrary to the rise of Mn with Fe seen in the Galactic halo, thick disk and bulge (e.g. McWilliam et al. 2003). For Co/Fe the 4 stars analysed by S03 also track iron as do the halo field stars with [Fe/H] . The same holds for the Ni/Fe ratio. For Cu the story is very different. In the 5 stars for which we have derived copper abundances, with [Fe/H] between -1.2 and -1.8, the values of [Cu/Fe] are very near -1.0 with a hint of a downward trend with [Fe/H] , significantly different from the field halo stars and stars in Cen, where it is close to -0.5 in the same interval of [Fe/H] (McWilliam 1997, Cunha et al. 2002). The field stars show a significant slope, reaching -0.8 dex in [Cu/Fe] versus [Fe/H] at [Fe/H]=-2.5. Mishenina et al. (2002) find a steady decrease in [Cu/Fe] with decreasing [Fe/H]. However, over the interval of [Fe/H]= –1.2 to –1.8, their data are consistent with [Cu/Fe]=–0.5. Finally for Zn there appears to be no mean trend away from [Zn/Fe] 0.0, as seen in the halo field stars, but it appears that there may be a bifurcation, with one group of Scl stars with [Zn/Fe] and another with [Zn/Fe].
4.6 Heavy Elements
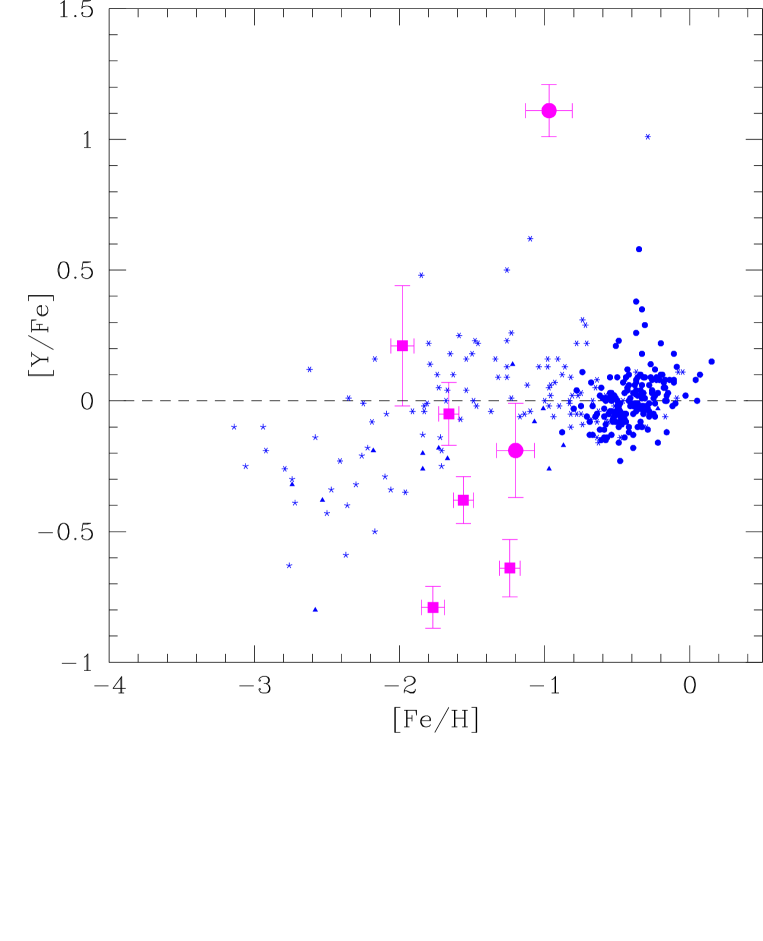
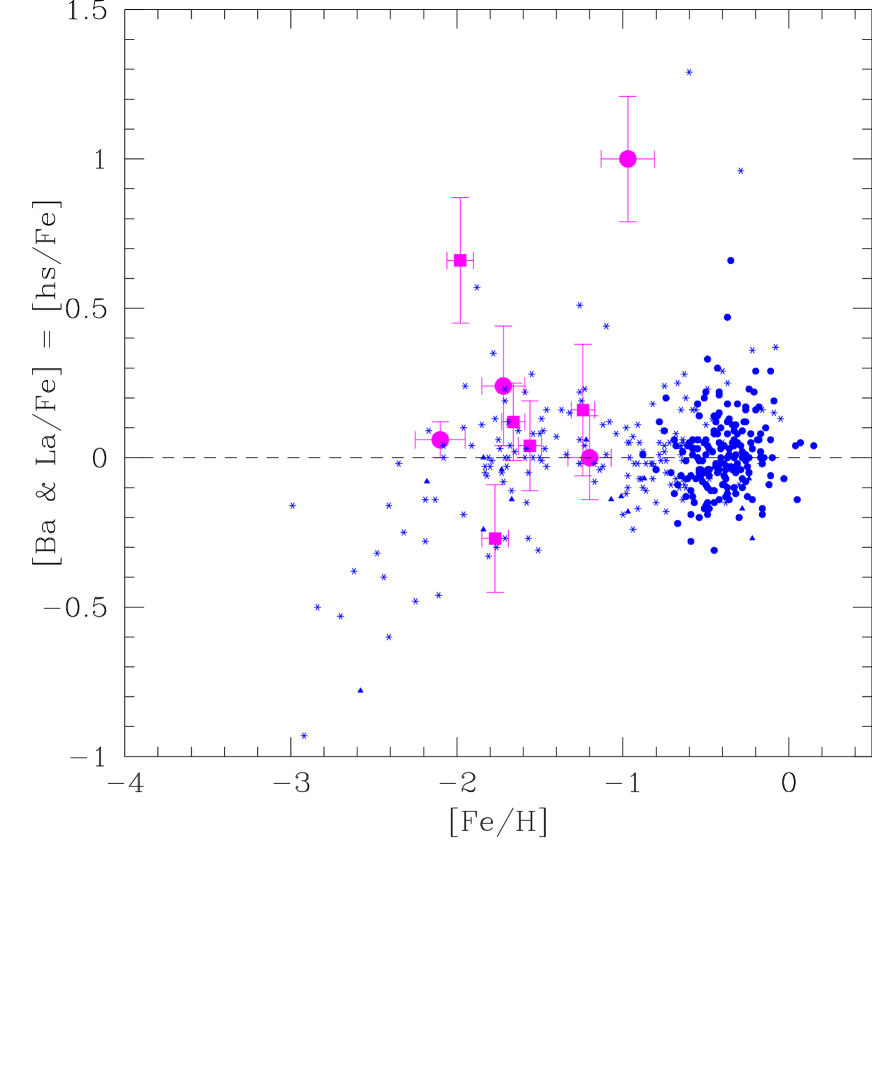
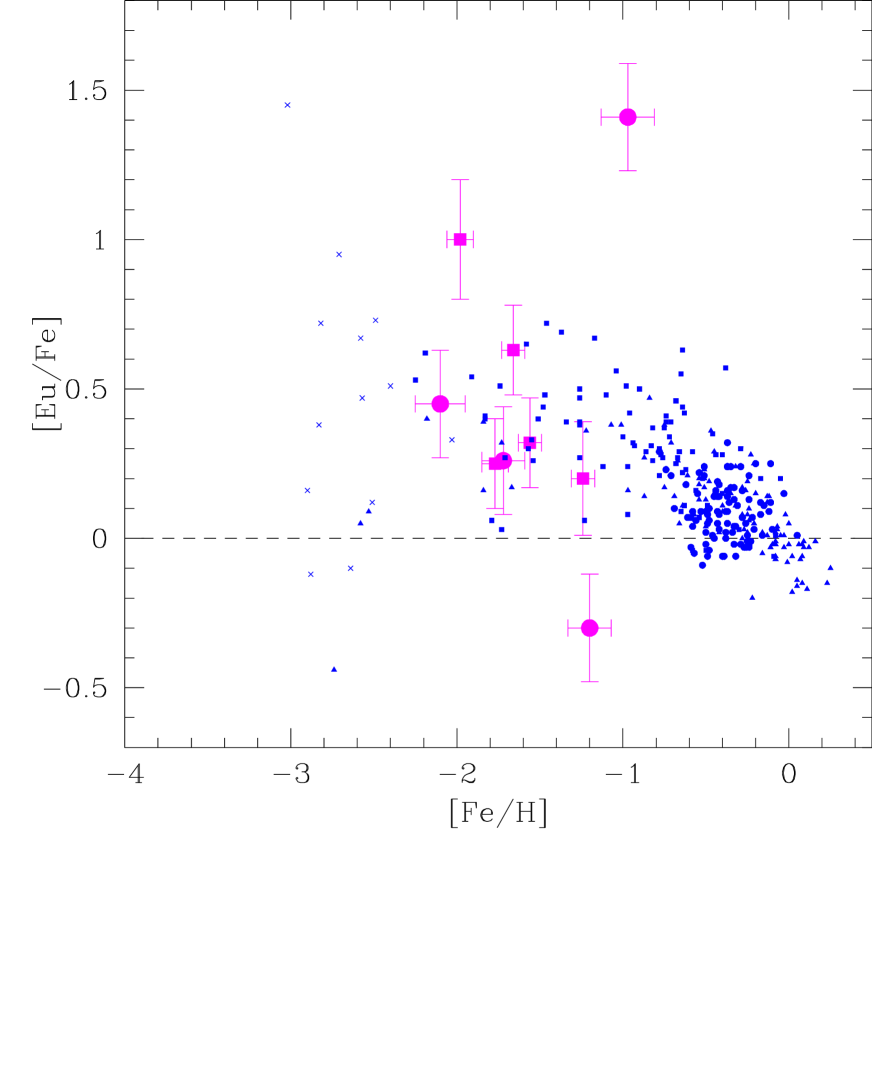
Elements heavier than Zn are known to be produced by neutron capture. The two neutron capture phenomena are the slow (s-process) capture sequence in which the time scale for beta-decay is shorter than the time scale between neutron captures and the rapid (r-process) capture sequence in which a flood of neutrons (or a burst of nuclear reactions whose results mimic neutron captures) drives the nuclei to extremely neutron-heavy isotopes which finally decay to the valley of stability. The readily observable s-process species may be divided into the light (ls) group which consists of Rb, Sr, Y, and Zr; and the heavy (hs) group which consists of Ba, La and the light rare earths. The only observable r-process element in our stars is Eu. The heavier r-process species have lines that are too weak to be measurable on our spectra. Starting with the ls elements, either Y, Zr, or both are available in 8 stars of the combined data. Ignoring for the moment the most metal-rich star (982), the mean ls abundance (using the average of Y and Zr when available) is –0.26 with a large scatter of 0.4 dex and no metallicity trend. This value is very low compared to Galactic field stars (e.g. Fulbright 2002). As shown in Figure 8, star 982 is unique, standing far above all the other stars with [Y/Fe]= 1.1. This is a heavy element star! We discuss this star in detail in Section 5. The [hs/Fe] data (taking the mean of Ba and La) scatter around a value of 0.1 with no trend, as shown in Figure 9 (omitting the heavy element star 982 which again is remarkable, as seen from this figure). With two exceptions, the Scl stars mimic their Galactic counterparts in [hs/Fe]. [Eu/Fe] (Figure 10) appears to decrease from near +0.7 at [Fe/H] to solar at [Fe/H]=–1.2, although the trend again is mainly determined by only two stars. Once again we omit the heavy element star 982 in which there is a huge excess of Eu. With the exception of these three stars, the remainder are in good agreement with the mean for similar metallicity Galactic stars.
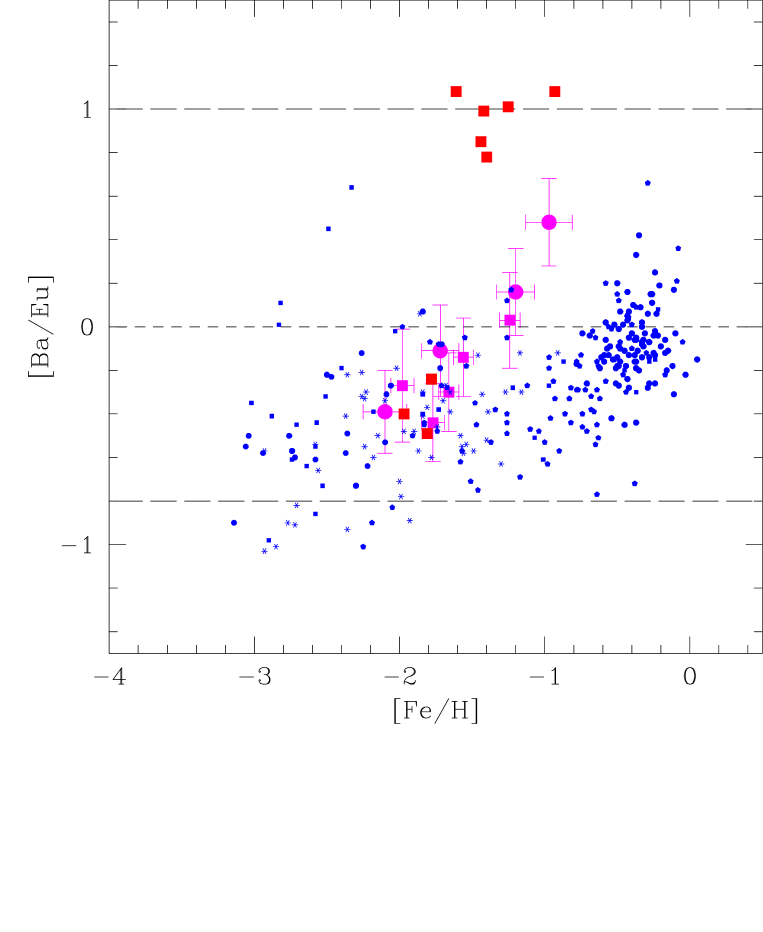
Perhaps the best discriminator of the relative importance of s-process to r-process enhancement is the behavior of [Ba/Eu] as a function of [Fe/H] . In Figure 11 we present our Scl results. The long dashed line below represents the pure r-process abundance ratio from Arlandini et al. (1999), while the long dashed line above represents the pure s-process abundance ratio. In the Galaxy, this ratio is constant at throughout the halo metallicity regime but begins to rise at [Fe/H] and reaches a solar value near [Fe/H] =–0.4, significantly above the r-process line but well below the s-process value. Scl has a unique behavior in this diagram. The most metal-poor stars follow the Galaxy . However, the stars more metal-rich than [Fe/H] =-1.5 follow an upward trend reaching to [Ba/Eu]=+0.5 at [Fe/H] =–1, some 0.8 dex above the Galactic value. Note that the heavy element star 982 does not stand out in this diagram as being unusual but only extends the trend begun by its nearest companions in metallicity .
The rise in [Ba/Eu] for Scl from Figure 11 occurs near [Fe/H]= -1.5, while in field stars no such rise is seen until [Fe/H]. In Cen, however, there is a much steeper increase between [Fe/H]= -2.0 and -1.4, as shown in Figure 11, plotted as the filled squares. Other s-process species show a similar rise in Cen (e.g. Vanture, Wallerstein, & Brown 1994, Norris & Da Costa 1995, Smith et al. 2000). In the Galaxy, note that the metal-poor stars have an r-process ratio, which gradually increases towards the s-process value as [Fe/H] increases; this reflects the increasingly important contribution to the heavy elements from AGB stars as the Galaxy evolves chemically. Cen is known to be heavily influenced in its chemical evolution by AGB stars and this is shown by the rapid increase (in terms of an increase in [Fe/H]) to a pure s-process ratio in Ba/Eu as Fe increases. The s/r-process chemical evolution in Scl appears to have been intermediate to that experienced by the Milky Way and Cen. However, note that Johnson and Bolte (2001) found that the interpretation of Ba in this metallicity range is complicated. Galactic Ba abundances from the 4554Å line can show a rise in Ba/Eu occuring at very low metallicities (around –2.0), which is very unlikely to be due to s-process enrichments since they are not matched by La/Eu enhancement. This line is not used in our analysis nor that of S03. Venn et al. (2004) showed that this Ba/Eu early rise is also seen in other dSph stars.
5 The Heavy-element Star 982
Figure 12 compares a small portion of one of the orders from the spectrum of stars 1446 (top) and 982 (bottom). Note that these stars have similar effective temperatures and Fe abundances, as evidenced by the similarity in the strengths of the FeI lines. However, note the immense strength of lines due to the s-process elements zirconium and barium, as represented by Zr I and Ba II, in the spectrum of star 982. The unusually large ratio of all species from Y to Eu relative to Fe mark Sc982 as a heavy element star. Such stars are extremely rare in our halo but several have been found now in dSphs (S01, S03). There are three types of heavy element stars. Lloyd Evans (1983) suggested that the heavy element stars in Cen were formed with their observed heavy-element excess. Many Galactic heavy-element stars, referred to as “intrinsic”, have generated their own excess heavies. The best example of such objects are the S stars which contain technetium. A third type of heavy-element star has received a dose of heavies from a now defunct companion. They are referred to as “extrinsic”, and are identified by the fact that they are spectroscopic binaries with periods near a year or somewhat greater. We have searched for the Tc I lines in the 4238-4297 Å region in Scl 982 and have not found them. Due to the heavy blending and modest S/N of the spectrum, this test is not definitive, but is indicative that we are not dealing with a recently self-polluted S or SC star. We have no information on a possible variable radial velocity of 982, but its observed velocity falls within the spread of the other stars.
Nevertheless we can derive some useful information about the star or stars that produced the heavy elements seen in Sc982. A useful spectroscopic criterion is the hs/ls ratio with the ls species represented by Y and Zr and the hs represented by Ba and La. In addition we have measured the Rb abundance which is sensitive to the neutron density during the neutron capture events that added to the heavy elements. Using our observed value of 0.6 for [hs/ls] and Figures 17 and 18 of Smith (1997), we find a neutron exposure of tau = 1.1(mb) and a log N(n) = 8.6 (cm). In addition, the ratio of 0.6 for [hs/ls] combined with the metallicity of [Fe/H]=-1 places Sc982 among the CH stars (Vanture 1992) though it does not appear to have the enhanced CH and C2 shown by CH stars. Hence it is possible that the star that produced the heavies was a CH star.
One phenomenon seen in many red giants in globular clusters (but not in field stars) is a deficiency of oxygen combined with an excess of Na, as discussed above. The enhanced Na/O ratio has been explained with proton captures by both 16O and the NeNa cycle, either within the observed red giant or by AGB stars that enriched the presently observed star. A significant enhancement of the Na/O ratio requires a temperature near 30 x 106K for the required proton captures to be effective on a reasonable timescale. The abundances of star 982 as shown in Table 5 indicate a low O/Fe when compared to other Sculptor red giants: [O/Fe]= -0.30, while the mean for the other stars is +0.300.20. The plot of [Na/Fe] versus [O/Fe] shown in Figure 4 shows no strong trend, although star 982 has the lowest [O/Fe] and largest [Na/Fe] values.
6 Summary
In this paper we have combined our new VLT plus UVES high resolution abundance data for 4 stars in the Sculptor dwarf spheroidal galaxy with similar data obtained with the same instrument for 5 stars by Shetrone et al. (2003). This extends the range of [Fe/H] covered from -2.1 to -0.97 and allows us to distinguish a number of interesting trends of various elemental abundances with Fe that were either not visible or only hinted at in the more limited dataset of S03. The most important single fact that emerges is that from oxygen to manganese many elements show a relatively constant elemental ratio [X/Fe] at the metal-poor end and then declining rapidly for [Fe/H] , or a steadily decreasing value of [X/Fe] as [Fe/H] rises from -2 to -1. The elements showing this behavior include O, Mg, Ca, Ti, Sc and Mn (while the Ba/Eu ratio increases with metallicity above [Fe/H] = –1.5). It is unique to see the same pattern for all of these elements. In particular the ratios of [O,Mg,Ca/Fe] near [Fe/H] = -2 are similar to but slightly less than their values in the Galactic halo at similar metallicity , but their decline to solar or less near [Fe/H] = -1.0 rather than at [Fe/H] = 0.0 is unique. [Sc/Fe] and [Ti/Fe] are near solar at [Fe/H] = -2 and become substantially negative at [Fe/H] = -1.
One of our prime motivations for undertaking this study was to further test the hypothesis that the halo of our Galaxy may have been accreted from dSph-like objects such as Scl, as first proposed by Searle and Zinn (1978). Our derived composition of the Scl stars does not support the suggestion that the halo of our Galaxy was formed from stars such as those now seen in Scl. This point has already been made by S01, F02, S03 and Tolstoy et al. (2003). We find that Scl stars are significantly underabundant in [ /Fe] at all metallicities with respect to typical Galactic field stars. AGB stars in Scl were more important in the chemical evolution of Scl than in the Galaxy in causing the high s-process/r-process ratios ocurring in the most metal-rich stars. Finally, we find a heavy element star, with very strong enhancement of s-process elements.
We thank Paranal Observatory for the excellent support received during our observing run, especially from T. Szeifert and G. Marconi. We would like to gratefully acknowledge M. Shetrone, E. Tolstoy, V. Hill, K. Venn, A. Kaufer and F. Primas for allowing us to access their results prior to publication. T. Richtler made valuable comments on an earlier draft. Special thanks to the referee, K. Venn, for a very helpful, thorough and constructive job which significantly improved this paper. This work is supported in part by the National Science Foundation through AST99-87374 and AST03-07534 (VVS). The contributions by GG and GW were supported by the Kennilworth Fund of the New York Community Trust. D.G. gratefully acknowledges support from the Chilean Centro de Astrofísica FONDAP No. 15010003. D.G. also kindly recognizes the warm support and constant dedication of M.E.B. C.C. thanks the French Programme National Galaxies and the Swiss National Science Foundation for financial support.
References
- Arnett, W.,D. 1996, Supernovae and Nucleosynthesis, Princeton University Press, Princeton
- (1) Arlandini, C., Kappeler, F., Wisshak, K., Gallino, R., Lugaro, M., Busso, M., & Stariero, O. 1999, ApJ, 525, 886
- (2) Baade, W. 1944, ApJ, 100, 137
- (3) Baade, W., & Swope, H. H. 1961, AJ, 66, 300
- (4) Bard, A., Kock, A., & Kock, M. 1991, A&A, 248, 315
- (5) Bessell, M. S., & Brett, J. M. 1988, PASP, 96, 247
- (6) Bessell, M. S., Castelli, F., & Plez, B. 1998, A&A, 333, 231
- (7) Biehl, D. 1976, Ph.D. thesis, Univ. Kiel
- (8) Bonifacio, P., et al. 2000, A&A, 359, 663
- (9) Bonifacio, P., & Caffau, E. 2003, A&A, 399, 1183
- (10) Bonifacio, P. Sbordone, L., Marconi, G., Pasquini, L. & Hill, V. 2004, A&A, 414, 503
- (11) Bouchard, A., Carignan, C., & Mashchenko, S. 2003, AJ, 126, 1295
- (12) Burris, D.L., Pilachowski, C.A., Armandroff, T.E., Sneden, C., Cowan, J.J., Roe, H. 2000, ApJ, 544, 302
- (13) Carignan, C., Beaulieu, S., Cote, S., Demers, S., & Mateo, M. 1998, AJ, 116, 1690
- (14) Carretta, E., Gratton, R., Cohen, J. G., Beers, T. C., Christlieb, N. 2002, AJ, 124, 481
- (15) Carpenter, J. M. 2001, AJ, 121, 2851
- (16) Charbonnel, C., Brown, J.A., Wallerstein, G., 1998, A&A, 332, 204
- (17) Charbonnel, C., do Nascimento, J., 1998, A&A, 336, 915
- (18) Charbonnel, C., & Palacios, A., 2003, Proceedings of the IAU Symposium 215 on Stellar Rotation, Eds A.Maeder & P.Eenens
- (19) Cole, A.A., Smecker-Hane, T.A., Gallagher, J.S. 2000, AJ, 120, 1808
- (20) Cottrell, P.L., & Da Costa, G.S., 1981, ApJ, 245, L79
- (21) Cunha, K., Smith, V.V., Lambert, D.L. 1998, ApJ, 493, 195
- (22) Cunha, K., Smith, V.V., Suntzeff, N., B., Norris, J.E., Da Costa, G.,S., & Plez, B. 2002 AJ 124,379
- (23) Da Costa, G.S. 1984, ApJ, 285, 483
- (24) D’Antona, F., Gratton, R., Chieffi, A., 1983, Mem.Soc.Astron.It., 54, 173
- (25) Demers, S., & Battinelli, P. 1998, AJ, 115, 154
- (26) Denisenkov, P.A., & Herwig, F., 2003, ApJ, 590, L99
- (27) Denisenkov, P.A., & Weiss, A., 2001, ApJ, 559, L115
- (28) Dolphin, A.E. 2002, MNRAS, 332, 91
- (29) Edvardsson, B., Andersen, J., Gustafsson, B., Lambert, D.L., Nissen, P.E., & Tomkin, J. 1993, A&A, 275, 101
- (30) Eggen, O.J., Lynden-Bell, D., & Sandage, A. R. 1962, ApJ, 136, 748
- (31) Fenner, Y., Campbell, S., Karakas, A.I., Lattanzio, J.C., Gibson, B.K., 2004, MNRAS, accepted, astro-ph/0406360
- (32) Freeman, K., & Bland-Hawthorn, J. 2002, ARAA, 40, 487
- (33) Fulbright, J.P. 2002, AJ, 123, 404 (F02)
- (34) Gilroy, K.K., 1989, ApJ, 347, 835
- (35) Gilroy, K.K., Brown, J.A., 1991, 371, 578
- (36) Gratton, R.G., Bonifacio, P., Bragaglia, A., Carretta, E., et al., 2001, A&A, 369, 87
- (37) Gratton, R.G., Carretta, E., Caludi, R., Lucatello, S., & Barbieri, M. 2003a, A&A, 404, 187 (G03)
- (38) Gratton, R.G. & Sneden, C. 1988, A&A, 204, 193
- (39) Gratton, R.G. & Sneden, C. 1991, A&A, 241, 541
- (40) Gratton, R.G. & Sneden, C. 1994, A&A, 287, 927
- (41) Gratton, R.G., Sneden, C., Carretta, E., Bragaglia, A., 2000, A&A, 354, 169
- (42) Grebel, E.K., 1999, in IAU Symp. 192, The Stellar Content of Local Group Galaxies, ed. P. Whitelock & R. Cannon (San Francisco: ASP), 17
- (43) Grevesse, N., & Sauval, A.J. 1999, A&A, 347, 348
- (44) Grundhal, F., Briley, M., Nissen, P.E., Feltzing, S., 2002, A&A 385, L14
- (45) Gustaffson, B., Bell, R.A., Ericksson, K., & Nordlund, A., 1975, A&A, 42, 407
- (46) Harbeck, D., Grebel, E.K., Holtzman, J., Guhathakurta, P., Brandner, W., Dolphin, A., Geisler, D., Sarajedini, A., Hurley-Keller, D., Mateo, M. 2001, AJ, 122, 3092
- (47) Herwig., F., 2004, ApJ, 605, 425
- (48) Hilker, M., & Richtler T. 2000, A&A, 362, 895
- (49) Hill, V., Barbuy, B., Spite, M., 1997, A&A, 323, 461
- (50) Holweger, H., Bard, A., Kock, A., & Kock, M. 1991, A&A, 249, 545
- (51) Hughes, J., & Wallerstein, G. 2000, AJ, 119, 1225
- (52) Hurley-Keller, D., Mateo, M., Grebel, E. 1999, ApJL, 523, 25
- (53) Ibata, R.A., Gilmore, G., & Irwin, M.J. 1994, Nature, 370, 194
- (54) Ivans, I.I., Sneden, C., Kraft, R.,P., Suntzeff, N.,B., Smith, V.V., Johnson, J.A., & Bolte, M. 2001, ApJ, 554, 888
- (55) Langer, E. & Fulbright, J.P. 1999 AJ 118,1273
- (56) Ivans, I.,I., Kraft, R.,P., Sneden,C., Rich, R., Shetrone, M. 2001 AJ 122,1438
- (57) Jehin, E., Magain, P., Neuforge, C., Noels, A., Thoul, A.A., 1998, A&A, 330, L33
- (58) Johnson, J.A. 2002, ApJS, 139, 219
- (59) Klypin, A.A., Kravtsov, A.V., Valenzuela, O., & Prada, F. 1999, ApJ, 522, 82
- (60) Kurucz, R.L. 1991, CD-ROM 23 (Cambridge:SAO)
- (61) Lawler, J.E., Bonvallet, G., & Sneden, C. 2001, ApJ, 556, 452
- (62) Lee, J.-W., & Carney, B.W. 2002, AJ, 124, 1511
- (63) Lloyd Evans, T. 1983, MNRAS, 204, 975
- (64) Lodders, K. 2003, ApJL, 591, 1220
- (65) Majewski, S.R., Siegel, M.H., Patterson, R.J., Rood, R.T. 1999, ApJL, 520, 33
- (66) Martin, G.A., Fuhr, J.R., & Wiese, W.L. 1988, Atomic Transition Probabilities: Scandium through Manganese (New York: American Chem. Soc. and AIP)
- (67) Martin, N.F., Ibata, R.A., Bellazzini, M., Lewis, G.F., & Dehnen, W. 2004, MNRAS, 348, 12
- (68) Mateo, M. 1998, ARAA, 36, 435
- (69) McWilliam, A. 1990, ApJS, 74, 1075
- (70) McWilliam, A. 1997, ARAA, 35, 503
- (71) McWilliam, A., Preston, G. W., Sneden, C., & Searle, L. 1995, AJ, 109, 2757
- (72) McWilliam, A., Rich, R.M., Smecker-Hane, T.A., 2003, ApJL, 592, 21
- (73) Melendez, J., Barbuy, B., & Spite, F. 2001, ApJ, 556, 858
- (74) Mishenina, T.,V., Kovtyukh, V.,V., Soubiran, C., Travaglio, C., & Moore, B., Ghigna, S., Lake, G., Quinn, T., Stadel, J., & Tozzi, P. 1999, ApJ, 524, 19
- (75) Busso, M., 2002 A&A, 396, 189
- (76) Monkiewicz, J., et al. 1999, PASP, 111, 1392
- (77) Nissen, P.E., & Schuster, W.J. 1997, A&A, 326, 751 (NS97)
- (78) Nissen, P. E., Chen, Y. Q., Schuster, W. J., Zhao, G. 2000, A&A, 353, 722
- (79) Nissen, P.E., Primas, F., Asplund, M., & Lambert, D.L. 2002, A&A, 390, 235
- (80) Norris, J.E., Freeman, K.C., & Mighell, K.J. 1996, ApJ, 462, 241
- (81) Norris,J.E & Da Costa, G.S 1995, ApJ, 447, 680
- (82) O’Brian, T.R., Wickliffe, M.E., Lawler, J.E., Whaling, W., & Brault, J.W. 1991, J.Opt.Soc.Am. B, 8, 1185
- (83) Parmentier, G., Jehin, E., Magain, P., Neuforge, C., Noels, A., Thoul, A.A., 1999, A&A 352, 138
- (84) Prochaska, J.X., Naumov, S.O., Carney, B.W., McWilliam, A., & Wolfe, A.M. 2000, AJ, 120, 2513 Prochaska, J., & McWilliam, A. 2000, ApJ, 537, L57
- (85) Ramirez, S.V., Cohen, J.G., Buss, J., Briley, M.M. 2001, AJ, 122, 1429
- (86) Reddy, B.E., Tomkin, J., Lambert, D.L., & Allende Prieto, C. 2003, MNRAS, 340, 304
- (87) Renzini, A. 1980, Mem. S.A.It., 51, 749
- (88) Ryan, S.G., Norris, J.E., & Beers, T.C. 1996, ApJ, 471, 254
- (89) Schweitzer, A. E., Cudworth, K. M., Majewski, S. R., & Suntzeff, N. B. 1995, AJ, 110, 2747
- (90) Searle, L., & Zinn, R. 1978, ApJ, 225, 357
- (91) Shapley, H. 1938, Nature, 142, 715
- (92) Shapley, H. 1943, Galaxies, Philadelphia: Blakiston
- (93) Shetrone, M. 2003, ApJL, 585, 45
- (94) Shetrone, M. 2004, Origin and Evolution of the Elements, from the Carnegie Observatories Centennial Symposia. Published by Cambridge University Press, Carnegie Observatories Astrophysics Series. Edited by A. McWilliam and M. Rauch, p. 220
- (95) Shetrone, M. D., Bolte, M., & Stetson, P. B. 1998, AJ, 115, 1888
- (96) Shetrone, M., D., Côté, P., & Sargent, W., L., W. 2001, ApJ, 548, ’ 592 (S01)
- (97) Shetrone, M., Venn, K., Tolstoy, E., Primas, F., Hill, V., & Kaufer, A. 2003, AJ, 125, 684 (S03)
- (98) Smecker-Hane, T.,A., McWilliam, A., 2002 astro-ph/0205411
- (99) Smith, V.V. 1997, Rev. Mod. Phys., 69, 995
- (100) Smith, V.V., Cunha, K., & King, J.R. 2001, AJ, 122, 370
- (101) Smith, V.V., Hinkle, K.H., Cunha, K., Plez, B., et al., 2002, AJ, 124, 3241
- (102) Smith, V.V., Suntzeff, N.B., Cunha, K., Gallino, R., Busso, M., Lambert, D.L., Straniero, O., 2000, AJ, 119, 1239
- (103) Sneden, C. 1973, ApJ, 184, 839
- (104) Sneden, C., & Crocker, D.A. 1988, ApJ, 335, 406
- (105) Sneden, C., Gratton, R. G., & Crocker, D. A. 1991, A&A, 246, 354
- (106) Sneden, C., Pilachowski, C., A,. & Kraft, R., P. 2000, AJ, 120, 1014
- (107) Stephens, A., & Boesgaard, A.M. 2002, AJ, 123, 1647
- (108) Suntzeff, N.B., & Kraft, R.P. 1996, AJ, 111, 1913
- (109) Tautvaisiene, G., Wallerstein, G., Geisler, D., Gonzalez, G., Charbonnel, C. 2004, AJ, 127, 373
- (110) Thevenin, F. & Idiart, T.P. 1999, ApJ, 521, 753
- (111) Tinsley, B.M. 1979, ApJ, 229, 1046
- (112) Tolstoy, E., Irwin, M.J., Cole, A.A., Pasquini, L., Gillmozzi, R., & Gallagher,J. S. 2001, MNRAS, 327, 918
- (113) Tolstoy, E., Venn, K., A., Shetrone, M., Primas, F., Hill, V., Kaufer, A., & Szeifert, T. 2003, AJ, 125, 707
- (114) Unavane, M., Wyse, R.F.G., & Gilmore, G. 1996, MNRAS, 278, 727
- (115) Vanture, A. 1992, AJ, 104, 1997
- (116) Vanture, A.D., Wallerstein, G., & Brown, J.A. 1994, PASP, 106, 835
- (117) Venn, K.A., Irwin, M., Shetrone, M.d., Tout, C.A., Hill, V., Tolstoy, E. 2004, AJ, 128, 1177
- (118) Ventura, P., D’Antona, F., Mazzitelli, I., & Gratton, R. 2001, ApJ, 550, L65
- (119) Walcher, J., Fried, J.W., Burkert, A., & Klessen, R.S. 2002, astro-ph/0207467
- (120) Weiss,A. & Charbonnel,C. 2003, in Proceedings of JD 04 at the XXIII IAU General Assembly, ed. F. D’Antona and G. Da Costa, Mem.Soc.Ast.It., 75, 347
- (121) Woolf, V.M., Tomkin, J., & Lambert, D.L. 1995, ApJ, 453, 660
- (122) Woosley, S.E., & Weaver, T.A. 1995, ApJS, 101, 181
- (123) Yanny, B., et al., 2003, ApJ, 588, 824
- (124) Yong, D., Grundhal, F., Lambert, D.L., Nissen, P.E., & Shetrone, M., 2003, A&A, 402, 985
- (125)