The galaxy-dark matter connection
Abstract:
What galaxy lives in what halo? The answer to this simple question holds important information regarding galaxy formation and evolution. We describe a new statistical technique to link galaxies to their dark matter haloes, or light to mass, using the clustering properties of galaxies as function of their luminosity. The galaxy-dark matter connection thus established, and parameterized through the conditional luminosity function, indicates the presence of two characteristic scales in galaxy formation: one at , where galaxy formation is most efficient, and another at , where a transition occurs from systems dominated by one brightest, central galaxy to systems with several dominant galaxies of comparable luminosity. We test the relation between light and mass established from galaxy clustering alone with dynamical masses obtained from satellite kinematics, and show that both are in excellent agreement. We also present a new (halo-based) galaxy-group finder, and show that the multiplicity function of galaxy groups identified in the 2dFGRS suggests a relatively high mass-to-light ratio on the scales of galaxy clusters, or, alternatively, a relatively low value of the power-spectrum normalization . These findings are also supported by our studies of pairwise peculiar velocities and satellite abundances. Finally, we directly measure the halo occupation statistics from our galaxy groups, which are a good proxy of dark matter haloes, and show that these are in excellent agreement with our conditional luminosity function model.
PoS(BDMH2004)
1 Introduction
According to the current paradigm of structure formation, galaxies form and reside inside extended cold dark matter (CDM) haloes. One of the ultimate challenges in astrophysics, therefore, is to obtain a detailed understanding of how galaxies with different physical properties occupy dark matter haloes of different masses. This link between galaxies and dark matter haloes is an imprint of various complicated physical processes related to galaxy formation, such as cooling, star formation, merging, tidal interactions, and a variety of feedback processes. Although the statistical link itself does not give a physical explanation of how galaxies form and evolve, it provides important constraints on these processes and on how their efficiencies scale with halo mass.
To quantify the relationship between haloes and galaxies in a statistical way, it has become customary to specify the so-called halo occupation distribution, , which gives the probability to find galaxies (with some specified properties) in a halo of mass . This occupation distribution can be constrained using data on the clustering properties of galaxies, as it completely specifies the galaxy bias, and has been used extensively to study galaxy occupation statistics and large scale structure (e.g., [2,9,18] and references therein).
2 The Conditional Luminosity Function
Arguably, one of the most important physical properties of a galaxy is its total luminosity. Ideally, one would therefore consider occupation statistics as a function of luminosity. In particular, this would allow a direct estimate of the average mass-to-light ratios as function of halo mass, as well as the construction of mock redshift surveys. In a series of papers [12,18], we therefore included luminosities in the halo occupation statistics by introducing the conditional luminosity function (CLF) , which gives the average number of galaxies with luminosities in the range that reside in a halo of mass . The CLF is the direct link between the galaxy luminosity function and the halo mass function , according to
| (1) |
In CDM cosmologies, more massive haloes are more strongly clustered (e.g., [6]). This means that information regarding the clustering strength of galaxies (of a given luminosity) contains information about the characteristic mass of the halo in which they reside. At sufficiently large separations, , the two-point correlation function of galaxies of luminosity is given by . Here is the dark matter mass correlation function, and is the average bias of galaxies of luminosity , which derives from the CLF according to
| (2) |
with the bias of dark matter haloes of mass . Therefore, the combination of an observed luminosity function, , plus measurements of the galaxy-galaxy two-point correlation function as function of luminosity puts stringent constraints on .
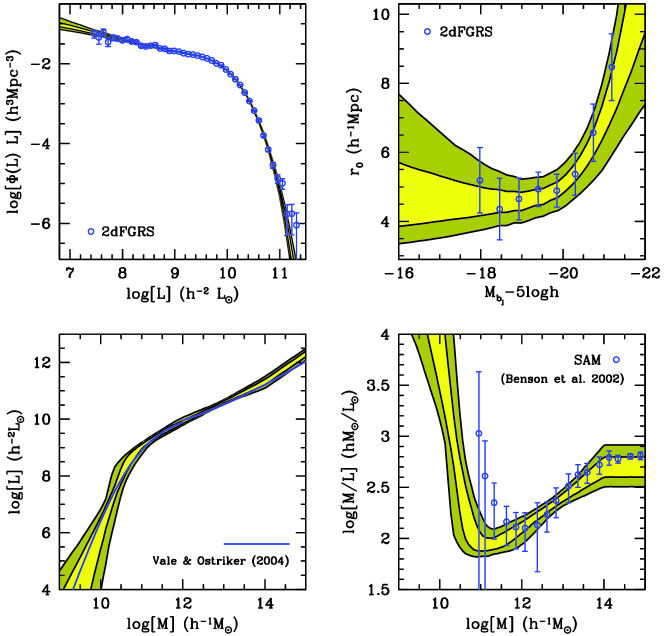
We assume that the CLF can be described by a Schechter function, and describe the mass dependencies using a total of 8 free parameters (see [12,15,18]). We use a Monte-Carlo Markov Chain (hereafter MCMC) to probe the likelihood function in our multi-dimensional parameter space, and to put confidence levels on all derived quantities. The results obtained for a CDM ‘concordance’ cosmology (, , , ) are shown in Fig. 1. The open circles with errorbars in the upper panels are the data used to constrain the models. The shaded areas indicate the 68 and 99 percent confidence levels on and computed from the MCMC. Note the good agreement with the data, indicating that the CLF can accurately match the observed abundances and clustering properties of galaxies in the 2dFGRS. We emphasize that this is not a trivial result, as the data can only be fitted for a certain combination of cosmological parameters (see [13]).
The lower left-hand panel of Fig. 1 plots the relation between halo mass and the total halo luminosity , which follows from the CLF according to
| (3) |
Note that the confidence levels are extremely tight, especially for the more massive haloes. The relation reveals a dramatic break at around , indicating a characteristic scale in galaxy formation. These results are in excellent agreement with the relation of Vale & Ostriker ([11]), obtained assuming a monotonic relation between light and mass. This agreement combined with the extremely tight confidence levels obtained from our CLF analysis suggests that we have established a robust connection between light and mass.
Finally, the lower right-hand panel of Fig. 1 plots the corresponding mass-to-light ratios as function of halo mass. The pronounced minimum in indicates that galaxy formation is most efficient in haloes with masses in the range . For less massive haloes, increases drastically with decreasing halo mass, which is required in order to bring the steep slope of the halo mass function at low in agreement with the relatively shallow faint-end slope of the observed LF. It indicates that galaxy formation needs to become extremely inefficient in haloes with in order to prevent an overabundance of faint galaxies. The increase in from to is thought to be associated with the decreasing ability of the gas to cool with increasing halo mass. The open circles with errorbars correspond to the semi-analytical model of Benson et al. ([1]), which has been tuned to match the galaxy luminosity function. It is extremely reassuring that two completely independent methods yield average mass-to-light ratios that are in such good agreement.
Because it gives a statistical description of the galaxy-dark matter connection, the CLF is an extremely powerful tool. In a series of papers we have used it to investigate large scale structure [16,19], the environment dependence of the galaxy luminosity function [7], the kinematics and abundances of satellite galaxies [14,15], and various properties of galaxy groups [20,21,22]. In addition, we have used the CLF formalism to constrain cosmological parameters [13] and to construct detailed mock redshift surveys [19]. Here we summary a few of the highlights.
3 Mock Galaxy Redshift Surveys
An important application of the CLF is the construction of mock galaxy redshift surveys (hereafter MGRSs), which are extremely useful tools to aid in the interpretation of large redshift surveys. As with any data-set, several observational biases hamper a straightforward interpretation of such surveys (e.g., Malmquist bias, redshift-space distortions, fiber collisions). The CLF is ideally suited to build up “virtual” Universes from which mock galaxy redshift surveys can be constructed using the same biases and incompleteness effects as in the real data. In [19] we have used the CLF to populate dark matter haloes in numerical simulations with galaxies of different luminosities, and constructed detailed MGRSs that can be compared on a one-to-one basis with the 2dFGRS (see also [14,15,20]).
4 Satellite Kinematics
In order to test the relation between light and mass shown in the lower left panel of Fig. 1, and which has been derived solely from the galaxy clustering properties, we use the kinematics of satellite galaxies. Since satellites probe the potential well out to the outer edges of their haloes, they are ideally suited to measure total halo masses (unlike, for example, a disk rotation curve which typically only probes the potential out to a fraction of the virial radius). A downside of using satellite galaxies, however, is that the number of detectable satellites in individual systems is generally small. One therefore typically stacks the data on many host-satellite pairs to obtain statistical estimates of halo masses (see [3] for an up-to-date review).

Previous attempts to measure the kinematics of satellite galaxies have mainly focussed on isolated spiral galaxies. Using the mock galaxy redshift surveys described above we have investigated to what extent a similar analysis can be extended to include a much wider variety of systems, from isolated galaxies to massive groups and clusters. In particular, we used our MGRSs to optimize the host-satellite selection criteria to yield large numbers of hosts and satellites, and small fractions of interlopers (satellites not physically associated with the halo of the host galaxy). We found that an iterative technique with adaptive selection criteria works best, allowing for an accurate measurement of ; see [14] for details.
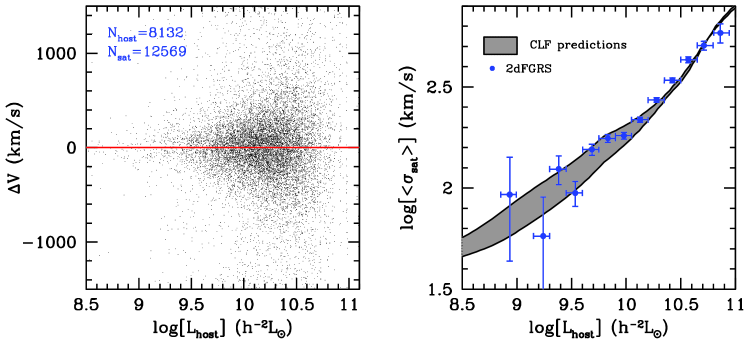
Applying our adaptive selection criteria to the 2dFGRS yields a total of 8132 host galaxies and 12569 satellite galaxies. The left-hand panel of Fig. 2 plots the velocity difference, , between host and satellite galaxies as function of host luminosity. Notice the increase of the mean with increasing . Fitting the distributions of various luminosity bins with a Gaussian plus constant (to reproduce the true satellites and interlopers, respectively), yields the relation between and shown in the right-hand panel (solid dots with errorbars). The gray area indicates the expectation values obtained from our CLF where the upper and lower boundaries outline the range of uncertainties due to the unknown second moment of the CLF (see [14] for details). Clearly, the satellite kinematics obtained from the 2dFGRS are in excellent agreement with these predictions. This provides a dynamical confirmation of the average relation between mass and light obtained from our purely statistical CLF formalism!
5 Galaxy Groups
We recently also developed a halo-based group finder that can successfully assign galaxies into groups according to their common haloes [18]. The basic idea behind our group finder is similar to that of the host-satellite selection criteria discussed above. In short, we start with an assumed mass-to-light ratio to assign a tentative mass to each potential group. This mass is used to estimate the size and velocity dispersion of the underlying halo that hosts the group, which in turn is used to determine group membership (in redshift space). This procedure is iterated until group memberships converge. Detailed tests with our MGRS show that this group finder (i) is % complete in terms of group membership, (ii) yields interloper fractions %, and (iii) yields group catalogues that are insensitive to the initial assumption of the mass-to-light ratios.
Applying this group finder to the 2dFGRS yields a catalogue of groups, of which 7251 are binaries, 2343 are triplets, and 2502 contain four members or more. Group masses, , are determined by computing the mean separation between all groups brighter than the group under consideration and matching this with the mean separation between dark matter haloes more massive than (see [20] for details).
The upper left-hand panel of Fig. 3 plots the average number of group members found as function of group mass. The dashed line indicates the true computed directly from the CLF used to construct the MGRS. The solid line shows the occupation numbers obtained from the groups selected from the MGRS using our halo-based group finder. Note the excellent agreement with the ‘input’ values, indicating that our group finder is very reliable. The dotted line indicates the group occupation statistics obtained from our 2dFGRS group catalogue. Clearly, the CLF predicts too many galaxies per group of a given mass. This is also evident from the upper right-hand panel, where the number of groups is plotted as function of the number of group members. The solid histogram and solid line indicate the results for the 2dFGRS and our MGRS, respectively. Clearly, the MGRS, which is based on our CLF, predicts too many high-multiplicity groups. To remedy this, we need to either set the average mass-to-light ratio on the scales of clusters to (compared to for our fiducial model), or has to be reduced to . This is in excellent agreement with some of our previous results based on the pairwise peculiar velocity dispersions [19] and the abundances of satellite galaxies [15].
The lower panels of Fig. 3 plot the relation between the luminosity of the brightest (central) galaxy in each group, , and the group (halo) mass, . Results are shown both for groups in the 2dFGRS (left panel) and for those in our fiducial MGRS (right panel). The mean - relation is remarkably similar for both samples, and well described by a broken power-law with at and at . At the low-mass end, this is in excellent agreement with results based on galaxy-galaxy weak lensing (e.g., [17]). At the massive end, only increases very slowly with halo mass, indicating that there must be a physical process that prevents the central galaxies in massive haloes from growing.
Finally, we want to emphasize that the groups can also be used to directly measure the halo ( group) occupation statistics. In [22] we present some of these results, and show that the CLF of 2dFGRS galaxies is perfectly consistent with a Schechter form, contrary to a recent claim by [23].
6 Conclusions
We have introduced a new statistic, the conditional luminosity function , which is ideally suited to describe the galaxy dark matter connection. The CLF is well constrained using data on the clustering properties of galaxies as function of luminosity, and yields a direct link between light and mass, which is in excellent agreement with the kinematics of satellite galaxies.
Using the CLF, we have identified two characteristic scales in galaxy formation (cf. [4]). One at , where galaxy formation is most efficient, and one at , where a transition occurs from systems dominated by one brightest, central galaxy to systems with several dominant galaxies of comparable luminosity.
Using the CLF we have also constructed detailed mock galaxy redshift surveys which can be compared on a one-to-one basis to the 2dFGRS. The main disagreements between the MGRS and the 2dFGRS concern the pairwise preculiar velocity dispersions (see [19]), the abundances of satellite galaxies (see [15]), and the group multiplicity function (see Fig. 3). These are all reflections of one and the same problem: the CDM concordance cosmology predicts too many, large groups and clusters, unless the average mass-to-light ratio of clusters in the photometric -band is (with ) or (with ). Recently, these findings have been confirmed by a similar but independent study of the galaxy clustering properties in the SDSS [10].
References
- [1] Benson A.J., Lacey C.G., Baugh C.M., Cole S., Frenk C.S., 2002, MNRAS, 333, 156
- [2] Berlind A.A., Weinberg D.H., 2002, Astrophys. J. , (5) 75 587
- [3] Brainerd T.G., 2004, preprint (astro-ph/0411244)
- [4] Dekel A., 2004, preprint (astro-ph/0401503)
- [5] Madgwick D.S., et al., 2002, MNRAS, 333, 133
- [6] Mo H.J., White S.D.M., 1996, MNRAS, 282, 347
- [7] Mo H.J., Yang X., van den Bosch, F.C., Jing Y.P., 2004, MNRAS, 349, 205
- [8] Norberg P., et al., 2002, MNRAS, 332, 827
- [9] Seljak U., 2000, MNRAS, 318, 203
- [10] Tinker J., Weinberg D.H., Zheng Z., Zehavi I., 2004, preprint (astro-ph/0411777)
- [11] Vale A., Ostriker J.P., 2004, MNRAS, 353, 189
- [12] van den Bosch F.C., Yang X.H., Mo H.J., 2003, MNRAS, 340, 771
- [13] van den Bosch F.C., Mo H.J., Yang X.H., 2003, MNRAS, 345, 923
- [14] van den Bosch F.C., Norberg P., Mo H.J., Yang X.H., 2004, MNRAS, 352, 1302
- [15] van den Bosch F.C., Yang X.H., Mo H.J., Norberg P., 2004, MNRAS, in press (astro-ph/0406246)
- [16] Wang Y., Yang X.H., Mo H.J., van den Bosch F.C., Chu Y., 2004, MNRAS, 353, 287
- [17] Yang X.H., Mo H.J., Kauffmann Guinevere, Chu Y.Q., 2003, MNRAS, 339, 387
- [18] Yang X.H., Mo H.J., van den Bosch F.C., 2003, MNRAS , 339, 1057
- [19] Yang X.H., Mo H.J., Jing Y.P., van den Bosch F.C., Chu Y.Q., 2004, MNRAS , 350, 1153
- [20] Yang X.H., Mo H.J., van den Bosch F.C., Jing Y.P., 2004, MNRAS , in press (astro-ph/0405234)
- [21] Yang X.H., Mo H.J., van den Bosch F.C., Jing Y.P., 2004, MNRAS , in press (astro-ph/0406593)
- [22] Yang X.H., Mo H.J., Jing Y.P., van den Bosch F.C., 2004, MNRAS , preprint (astro-ph/0410114)
- [23] Zheng Z., et al., 2004, Astrophys. J. , (p) reprint (astro-ph/0408564)