X-ray and Radio Monitoring of GX 3394 and Cyg X-1
Abstract
Previous work by Motch et al. (1985) suggested that in the low/hard state of GX 3394, the soft X-ray power-law extrapolated backward in energy agrees with the IR flux level. Corbel and Fender (2002) later showed that the typical hard state radio power-law extrapolated forward in energy meets the backward extrapolated X-ray power-law at an IR spectral break, which was explicitly observed twice in GX 3394. This has been cited as further evidence that jet synchrotron radiation might make a significant contribution to the observed X-rays in the hard state. We explore this hypothesis with a series of simultaneous radio/X-ray hard state observations of GX 3394. We fit these spectra with a simple, but remarkably successful, doubly broken power-law model that indeed requires a spectral break in the IR. For most of these observations, the break position as a function of X-ray flux agrees with the jet model predictions. We then examine the radio flux/X-ray flux correlation in Cyg X-1 through the use of 15 GHz radio data, obtained with the Ryle radio telescope, and Rossi X-ray Timing Explorer data, from the All Sky Monitor and pointed observations. We find evidence of ‘parallel tracks’ in the radio/X-ray correlation which are associated with ‘failed transitions’ to, or the beginning of a transition to, the soft state. We also find that for Cyg X-1 the radio flux is more fundamentally correlated with the hard, rather than the soft, X-ray flux.
guessConjecture {article} {opening}
1 Introduction
Both Cyg X-1 and GX 3394 in their spectrally hard, radio-loud states have served as canonical examples of the so-called ‘low state’ (or ‘hard state’) of galactic black hole candidates [16, 14]. In this state the X-ray spectrum is reasonably well-approximated by a power-law with photon spectral index of , with the power-law being exponentially cutoff at high energies ( keV). Such spectra have been attributed to Comptonization of soft photons from an accretion disk by a hot corona; however, it recently has been hypothesized that the X-ray spectra of hard state sources might instead be due to synchrotron and synchrotron self-Compton (SSC) radiation from a mildly relativistic jet [10, 12]. Jet models have been prompted in part by multi-wavelength (radio, optical, X-ray) observations of hard state systems.
In hard states of GX 3394, the 3–9 keV X-ray flux (in units of ) is related to the 8.6 GHz radio flux (in mJy) by [2]. This correlation was seen to hold over several decades in X-ray flux, and also to hold for two hard state epochs that were separated by a prolonged, intervening soft state outburst. It further has been suggested that the correlation is a universal property of the low/hard state of black hole binaries [5]. This specific power-law dependence of the radio flux upon the X-ray flux naturally arises in synchrotron jet models [3, 2, 12, 7], where the optically thin synchrotron spectrum, occurring above an IR spectral break, is presumed to continue all the way through the X-ray.
Interestingly, nearly 20 years ago Motch et al. (1985) [13] noted that for a set of simultaneous IR, optical, and X-ray observations of the GX 3394 hard state, the extrapolation of the X-ray power-law to low energy agreed with the overall flux level of the optical/IR data. Corbel and Fender (2002) [1] reanalyzed these observations (which did not include simultaneous radio data), as well as a set of (not strictly simultaneous) radio/IR/X-ray observations from the 1997 GX 3394 hard state. They showed that the low energy extrapolation of the X-ray power-laws, and the high energy extrapolation of the radio power-law, coincided with a spectral break in the IR.
2 Observations of GX 3394
We consider a set of ten simultaneous radio/X-ray observations of GX 3394, eight of which come from the 1997 or 1999 hard state [17, 14] and and two of which come from the 2002 hard state [8]. All X-ray observations were performed with the Rossi X-ray Timing Explorer (RXTE). Note that five of these observations are further labeled A–E, as we single these out for special discussion. A and B occurred immediately after the 1999 soft-to-hard state transition [14] and have optically thin radio spectra (). C has a very ‘inverted’ radio spectrum (see below). D has only a single radio point, and hence we cannot extrapolate its radio power-law without making further assumptions. E has the brightest X-ray flux in our sample, and is one of the brightest hard X-ray states observed in GX 3394 to date.
To analyze the X-ray spectra of these observations, RXTE response matrices were created using the software tools available in HEASOFT 5.3, which we find yield extremely good agreement between the Proportional Counter Array (PCA) and High Energy X-ray Timing Explorer (HEXTE) when fitting power-law models to the Crab pulsar plus nebula system. This is true for both the power-law normalization and slope, both of which must be determined very accurately when extrapolating over large energy ranges.
The radio data for observation E were obtained with the Australia Telescope Compact Array (ATCA) at 4.8 GHz and 8.6 GHz. The radio data for observation D were also obtained with ATCA, but only at 5 GHz. All other radio data can be found in [14].
3 A Rant on the Nature of Evil
The observations were analyzed with the Interactive Spectral In- terpretation System (ISIS) [9]. For our purposes, there are several major reasons for our use of ISIS. Data input without a response matrix (i.e., the radio data) are automatically presumed to have an associated diagonal response with one cm2 effective area and one second integration time. We convert the radio data from mJy to photon rate in narrow bands around the observation frequencies, and use this as input for the simultaneous radio/X-ray fits.
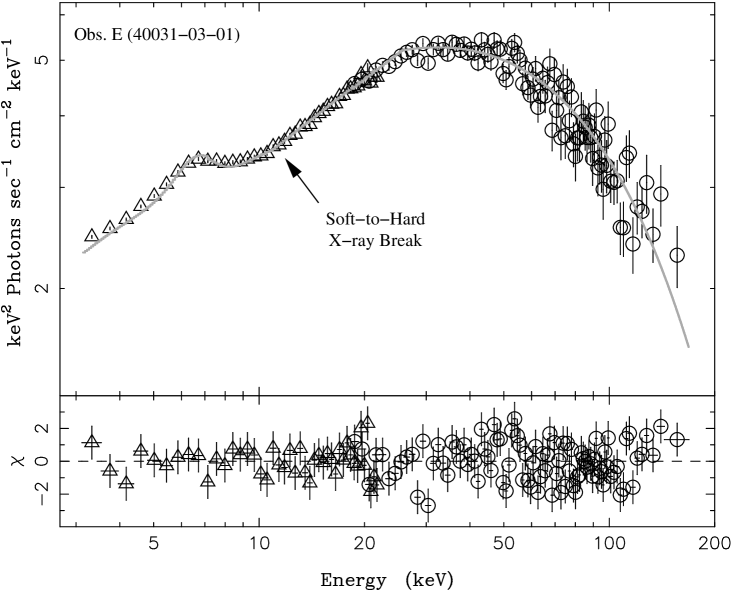
The other major reason for using ISIS is that it treats ‘unfolded spectra’ (shown in Fig. 1) in a model-independent manner. The unfolded spectrum in an energy bin denoted by is defined by: , where is the total detected counts, is the background counts, is the integrated observation time, is the unit normalized response matrix describing the probability that a photon of energy is detected in bin , and is the detector effective area at energy . Contrary to unfolded spectra produced by XSPEC, this definition produces a spectrum that is independent of the fitted model. Any unfolded spectrum should be considered something of a sin; however, ISIS unfolded spectra are only venial sins, whereas XSPEC unfolded spectra should rightly be classified as cardinal sins (dictum vel factum vel concupitum contra legem aeternam). In Fig. 1, however, the plotted residuals are those obtained from a proper forward-folded fit.
4 Radio-to-X-ray Break Energy Correlations
We obtain surprisingly good fits for nine of the ten radio/X-ray spectra using the following simple model (using the ISIS/XSPEC model definitions): absorption (the phabs model, with fixed to ) and a high energy, exponential cutoff (the highecut model) multiplying a doubly broken power-law (the bkn2pow model, with the first break being in the far IR to optical regime, and the second break being constrained to the 9–12 keV regime) plus a gaussian line (with energy fixed at 6.4 keV). When considering just the X-ray spectra, a singly broken power-law fits all ten spectra, with better results than any of the Comptonization models that we have tried.

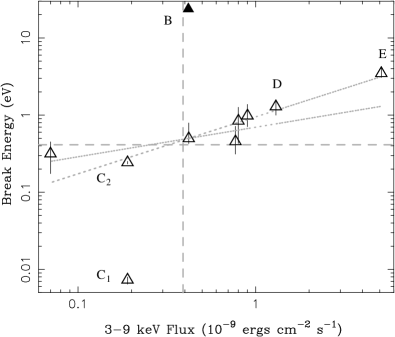
In Fig. 2 we show the fitted radio-to-X-ray break location as a function of 3–9 keV integrated flux. We also show in this figure the approximate integrated 3–9 keV flux and the IR break location for the 1997 observation discussed by Corbel and Fender (2002) [1]. For our GX 3394 observations of comparable 3–9 keV flux, the doubly broken power-law models do indeed produce a break in the IR. The model fits presented here have predicted radio-to-X-ray breaks ranging all the way from the far IR to the blue end of the optical (and into the X-ray, if one also considers observation B, which has an ‘optically thin’ radio spectrum).
The data point labeled , with a break in the far IR, has an extremely ‘inverted’ radio spectrum (). This drives the fitted break to low energies, and hence leads to deviations from the overall observed trends shown in Fig. 2. Such an inverted spectrum is very unlikely to be intrinsic to the radio jet, and is most likely a signature of free-free absorption at low frequencies [4]. If we instead consider only the highest observed radio frequency (8.6 GHz, which is likely less affected by free-free absorption), and fix the radio spectral slope at this point to , similar to the other observations, we obtain an IR break frequency (labeled ) that is consistent with the other inferred breaks.
To assess the correlation of radio-to-X-ray break energy with integrated X-ray flux, we exclude the data points from observation C (likely free-free absorbed), observation B (which has an optically thin radio spectrum), and observation D (which is consistent with the trends if we assume a radio slope of ). A regression fit to the remaining six data points suggests that the radio-to-X-ray break energy, in eV, scales with the 3–9 keV integrated flux as .
Using the scale invariance Ansatz to describe the jet physics [7, 6], we show elsewhere [15] that the predicted scaling between the integrated X-ray synchrotron flux and the radio-to-X-ray break frequency where the jet becomes optically thin to synchrotron self-absorption scales as , where is the power-law index of the electron spectrum, and we have used for the X-ray spectral slope from standard synchrotron theory. For the usual range of of synchrotron spectra, we obtain to . This prediction is flatter than the observed dependence of extrapolated break frequency upon X-ray flux. However, if one also excludes the highest flux point, then the scaling becomes more consistent with the jet synchrotron prediction, i.e., (Fig. 2).
5 Radio/X-ray Correlations in Cyg X-1
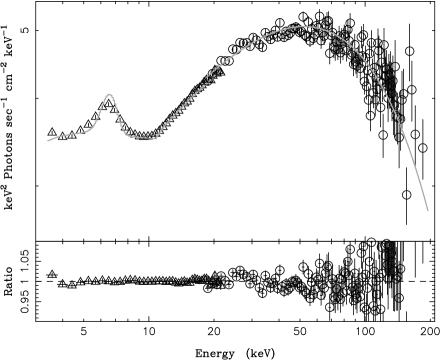
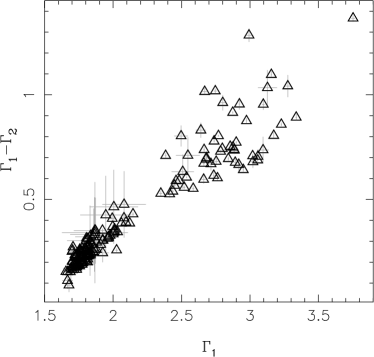
We now turn to radio/X-ray observations of Cyg X-1 [16, 5]. Again, these spectra are remarkably well-fit by a simple, exponentially cutoff broken power-law (Fig. 3). The degree of the break here indicates that the broken power-law models are not simply mimicking reflection, but are suggesting two separate continuum components. In fact, the correlation between the soft X-ray slope and the hard minus soft X-ray slope is more pronounced than any correlation between reflection fraction and spectral slope (Fig. 3). We shall elaborate upon these point further in an upcoming paper (Wilms et al., in prep.).
The associated radio data are 15 GHz observations performed at the Ryle Telescope, Cambridge (UK) [16]. (These are single channel observations, so a radio spectral slope cannot be determined.) Most of these observations have occurred simultaneously with pointed RXTE observations [16], and nearly all have very good contemporaneous coverage by the RXTE All Sky Monitor (ASM).
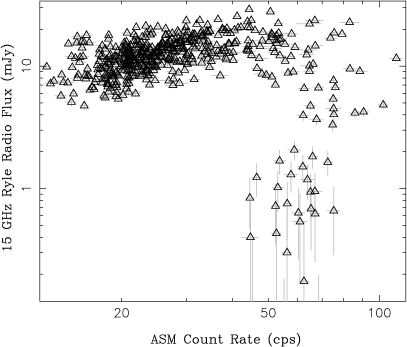
In Fig. 4 we plot the daily average ASM count rate vs. the daily average 15 GHz flux. Ranging from approximately 10–50 cps in the ASM there is a clear log-linear correlation between the radio flux and the ASM count rate. As for GX 3394, the radio flux rises more slowly than the ASM count rate ( scales approximately as the 0.8 power of the ASM count rate). Cyg X-1, however, shows much more scatter in the amplitude of the correlation than does GX 3394.
As noted elsewhere [5], there is a sharp roll-over for higher ASM count rates. However, one can clearly discern on the shoulder of this roll-over (i.e., the upper right corner of Fig. 4) four ‘spokes’, consisting of 2–5 data points each. In these spokes, the radio/X-ray correlation appears to hold to high count rates. We have confirmed [15] that each of these times are associated with ‘failed transitions’ to the soft state [16], except for the lowest amplitude of these spokes, which occurs immediately preceding a prolonged soft state outburst.
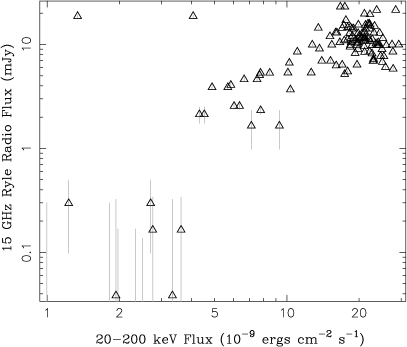
In Fig. 4 we also plot the daily average ASM count rate vs. the 20–200 keV flux from our pointed RXTE observations taken during the same 24 hour period [16]. We see that hard X-ray/ASM correlation traces a similar pattern to the radio/ASM correlation. Indeed, when we plot the hard X-ray flux vs. the daily average radio flux we obtain a log-linear relationship, as shown in Fig. 4. In Cyg X-1, the radio flux density appears fundamentally to be tied to the hard X-ray emission.
6 Summary
We have considered ten simultaneous RXTE/radio hard state observations of GX 3394, and over one hundred RXTE/radio observations of Cyg X-1. We have fit the former spectra with a very simple, but remarkably successful, phenomenological model consisting of a doubly broken power-law with an exponential roll-over plus a gaussian line. For GX 3394, the break between the radio and soft X-ray power-laws occurs in the IR to optical range, in agreement with prior work [13, 1]. In contrast to prior works, we have fit the X-ray data in ‘detector space’ and provided a quantitative assessment of the extrapolated break location.
The scaling of the radio-to-X-ray break location with integrated X-ray flux agrees reasonably well with predictions of jet models wherein a large fraction of the soft X-ray flux is due to synchrotron emission from the jet. At least some fraction of the observed soft X-rays may be attributable to emission from the jet, as opposed to disk or corona. On the other hand, we have evidence in the Cyg X-1 failed state transitions and soft state transition, that the correlation between radio flux and integrated X-ray flux can take on different amplitudes during different hard state episodes. There is also evidence in Cyg X-1 that the radio/X-ray correlation is more fundamental to the hard X-ray band. In jet models, this band, which essentially encompasses the third, highest energy, power-law component in our model fits (and also encompasses the exponential cutoff), is possibly attributable to the synchrotron self-Compton (SSC) emission from the base of the jet [12, 11]. It is therefore quite reasonable to expect a strong coupling between the radio and hard X-ray flux; however, these models are more complex than simple pure synchrotron models, and are only now beginning to be explored quantitatively [12, 11].
The results presented here suggest, at the very least, some obvious observational strategies. Given the break energy correlations, it would be extremely useful to have not only a radio amplitude for each X-ray observation, but also a radio slope. Furthermore, the predicted break for the brightest observation of GX 3394, E, occurs in the blue end of the optical. Thus, ideally multi-wavelength observations would consist of radio, broad band X-ray, and IR through optical coverage. This is an admittedly difficult task, but BHC are demonstrating via spectral correlations that all these energy regimes are fundamentally related to activity near the central engine.
Finally, it is important to obtain multi-wavelength observations of multiple episodes of each of the spectral states. For example, if there are indeed ‘parallel tracks’ in the radio/X-ray correlations, it would be interesting to determine whether the amplitude of the radio/X-ray correlation is related to the flux at which the outbursting source transits from the low/hard to high/soft state. If such observations can be made with more quantitative detail, we will have vital clues to determining the relative contributions of coronae and jets, and the coupling between these two components, for black hole binary systems.
Acknowledgements.
This talk later evolved into the paper cited as Nowak et al. (2004). I would therefore like to thank my coauthors, J. Wilms, S. Heinz, G. Pooley, K. Pottschmidt, and S. Corbel. It is also a pleasure to acknowledge useful conversations with Sera Markoff and Jeroen Homan. This work has been supported by NASA grants SV3-73016 and GO4-5041X, and NSF grant INT-0233441.References
- [1] Corbel, S. and R. P. Fender: 2002, ‘Near-Infrared Synchrotron Emission from the Compact Jet of GX 3394’. ApJ 573, L35–L39.
- [2] Corbel, S., M. A. Nowak, R. P. Fender, A. K. Tzioumis, and S. Markoff: 2003, ‘Radio/X-ray correlation in the low/hard state of GX 3394’. A&A 400, 1007–1012.
- [3] Falcke, H. and P. L. Biermann: 1995, ‘The jet-disk symbiosis. I. Radio to X-ray emission models for quasars.’. A&A 293, 665–682.
- [4] Fender, R. P.: 2001, ‘Powerful jets from black hole X-ray binaries in low/hard X-ray states’. MNRAS 322, 31–42.
- [5] Gallo, E., R. P. Fender, and G. G. Pooley: 2003, ‘A universal radio-X-ray correlation in low/hard state black hole binaries’. MNRAS 344, 60–72.
- [6] Heinz, S.: 2004, ‘Constraints on the role of synchrotron X-rays from jets of accreting black holes’. MNRAS. in press (astro-ph/0409029).
- [7] Heinz, S. and R. A. Sunyaev: 2003, ‘The non-linear dependence of flux on black hole mass and accretion rate in core-dominated jets’. MNRAS 343, L59–L64.
- [8] Homan, J., M. Buxton, S. Markoff, C. Bailyn, E. Nespoli, and T. Belloni: 2004, ‘Multi-wavelength Observations of the 2002 Outburst of GX 3394: Two Patterns of X-ray Optical/Near Infrared Behavior’. ApJ. submitted.
- [9] Houck, J. C. and L. A. Denicola: 2000, ‘ISIS: An Interactive Spectral Interpretation System for High Resolution X-Ray Spectroscopy’. In: ASP Conf. Ser. 216: Astronomical Data Analysis Software and Systems IX, Vol. 9. p. 591.
- [10] Markoff, S., H. Falcke, and R. Fender: 2001, ‘A jet model for the broadband spectrum of XTE J1118+480: optically thin synchrotron X-rays in the Low/Hard spectral state’. ApJ 372, L25–L28.
- [11] Markoff, S. and M. Nowak: 2004, ‘Constraining X-ray Jet Models with Reflection’. ApJ 609, 972–976.
- [12] Markoff, S., M. Nowak, S. Corbel, R. Fender, and H. Falcke: 2003, ‘Exploring the role of jets in the radio/X-ray correlations of GX 3394’. A&A 397, 645–658.
- [13] Motch, C., S. A. Ilovaisky, C. Chevalier, and P. Angebault: 1985, ‘An IR, optical and X-ray study of the two state behaviour of GX 3394’. Space Sci. Rev. 40, 219.
- [14] Nowak, M. A., J. Wilms, and J. B. Dove: 2002, ‘Coronal-temporal correlations in GX 3394: Hysteresis, Possible Reflection Changes, and Implications for ADAFs’. MNRAS 332, 856–878.
- [15] Nowak, M. A., J. Wilms, S. Heinz, G. Pooley, K. Pottschmidt, and S. Corbel: 2004, ‘Is the ‘IR Coincidence’ Just That?’. ApJ. submitted.
- [16] Pottschmidt, K., J. Wilms, M. A. Nowak, G. G. Pooley, T. Gleissner, W. A. Heindl, D. M. Smith, R. Remillard, and R. Staubert: 2003, ‘Long Term Variability of Cyg X-1 (1998 to 2001) I. Systematic spectral-temporal correlations in the hard state’. A&A 407, 1039–1058.
- [17] Wilms, J., M. A. Nowak, J. B. Dove, R. P. Fender, and T. di Matteo: 1999, ‘Low Luminosity states of the black hole candidate GX 3394. I. ASCA and simultaneous radio/RXTE observations’. ApJ 522, 460–475.