Detection of Two Massive CO Systems in 4C 41.17 at z = 3.8
We have detected CO(43) in the =3.8 radio galaxy 4C 41.17 with the IRAM Interferometer. The CO is in two massive (M⊙) systems separated by 18 (13 kpc), and by 400 in velocity, which coincide with two different dark lanes in a deep Ly image. One CO component coincides with the cm-radio core of the radio galaxy, and its redshift is close to that of the He II 1640 AGN line. The second CO component is near the base of a cone-shaped region southwest of the nucleus, which resembles the emission-line cones seen in nearby AGN and starburst galaxies. The characteristics of the CO sources and their mm/submm dust continuum are similar to those found in ultraluminous IR galaxies and in some high- radio galaxies and quasars. The fact that 4C 41.17 contains two CO systems is further evidence for the role of mergers in the evolution of galaxies at high redshift.
Key Words.:
Galaxies: individual: 4C 41.17 – galaxies: active – galaxies: formation – radio lines: galaxies1 Introduction
Because of its luminosity and large angular extent, 4C 41.17 has become the most studied high redshift radio galaxy (HzRG). HST images show that its host galaxy contains several star-forming components, including (i) a linear radio-aligned feature with spectroscopic characteristics of a young stellar population (Dey et al., 1997), (ii) a clumpy system, separate from the radio source, and (iii) low surface brightness UV emission extending over 70 kpc (van Breugel et al., 1999). The entire system is embedded in a giant Ly halo (Reuland et al., 2003) and diffuse soft X-ray emission (Scharf et al., 2003). In spite of the detection of its dust emission (Dunlop et al., 1994; Chini & Krügel, 1994), searches for molecular gas have been unsuccessful up to now (Ivison et al., 1996; Evans et al., 1996; Barvainis & Antonucci, 1996; Scoville, Yun, & Bryant, 1996). In this letter, we report the first detection of two massive CO components near the centre of this large forming galaxy111We adopt H0=71 km s-1 Mpc-1, =0.27 and =0.73. At =3.8, the luminosity distance =34.4 Gpc, and 1″ corresponds to 7.2 kpc..
2 Observations and data reduction
We observed 4C 41.17 at 3.1 and 1.2 mm with the IRAM Plateau de Bure Interferometer in its compact configuration between 1999 August and 2003 August. The spectral correlator covered a bandwidth of 580 MHz at each frequency. At 3.1 mm, the 6-antenna equivalent on-source observing time was 29 h, and the beam was at PA 107°. The central frequency was initially tuned to 96.090 GHz to observe CO(43) ( GHz, but later re-centred to 96.250 GHz to better cover the detected line. After phase and amplitude calibration, we merged the data at different centre frequencies into a data-set of 36 channels of 20 MHz each. As a result, the outer 7 channels on each end have 0.9 mJy compared to 0.6 mJy in the central ones. In the final data cube, the zero point of the velocity scale is 96.093 GHz, corresponding to , the redshift of the He II 1640 line (Dey et al., 1997). We made naturally weighted maps using the 𝒜ℐ𝒫𝒮 task IMAGR, with CLEANing applied only to the velocity-integrated maps.
We observed simultaneously at 1.2 mm (241.453 GHz DSB) to study the dust continuum. We used only 1.2 mm data taken with a precipitable water vapour content mm, which gave a usable on-source observing time of 7.7 h, and an rms noise of 0.8 mJy/beam. The 1.2 mm beam was at PA 100°, but we convolved the image with a 3030 Gaussian.
In 2004 March, we also observed the 4C 41.17 field at 1.2 mm (250 GHz) with the 117-element MPIfR Millimeter Bolometer array (MAMBO-2; Kreysa et al., 1998) at the IRAM 30m telescope. The beam FWHM is 107 with an array size of 4′. We made eight on-the-fly maps, with 41 subscans of 40 s each, while chopping the secondary mirror in azimuth at 2 Hz by 39, 42, or 45″. We reduced the data using MOPSIC (Zylka, 1998). The map covers 3′3′ with an rms noise of 0.8 mJy.
| Parameter | Red component | Blue component | Total |
|---|---|---|---|
| RA(J2000)a (peak) | 6h50m5224 | 6h50m5212 | 6h50m5217 |
| DEC(J2000)a (peak) | 41°30′316 | 41°30′303 | 41°30′309 |
| [Jy ] | |||
| Central velocity b [] | 285100 | ||
| Velocity width [] | 1000150 | ||
| (43) [Kpc2] | 4.4 | 2.2 | 6.7 |
| M(H2) [M⊙] | 3.6 | 1.8 | 5.4 |
-
a
Positional uncertainty 003 in RA and 03 in DEC
-
b
Relative to 96.093 GHz ( =3.79786).
3 Results
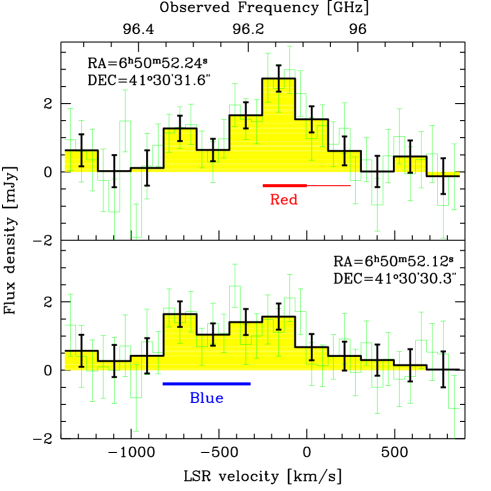
Figure 1 shows CO(43) spectra at two positions. No line emission is detected in the range 1550 to 1000 and +250 to +800 to 0.75 mJy (3). In these outer channels, we find a marginal continuum emission at 0.3 mJy, which is consistent with the 11 mJy at 850 m (Ivison et al., 2000) and 3.8 mJy at 1.2 mm (our MAMBO map) extrapolated to 3.1 mm (0.2 mJy), and the non-thermal contribution of 0.2 mJy (over the 13″ source), extrapolated from 6.4 mJy at 2 cm (Chambers et al., 1990) and 2.7 mJy at 1.2 cm (Ivison et al., 1996). Because of these low values (below the first contour in Fig. 2), we do not correct the CO fluxes for the continuum.
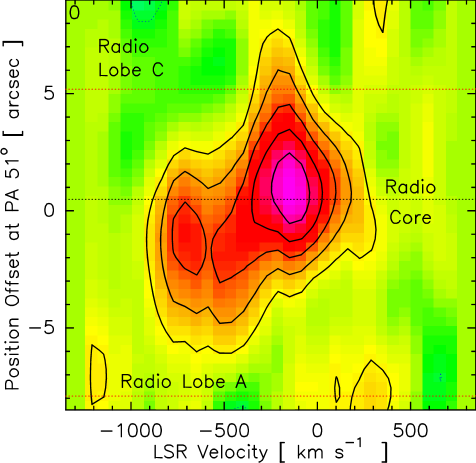
The position-velocity slice (Fig. 2) shows that the CO emission has two components: (i) a ’red’ component at 130 relative to =3.79786, and (ii) a ’blue’ component at 550. Figure 3 shows the integrated red and blue components222To increase S/N, the red component in Fig. 3 covers only the brightest 250, indicated by the thick bar in Fig. 1 (top)., separated by 18 (13 kpc projected). Table 1 lists the observed parameters, the line luminosity (43), and the molecular gas mass M(H2), calculated assuming a constant brightness temperature from CO(43) to CO(10) and a conversion factor =0.8 M⊙(Kpc2)-1 derived for local ultraluminous infrared galaxies (Downes & Solomon, 1998).
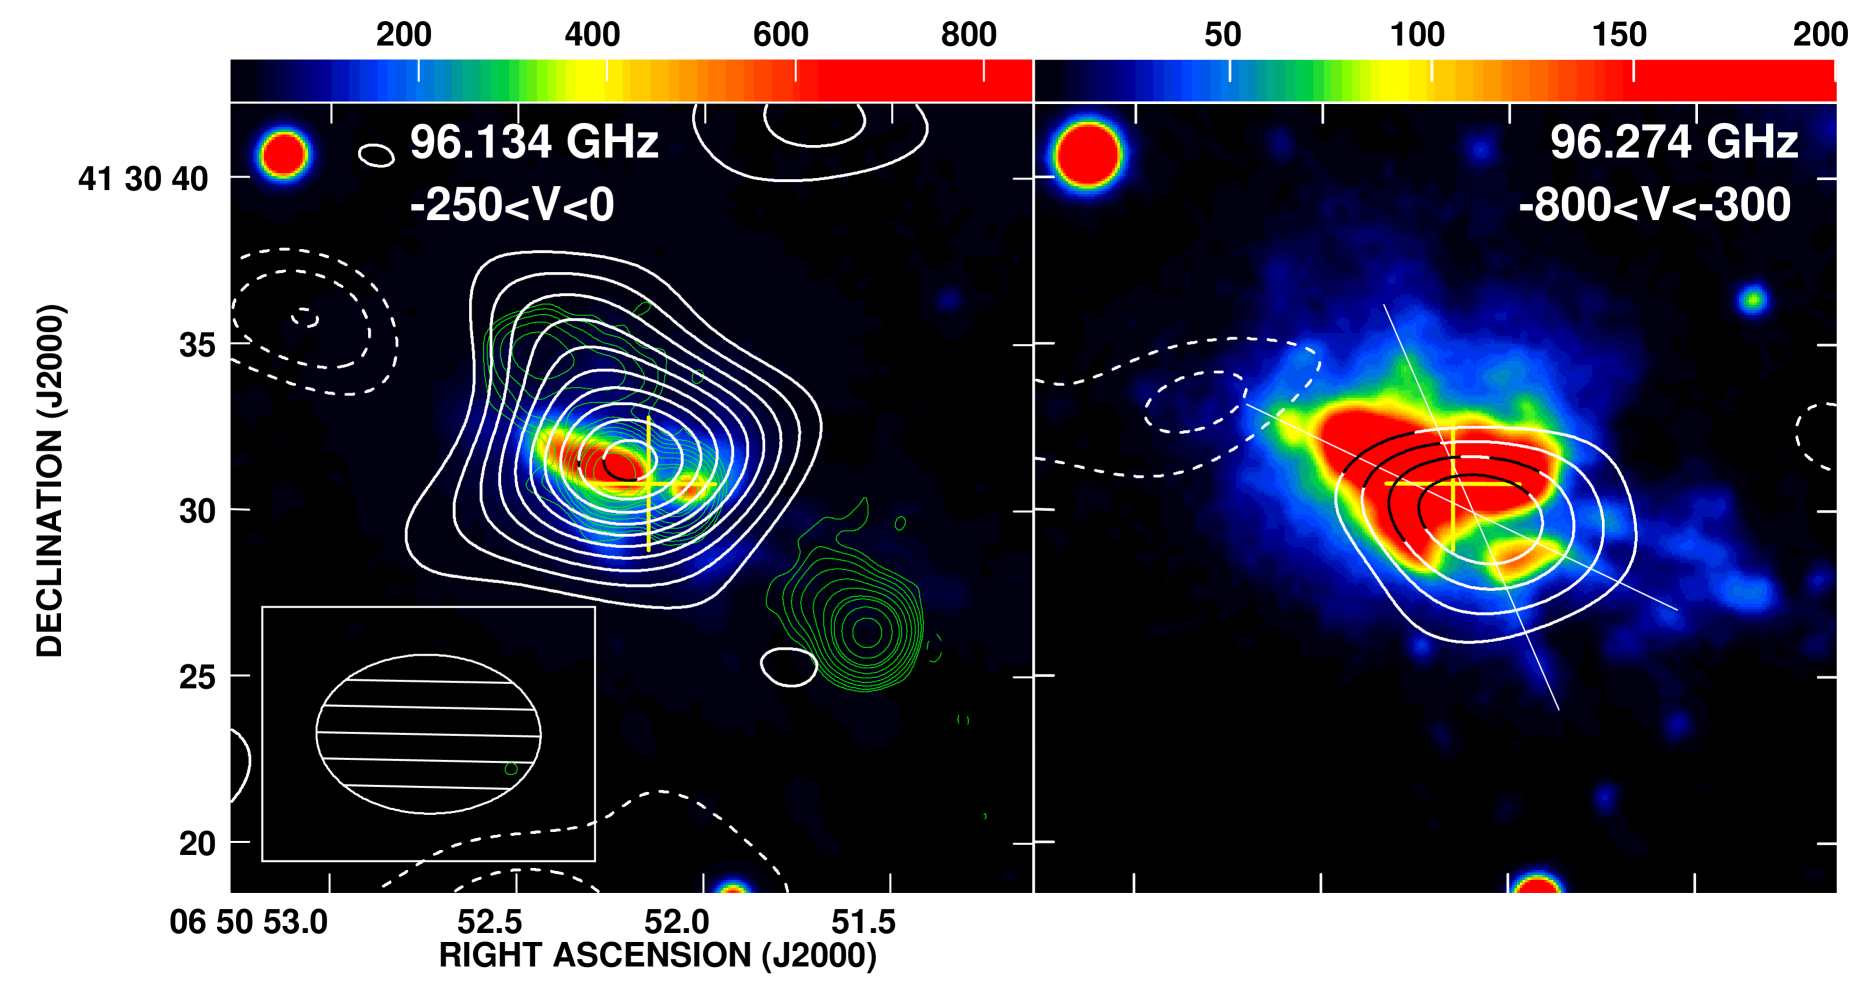
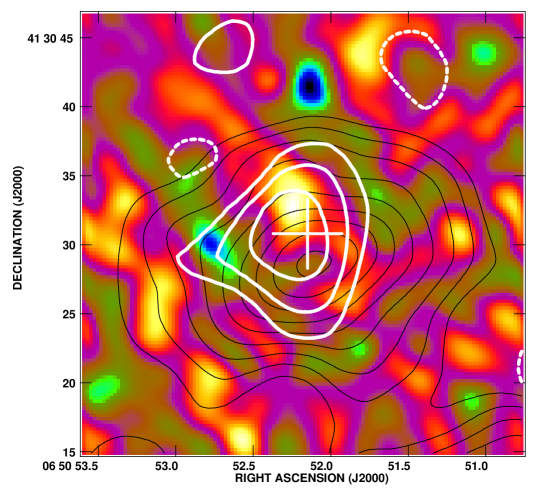
Figure 4 shows three maps of the dust continuum in 4C 41.17. Unlike the solid 10 and 5 detections in the 850 m SCUBA and 1.2 mm MAMBO maps, our 1.2 mm interferometer map shows a 4.3 peak at 06h50m5224, +41°30′319 (J2000; i.e. at the red CO component) only after convolution with a 30 Gaussian. This PdBI map yields a flux mJy, consistent with the mJy from the MAMBO map. The S/N in our 1.2 mm maps is insufficient to constrain the spatial extent of the thermal dust emission reported by Ivison et al. (2000) and Stevens et al. (2003).
Both CO components are gas-rich systems with M⊙ (Table 1). Their projected separation of 13 kpc and apparent relative velocity of 400 imply a combined dynamical mass of M⊙, an order of magnitude smaller than the typical baryonic mass of HzRGs integrated over 64 kpc (Rocca-Volmerange et al., 2004).
We associate the red CO component with the AGN because: (i) it agrees within the uncertainties, with the cm-radio core position (Carilli, Owen, & Harris, 1994) and the hard X-ray point source (Scharf et al., 2003), (ii) it coincides with the central dark lane seen in the Ly image (Fig. 3, left, near the cross) and the HST band image (Bicknell et al., 2000), and (iii) it has the same velocity offset as the low-ionization interstellar absorption lines in the deep Keck spectrum of Dey et al. (1997). The CO redshift of 3.79580.0008 is thus likely to be the real systemic redshift of the host galaxy of 4C 41.17.
The blue CO component peaks at the position of a second apparent dark lane in the Ly image (Fig. 3, right), which suggests that the Ly may be absorbed by dust of another kinematic system, associated with this CO. This apparent Ly absorption lane is in a region which resembles the emission-line cones seen, although on smaller scales (a few kpc), in some nearby AGN (e.g. Cygnus A; Canalizo et al., 2003) as well as in starburst galaxies (e.g. Veilleux & Rupke, 2002).
4 Discussion and Conclusions
What is the relation between the molecular CO-gas, the dust, the Ly halo, and the massive forming galaxy with its radio-loud AGN? Our CO velocity profile (Fig. 2) shows a remarkable similarity to the Ly velocity profile of Dey (1999). Both the CO and Ly are split into two components, separated by a projected distance of 13 kpc, and by 400 . This suggests that the Ly emission may also come from two separate components (rather than a single component split by an associated H I absorber). However, Ly traces much less dense gas ( 17–150 cm-3; Villar-Martín et al., 2003) than CO, which must have a density of 103 to 104cm-3 to have enough CO-line opacity to give a typical brightness temperature of order 30 K. Hence, the CO and Ly may originate from the same gas-rich systems, but they do not necessarily trace the total extent of these regions. This is obvious from the 200 kpc spatial extent of the Ly, while the CO emission is unresolved with our 6″ (43 kpc) beam. If fact, we can put even stronger constraints on the size of the CO-line sources, using some basic assumptions.
The FIR dust luminosity of 4C41.17 is very high, L⊙, a value typical of an ultraluminous starburst. The FIR fluxes, including our new continuum data points at 3.1 and 1.2 mm, imply a dust temperature of K, in agreement with earlier values (Benford et al., 1999; Scharf et al., 2003). Although the mm/sub-mm continuum is optically thin, the CO lines are not, so the observed brightness temperature of the CO will be about the same as the gas temperature. The existing interferometer CO maps of ULIRGs, the only nearby objects with comparable FIR luminosity, show that the brightness temperatures of the low-J CO lines are comparable with the FIR dust temperature (Downes & Solomon, 1998). Indeed, for high- CO detections even to be possible, the gas must have a significant brightness temperature, typically 30 to 50 K, over several hundred pc. For 4C41.17, this means that if the CO(43) brightness temperature is 30 K, then the observed CO(43) luminosity (Table 1) implies a CO source diameter = of 1.4 to 1.8 kpc, or 02 to 025.
This size and H2 mass imply a hydrogen column density of order cm-2, which is consistent with the observed mm-FIR dust spectrum becoming opaque near restframe 100 m. Applying the Stefan-Boltzmann formula with the derived CO source diameter 1.6 kpc and dust temperature then yields 1013 L⊙, similar to the observed value. The CO source size is also roughly consistent with the total mass and typical density of the CO gas (103 to 104cm-3), which imply source sizes of order 1 kpc, depending on geometry. Note that these are maximum sizes of the CO. If one assumes the CO is in more than two sources, then each component will have a smaller size. We also note that our observations are insensitive to more widely distributed, cooler CO.
The only known place where such high gas densities over such dimensions are found are the circumnuclear disks observed in ULIRGs and some quasars. The ‘red’ CO source in 4C41.17 thus finds a natural interpretation as a circumnuclear starforming disk around the radio-loud AGN. The fact that there appears to be a second such CO source, 13 kpc away, separated by 400 in velocity, that also contains about the same mass of molecular gas, suggests the AGN and possibly starburst activity may have been triggered by the interaction of the two objects. The absence of UV/optical continuum signatures of starburst activity at the position of the blue CO component remains surprising. A possible explanation could be that this starburst has not yet reached its peak UV/optical emission (Haas et al., 2003).
To summarize: our observations indicate that the 4C 41.17 system contains two massive CO components, each of which may be associated with an obscured black hole. This is remarkably similar to the two CO systems in 4C 60.07 (Papadopoulos et al., 2000; Greve, Ivison, & Papadopoulos, 2004). There are three other HzRGs, 6C 1909+72, B3 J2330+3927 and TN J0120+1320 with detected CO (Papadopoulos et al., 2000; De Breuck et al., 2003a, b). It will be of interest to determine if they are also double sources in CO, which would further indicate the role of mergers in triggering AGN activity in the most massive galaxies at high redshift.
Acknowledgements.
IRAM is supported by INSU/CNRS (France), MPG (Germany) and IGN (Spain). The work by WvB and MR was performed at IGPP/LLNL under the auspices of the U.S. Department of Energy, National Nuclear Security Administration by the University of California, Lawrence Livermore National Laboratory under contract No. W-7405-Eng-48. This work was carried out in the context of EARA, the European Association for Research in Astronomy.References
- Barvainis & Antonucci (1996) Barvainis, R. & Antonucci, R. 1996, PASP, 108, 187
- Benford et al. (1999) Benford, D., Cox, P., Omont, A., Phillips, T., & McMahon, R. 1999, ApJ, 518, L65
- Bicknell et al. (2000) Bicknell, G., Sutherland, R., van Breugel, W., Dopita, M., Dey, A., & Miley, G. 2000, ApJ, 540, 678
- Canalizo et al. (2003) Canalizo, G., Max, C., Whysong, D., Antonucci, R., & Dahm, S. 2003, ApJ, 597, 823
- Carilli, Owen, & Harris (1994) Carilli, C., Owen, F., & Harris, D. 1994, AJ, 107, 480
- Chambers, Miley, & van Breugel (1990) Chambers, K., Miley, G., & van Breugel, W. 1990, ApJ, 363, 21
- Chini & Krügel (1994) Chini, R. & Krügel, E. 1994, A&A, 288, L33
- De Breuck et al. (2003a) De Breuck, C., et al. 2003a, A&A, 401, 911
- De Breuck et al. (2003b) De Breuck, C., et al. 2003b, New Astron. Rev., 47, 285
- Dey et al. (1997) Dey, A., van Breugel, W., Vacca, W., & Antonucci, R. 1997, ApJ, 490, 698
- Dey (1999) Dey, A. 1999, ASP Conf. Ser. 193: The Hy-Redshift Universe: Galaxy Formation and Evolution at High Redshift, ed. A.J. Bunker & W.J.M. van Breugel, (ASP: San Francisco) 34
- Downes & Solomon (1998) Downes, D., & Solomon, P. 1998, ApJ, 507, 615
- Dunlop et al. (1994) Dunlop, J., Hughes, D., Rawlings, S., Eales, S., & Ward, M. 1994, Nature, 370, 347
- Evans et al. (1996) Evans, A., et al. 1996, ApJ, 457, 658
- Greve, Ivison, & Papadopoulos (2004) Greve, T., Ivison, R., & Papadopoulos, P. 2004, A&A, 419, 99
- Haas et al. (2003) Haas, M., et al. 2003, A&A, 402, 87
- Ivison et al. (1996) Ivison, R., Papadopoulos, P., Seaquist, E., & Eales, S. 1996, MNRAS, 278, 669
- Ivison et al. (2000) Ivison, R., Dunlop, J., Smail, I. et al. 2000, ApJ, 542, 27
- Kreysa et al. (1998) Kreysa, E., et al. 1998, Proc. SPIE, 3357, 319
- Papadopoulos et al. (2000) Papadopoulos, P., et al. 2000, ApJ, 528, 626
- Reuland et al. (2003) Reuland, M., et al. 2003, ApJ, 592, 755
- Rocca-Volmerange et al. (2004) Rocca-Volmerange, B., Le Borgne, D., De Breuck, C., Fioc, M., & Moy, E. 2004, A&A, 415, 931
- Scharf et al. (2003) Scharf, C., Smail, I., Ivison, R., Bower, R., van Breugel, W., & Reuland, M. 2003, ApJ, 596, 105
- Scoville, Yun, & Bryant (1996) Scoville, N., Yun, M., & Bryant, P. 1996, ASSL Vol. 206: Cold Gas at High Redshift, ed. M.N. Bremer et al. (Kluwer: Dordrecht), 25
- Stevens et al. (2003) Stevens, J., et al. 2003, Nature, 425, 264
- van Breugel et al. (1999) van Breugel, W., et al. 1999, in The Most Distant Radio Galaxies, ed. H.J.A. Röttgering, P.N. Best, & M.D. Lehnert (Roy. Neth. Acad. Sci.: Amsterdam), 49
- Veilleux & Rupke (2002) Veilleux, S. & Rupke, D. 2002, ApJ, 565, L63
- Villar-Martín et al. (2003) Villar-Martín, M., Vernet, J., di Serego Alighieri, S., Fosbury, R., Humphrey, A., & Pentericci, L. 2003, MNRAS, 346, 273
- Zylka (1998) Zylka, R., The MOPSI Cookbook, IRAM