11email: Vincent.Minier@cea.fr 22institutetext: School of Physics, University of New South Wales, Sydney 2052, NSW, Australia 33institutetext: Onsala Space Observatory, S-439 92 Onsala, Sweden 44institutetext: Departamento de Astronomía, Universidad de Chile, Casilla 36-D, Santiago, Chile 55institutetext: Center for Astrophysics, 60 Garden Street, Cambridge, MA, 02138, USA
Star-forming protoclusters associated with methanol masers
We present a multiwavelength study of five methanol maser sites which are not directly associated with a strong ( mJy) radio continuum source: G 31.28+0.06, G 59.78+0.06, G 173.49+2.42 (S231, S233IR), G 188.95+0.89 (S252, AFGL5180) and G 192.60-0.05 (S255IR). These radio-quiet methanol maser sites are often interpreted as precursors of ultra-compact H ii regions or massive protostar sites. In this work, the environment of methanol masers is probed from mid-IR to millimetre wavelengths at angular resolutions of . Spectral energy distribution (SED) diagrams for each site are presented, together with mass and luminosity estimates. Each radio-quiet maser site is always associated with a massive ( M⊙), deeply embedded ( mag) and very luminous ( L⊙) molecular clump, with . These physical properties characterise massive star-forming clumps in earlier evolutionary phases than H ii regions. In addition, colder gas clumps seen only at mm-wavelengths are also found near the methanol maser sites. These colder clumps may represent an even earlier phase of massive star formation. These results suggest an evolutionary sequence for massive star formation from a cold clump, seen only at mm wavelengths, evolving to a hot molecular core with a two-component SED with peaks at far-IR and mid-IR wavelengths, to an (ultra-compact) H ii region. Alternatively, the cold clumps might be clusters of low-mass YSOs, in formation near the massive star-forming clusters. Finally, the values of the dust grain emissivity index () range between 1.6 and 1.9.
Key Words.:
masers — stars: formation — circumstellar matter1 Introduction
Class II methanol masers were originally detected toward regions of massive star formation (MSF) because many searches at 6.7 and 12.2 GHz had focused on observing regions exhibiting typical MSF signatures, such as strong radio continuum sources (i.e. H ii regions), IRAS sources with IR colours of ultra-compact H ii (UC H ii) regions111In this paper, a UC H ii region is defined as a region ionised by high-mass stars, with a diameter pc and an electron density cm-3 producing a 22-GHz flux of mJy at a distance of 5 kpc (Kurtz et al. kurtz00 (2000)). and OH masers (e.g. Batrla et al. batrla87 (1987); Schutte et al. schutte93 (1993); Caswell et al. caswell95 (1995)). At low angular resolution (), many 6.7 and 12.2-GHz methanol masers appeared to be associated with H ii regions.
In contrast, high angular resolution () observations have demonstrated that methanol masers are in fact generally not co-spatial with strong radio sources (e.g. UC H ii regions), but frequently tend to be isolated from them. Out of methanol maser sites studied, 75% are not directly associated (within 0.1 pc) with UC H ii regions or more extended radio sources (Caswell caswell96 (1996); Walsh et al. walsh98 (1998); Phillips et al. phillips98 (1998); Minier et al. minier01 (2001)). Very weak ( mJy) radio continuum emission has, however, been detected toward isolated methanol maser sites (e.g. van der Walt et al. walt03 (2003)). An extreme case is IRAS 20126+4104 where the methanol maser in the hot molecular core is associated with a 0.1-mJy radio source at 8.6 GHz (Hofner et al. hofner99 (1999); Minier et al. minier01 (2001)). This might be the first sign that some isolated methanol masers are associated with precursors of UC H ii regions, i.e. protostellar objects on the way to forming a star or a multiple star system. Methanol maser sites are therefore generally radio-quiet in terms of continuum emission ( mJy at 5 kpc, i.e. a typical observational sensitivity limit).
Complementary spectral line observations confirm this view. Preliminary results from a molecular line survey with the Mopra millimetre telescope suggest that isolated methanol masers are possibly associated with hot molecular cores (HMCs) (Purcell et al. purcell04 (2004)), which are presumed to be the sites where massive protostars evolve to form an ionising ZAMS star (Kurtz et al. 2000; Fontani et al. 2003). The intense and complex chemistry, the temperature (some 100 K) and the density ( cm-3) of these HMCs would provide suitable conditions for methanol masers to arise (see Minier et al. 2003 and references therein).
Finally, recent ATCA observations by Minier et al. (minier03 (2003)) might indicate an exclusive association between methanol masers and massive star-forming regions following a nil detection rate of masers toward regions of low-mass star formation. All these elements tend to demonstrate that methanol masers may trace an early stage of MSF. Whether methanol masers trace embedded massive protostars or suitable conditions nearby a site of MSF remains an open question.
This paper is devoted to a multiwavelength study of five radio-quiet methanol maser sites and their environments, which are particularly good candidates for hosting a massive protostar (Minier et al. minier00 (2000), minier01 (2001)): G 31.28+0.06, G 59.78+0.06, G 173.49+2.42 (S231, S233IR), G 188.95+0.89 (S252, AFGL 5180) and G 192.60-0.05 (S255IR). Comparisons of images taken from optical to radio wavelengths are presented, accompanied by estimates of the mass, luminosity and temperature of the MSF clumps in each region. We will demonstrate that the five radio-quiet maser sites coincide with massive and luminous star-forming clumps. Finally, it will be shown that methanol masers trace very young clusters of star formation in the earliest stages of their evolution.
Sect. 2 describes the observations and data archives used for this work. Derived physical quantities and diagrams of spectral energy distributions are presented in Sect. 3, followed by a discussion in Sect. 4 and conclusions in Sect. 5.
2 Observations, data archives and analysis
2.1 Optical image archives
An optical image of an region was generated around each source using the Digitized Sky Survey (DSS) database (http://archive.eso.org/dss/dss). The Digitized Sky Survey comprises a set of all-sky photographic surveys conducted with the Palomar and UK Schmidt telescopes. The objective was to visualise any association with optical H ii regions or main sequence OB stars after identification with the SIMBAD catalogues on CDS.
2.2 Mid- and far- infrared image archives
The mid-infrared (mid-IR) and far-infrared (far-IR) images were obtained from the Midcourse Space Experiment (MSX) and from the InfraRed Astronomical Satellite (IRAS) data archives. The values for the mid-IR fluxes were estimated from the MSX images using the KARMA222See: http://www.atnf.csiro.au/computing/software/karma/ package, by estimating the flux in the source and also in the background. The background residual flux was measured by taking the averaged flux in boxes at diverse positions around the mm source. This method allows removal of the background noise as well as emission from nearby objects and extended regions. To avoid confusion with silicate emission/absorption at 8.7 m (in the MSX A-band) and with the more extended PAH contribution at 7.7, 8.6 and 11.3 m (in the A- and C-bands), the emission contours in the E-band (21.3 m) were used to estimate the extent of the thermal dust emission. The source flux then had the background subtracted, and the value was converted from W m-2 sr-1 to Jy. The image sensitivity varies from 1.9 to W m-2 sr-1, with an angular resolution of (i.e. 0.18 pc at 2 kpc). The positions in the MSX point source catalogue are accurate to within . The conversion factors were 6.84103, 2.74104, 3.08104 and 2.37104 Jy per W m-2 sr-1 for the A-band (8.3 m), C-band (12.1 m), D-band (14.6 m) and E-band (21.3 m), respectively (see Egan et al. egan99 (1999) for a MSX explanatory guide). These factors include a correction turning the 6-arcsec square pixel into a Gaussian area. The far-IR fluxes were taken directly from the IRAS Point Source Catalogue (IRAS PSC).
2.3 Submillimetre and millimetre continuum observations
The submillimetre observations at 450 and 850 m were conducted using the Sub-mm Common User Bolometer Array (SCUBA) on the James Clerk Maxwell Telescope (JCMT) in September 2002 for three of the five sources. G 31.28+0.06 was observed by Walsh et al. (walsh03 (2003)). The observations were made in jiggle map mode with a map size 2-3 arcmin. The pixel size was 3 arcsec. Pointing and calibration were made on HL Tau. The average zenith atmospheric optical depths were 1.8 and 0.3 at 450 and 850 m, respectively. The volt-to-Jy-beam-1 conversion factors were 373.1 and 260.0. The image sensitivities were and 0.01 Jy beam-1 at 450 and 850 m, respectively. The FWHM beam sizes were estimated to be 8 and 15 arcsec (i.e. 0.08-0.15 pc at 2 kpc) at 450 and 850 m, respectively. The data were reduced with the standard procedure SURF (reduce-switch, flatfield, extinction, remsky and rebin). The flux density values were estimated in each image with the KVIEW procedure described in Sect. 2.2.
The 1.2-mm observations were made using the SEST IMaging Bolometer Array (SIMBA) on the Swedish-ESO Submillimetre Telescope (SEST) in October 2001 and June 2002. SIMBA is a 37-channel hexagonal array in which the HPBW of a single element is about (i.e. 0.24 pc at 2 kpc) and the separation between elements on the sky is . The bandwidth in each channel is about 50 GHz. Spectral line emission present in the band may contribute to the total continuum flux values reported in this paper, though not more than 30%. Free-free emission is not expected to contribute to the (sub-)mm flux given the radio-quiet nature of the targets. Assuming optically thin free-free emission for frequencies GHz, 80 mJy at 8.6 GHz would convert to 57 mJy at 250 GHz, i.e. of the 1.2-mm flux measured at the same position. Similarly, for an ionized wind model with (Panagia & Felli panagia75 (1975)), the extrapolation at 250 GHz of the radio fluxes would yield less than 11% of the observed flux densities. These observations were made in fast-mapping mode. Typical areas of were imaged in order to detect nearby IRAS sources in the field, using a scan speed of s-1. The resulting pixel size is 8 arcsec. Typically, total observation times were around 15 minutes per source, giving a sensitivity Jy beam-1. Zenith opacities ranged from 0.2 – 0.4 throughout the observing runs in 2001 and 2002. The resulting data were reduced with the MOPSI mapping software package developed by R. Zylka, using the “deconvolution” algorithm333Developed within the SIMBA collaboration. to remove the contribution of the electronics arising from the fast-mapping observing mode, the “converting” algorithm (Salter salter83 (1983)) to convert the coordinates from rectangular to equatorial, and partly the NOD2 and GILDAS libraries. The calibration of our data was performed using Uranus. The multiplication factor between counts and Jy beam-1 was 138.8 mJy count-1 beam-1 for the October 2001 run (G 188.95+0.89, G 192.60-0.05) and 66.9 mJy count-1 beam-1 for the June 2002 run (G31.28+0.06, G59.78+0.06). The flux density values were estimated with the KVIEW procedure described in Sect. 2.2. The 1.2-mm fluxes for G 173.49+2.42 were taken from Beuther et al. (beuther02 (2002)).
2.4 Molecular spectral line observations
The molecular line observations were carried out in May 1999 with the Onsala-20m millimetre telescope (OSO-20m) and in October 2002 with the Mopra millimetre telescope. CH3CN (92 GHz) and C18O (109 GHz) lines were observed toward each methanol maser position with a single pointing. 80 MHz and 64 MHz bandwidths were used at Onsala and Mopra, respectively. The gain of the Onsala-20m telescope is Jy K-1 in the range 85-112 GHz while the gain of the Mopra telescope is about 30 Jy K-1. CH3CN observations were performed with Mopra only. C18O observations were carried out with Mopra toward G 192.60-0.05 and with the OSO-20m toward the other four sources. The pointing errors were estimated to be less than 5 arcsec for the OSO-20m and less than 10 arcsec for Mopra. The data were processed with XS, the Onsala data reduction software.
2.5 Radio continuum data archives
Radio continuum information was obtained from Aladin and SIMBAD on CDS within a region around each methanol maser site. Specific radio survey catalogues were also searched using VizieR. These included the 1.4-GHz NRAO VLA sky survey (NVSS, Condon et al. condon98 (1998)), the 5-GHz VLA survey of the Galactic plane (Becker et al. becker94 (1994)), the survey of radio H ii regions in the Northern Sky through recombination line emission (Lockman lockman89 (1989)), the GB6 catalogue of radio sources at 4.85 GHz (Gregory et al. gregory96 (1996)), the UC H ii region survey (Kurtz et al. 1994) and an ATCA survey at 8.6 GHz (Walsh et al. walsh98 (1998)). Source positions from Snell & Bally (snell86 (1986)) for G 192.60-0.05 and from Sridharan et al. (sridharan02 (2002)) for G 59.78+0.06 were also plotted.
3 Results
3.1 Derivation of physical quantities
The goal of this paper is to derive the physical characteristics of the methanol maser sites. These physical quantities include the luminosity (), the gas mass (), the gas column density (), the gas density (), the dust ( and ) and gas temperatures (), the virial mass () and the power law index of the dust optical depth (). The values of these physical quantities are derived from the dust continuum emission and from the molecular line emission for each clump in the five MSF regions studied in this paper. We do not intend to model density and temperature structures in detail. This will be undertaken with higher angular resolution instruments in the future.
3.1.1 Spectral Energy Distribution of dust emission
The Spectral Energy Distribution (SED) of each millimetre source with continuum data points from 8 m to 1.2 mm is fitted with two grey-body functions modified with a non-constant emissivity function, which model emission from a hot ( K) dust core (diameter, ) embedded in a larger cold ( K) or warm ( K) envelope (diameter, ). The dust optical depth in the emissivity function is expressed as a power law where is the frequency and is the dust grain emissivity index. The hot dust core is characterised by a dust temperature () and a solid angle () which are two free parameters in the first grey-body model. The cold (or warm) envelope is characterised by and in the second grey-body function. Two additional parameters, the turn-over frequency between optically thin and thick regimes (= where ==1) and , are also estimated. In total six free parameters are therefore estimated using a minimum -Levenberg-Marquardt bestfit of the functions to the data.
This model is a good approximation if each methanol maser site harbours a single young stellar object (YSO). In the case of a multiple YSO system or a YSO cluster, our model will reproduce emission from both the individual YSOs and the cluster envelope. However, only a few massive YSOs are expected to be present within each methanol maser site due to the relatively small region observed. The SED will be dominated by emission from the most luminous objects present. In summary, our model will give the SED of a single YSO at best and the total SED of a YSO cluster at least.
The total luminosity () is derived by integrating the SED over the frequency/wavelength range. The gas mass is estimated using the following equation, adopting the Rayleigh-Jeans approximation to the Planck function, and assuming optically thin emission at 1.2 mm:
| (1) |
where is the 1.2-mm continuum intergrated flux in W m-2 Hz-1, the distance to the source in m, the wavelength in m, the Boltzmann’s constant in J K-1, the dust temperature in K, the dust-to-gas mass ratio and the mass coefficient absorption () in m2 kg-1. The Rayleigh-Jeans approximation holds as long as the temperature is greater than 40 K at 1.2 mm or 250 GHz. For temperatures less than 30 K, the use of the full Planck function is recommended. The values of and may vary with physical conditions. Values of 0.1 m2 kg-1 at mm and 1% are adopted for and , respectively, in the present work (Ossenkopf & Henning ossenkopf94 (1994)). This gives values of similar or down to 4 times less than when using the mass estimate method from Hildebrand (hildebrand83 (1983)).
and are calculated by dividing by and , respectively, where is the angular resolution of SEST at 1.2 mm. The values of the column density and density in table 5 are therefore beam averaged values. and the mass density are also estimated using , which is the fitted diameter of the protostellar envelope (tables 5 and 6).
3.1.2 Molecular line analysis
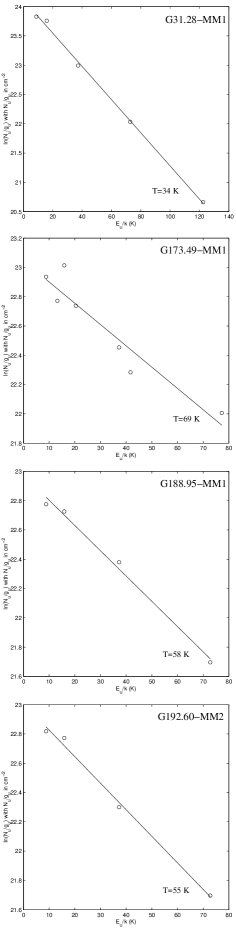
The molecular lines in the CH3CN and C18O spectra are fitted with Gaussian functions. The Gaussian parameters are given in tables 3 and 4. CH3CN() spectral lines corresponding to different -components are used to derive an estimate of the gas temperature using the rotational diagram method and assuming that CH3CN emission is optically thin. The rotation method is based on three assumptions. (i) The spectral line is optically thin. (ii) The brightness temperature () of the background is negligible with respect to the brightness temperature () of the source. (iii) The population of all observed energy levels is described by a single Boltzmann temperature .
Using the equation derived in Nummelin (1998) and the above assumptions, the rotation diagram is a plot of the left hand side quantity in Eq. 2 versus .
| (2) |
where is the frequency of the rotational transition, is Planck’s constant, c is the speed of light, is the absorption coefficient, is the degeneracy of the upper energy level, is the total CH3CN column density and is the partition function. If the hypotheses were correct, the data points would fall along a straight line (see Fig. 1) whose inverse of the negative slope is the rotational temperature (). If all transitions are thermalised, the derived temperature is an estimate of the kinematic temperature of the molecular gas. Note that is calculated from , the antenna temperature as follows:
| (3) |
where is the main-beam efficiency factor and is the beam-filling factor. In this work, we assume (beam-averaged) i.e. and for the OSO-20m and for Mopra.
The C18O line is a very useful tool for estimating the H2 column density. In the optically thin regime the C18O column density is given by Bourke et al. (bourke97 (1997)):
| (4) |
where , the excitation temperature, the background temperature and is Planck’s constant.
Once is known, is derived using the column density relationship in Frerking et al. (frerking82 (1982)):
| (5) |
LTE is assumed and . In this way, the rotational temperatures deduced from the CH3CN data is used to derive the C18O column density. The deduced H2 column densities are representative for the CH3CN emitting regions if their angular sizes are similar to that of C18O emitting regions. These assumptions will be discussed further in Sect. 4. The total H2 mass is derived by multiplying by , where is the angular resolution of OSO-20m at 109.8 GHz. The density is estimated by dividing the total mass by a source volume . and are beam averaged values, i.e. a lower limit of the actual values if the C18O cloud has an angular size lower than .
3.1.3 Virial mass
The virial estimate of the molecular mass follows the approach by MacLaren et al. (maclaren88 (1988)) with density profile in , where is the radius. The virial mass is given by:
| (6) |
where is the full 3-dimensional velocity dispersion, is the radius of the cloud in pc, is the FWHM of the C18O line in km s-1 and is the gravitational constant. In this work, and . A molecular clump is gravitationally bound as long as . Due to uncertainties in the mass estimate, the relation will be discussed for each object. Note that the values of in table 5 should be divided by 1.4 () before comparison with derived from the dust continuum observations.
| Position | Flux(Jy) Mid-IR | Sub-mm | Mm | Radio | ||||||
| Source | RA | Dec | 8.3 | 12.1 | 14.6 | 21.3 | 450 | 850 | 1.2 | (mJy) |
| (J2000) | (J2000) | (m) | (m) | (m) | (m) | (m) | (m) | (mm) | ||
| G 31.28-MM1 | 18 48 12.1 | -01 26 20 | 2.4 | 3.5 | 7.5 | 34.9 | 160.0 | 19.5 | 5.4 | 80 (8.6 GHz)1,2 |
| G 31.28-MM2 | 18 48 10.8 | -01 26 54 | 0.1 | 0.4 | 0.6 | 3.3 | 14.0 | 3.0 | 0.6 | (15 GHz)2 |
| G 31.28-MM3 | 18 48 10.0 | -01 27 55 | – | – | – | – | – | – | 0.3 | (15 GHz)2 |
| G 59.78-MM1 | 19 43 10.0 | 23 44 59 | – | – | – | – | – | – | 0.9 | (8.6 GHz) |
| G 59.78-MM2 | 19 43 10.6 | 23 44 03 | 7.5 | 10.9 | 16.0 | 50.1 | 35.8∗ | 5.8∗ | 4.1 | 1 (8.6 GHz)3 |
| G 173.49-MM1 | 05 39 13.0 | 35 45 54 | 0.6 | 0.3 | 1.3 | 29.8 | 249.4 | 17.3 | 6.0∗∗ | (8.6 GHz)3 |
| G 173.49-MM2 | 05 39 10.8 | 35 46 06 | – | – | – | – | 21.3 | 3.2 | 0.6∗∗ | (8.6 GHz)3 |
| G 173.49-MM3 | 05 39 08.1 | 35 46 48 | – | – | – | – | – | 2.0 | 0.4∗∗ | (8.6 GHz)3 |
| G 173.49-MM4 | 05 39 10.8 | 35 45 12 | 5.0 | 6.4 | 5.7 | 25.3 | 31.2 | 3.2 | 1.0∗∗ | (8.6 GHz)3 |
| G 188.95-MM1 | 06 08 52.8 | 21 38 37 | 8.9 | 14.8 | 19.7 | 85.2 | 83.9 | 10.2 | 1.5 | (15 GHz)2 |
| G 188.95-MM2 | 06 08 52.2 | 21 38 13 | – | – | 0.1∗ | 17.6∗ | 136.6 | 14.6 | 4.2 | (15 GHz)2 |
| G 192.60-MM1 | 06 12 52.9 | 18 00 27 | 0.2 | 0.2 | 1.0 | 17.4 | 260.0 | 26.3 | 5.4 | 22 (8.6 GHz)2 |
| G 192.60-MM2 | 06 12 53.4 | 17 59 23 | 70.6 | 126.5 | 165.4 | 301.4 | 250.0 | 28.9 | 7.4 | 3-5 (5 GHz)4 |
| G 192.60-MM3 | 06 12 56.8 | 17 58 03 | – | – | – | – | – | – | 0.8 | (15 GHz)2 |
3.2 Presentation of the results
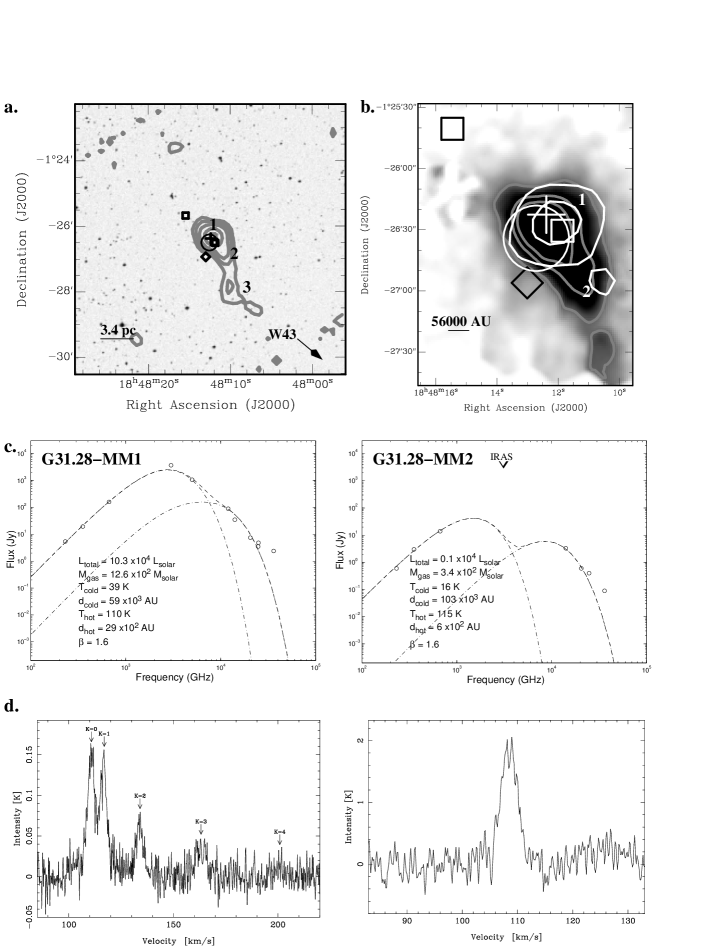
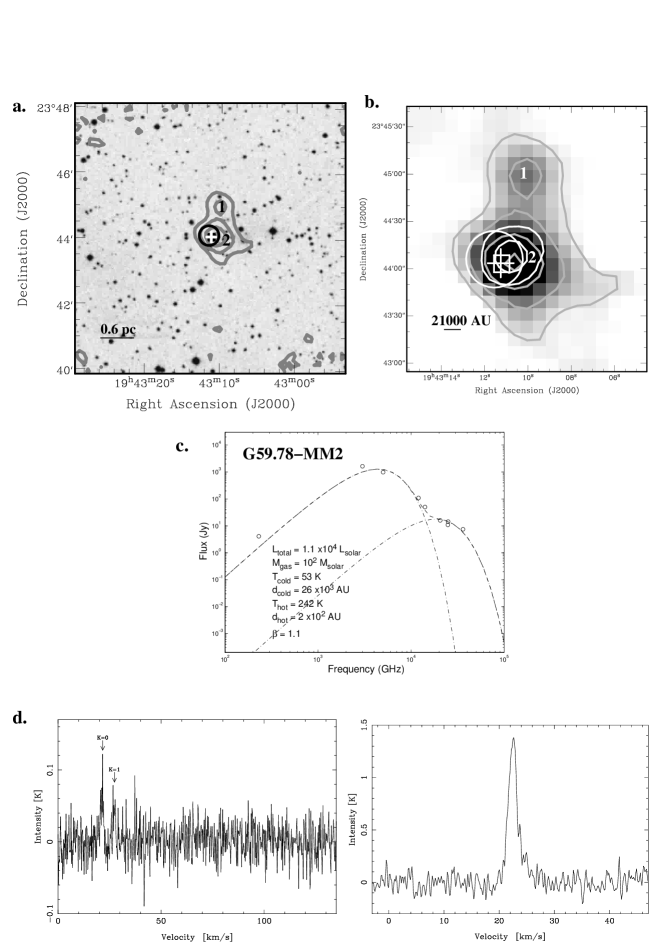
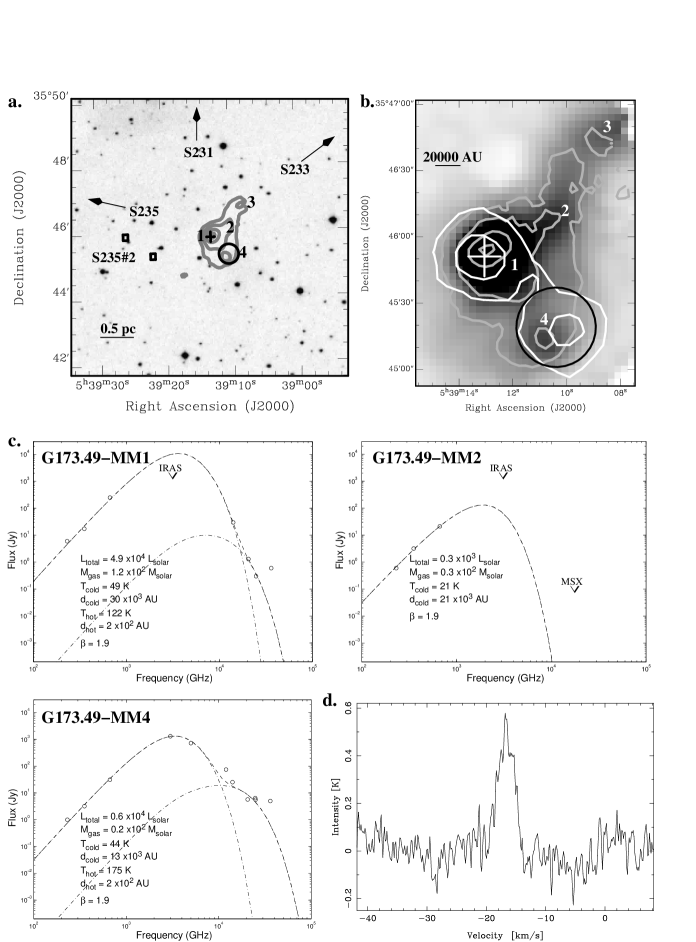
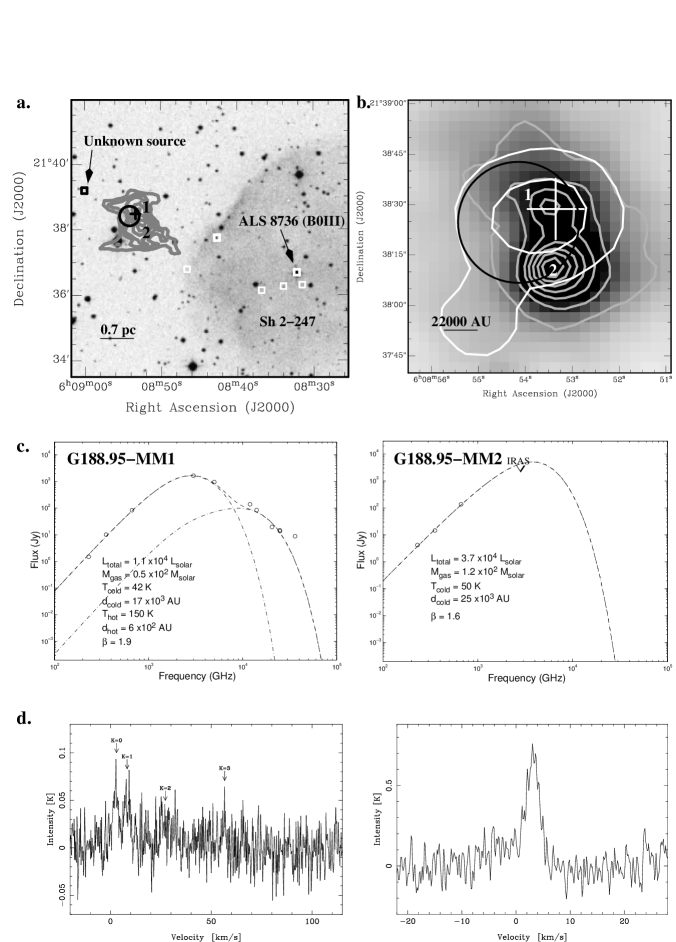
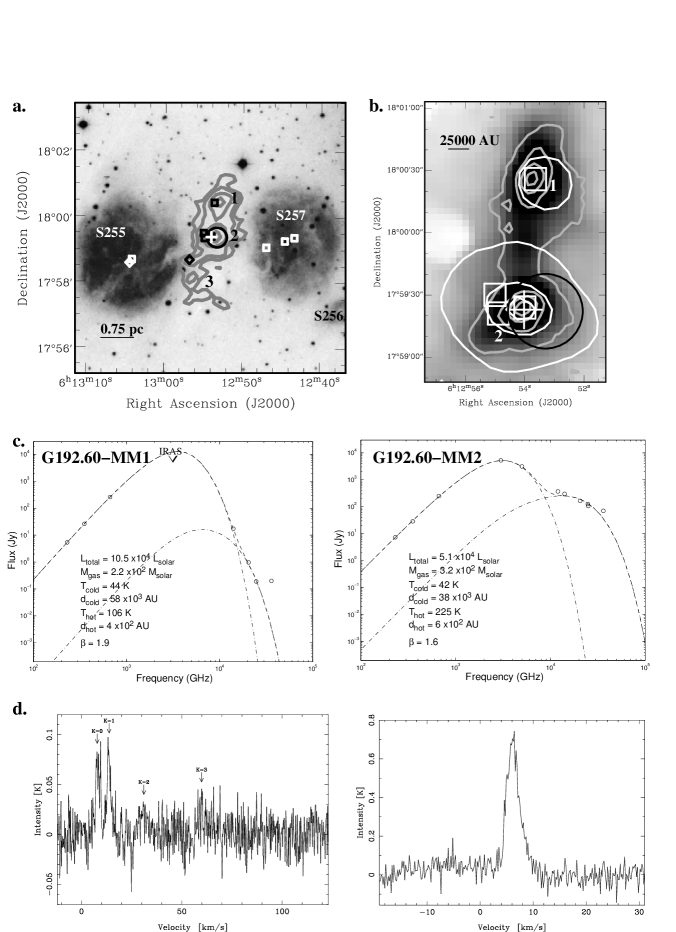
For each methanol maser site, an overview of the region consisting of a (sub)mm contour map and symbols representing radio sources, IRAS and maser sources overlaid on an optical image is given. This is image a. in Figs. 2-6. A close-up image of the methanol maser site is also presented with the mid-IR and 450 m contours overlaid on the 850 m image. This is image b. in Figs. 2-6. For the mm emission sources with enough data points from mid-IR to mm wavelengths (table 1), the Spectral Energy Distribution (SED) diagrams are presented with the physical parameters and derived physical quantities. IRAS fluxes were used only when an association with a mm source was clearly identified (table 2). These are plots c. in Figs. 2-6. Finally, CH3CN and C18O spectra are presented in Figs. 2-6 d. with corresponding data values in tables 3 and 4. Rotational diagrams are given in Fig. 1. Table 5 summarises the derived physical quantities for the five methanol maser sites. To derive these values, the OSO and SEST telescope beams are mainly used as physical angular sizes because C18O line emission and dust emission may not arise exactly from the same region. An estimate of the clump diameter in the SED model is given in Fig. 2-6.
| Source | IRAS name | 12 | 25 | 60 | 100 | log() | log() | Association |
|---|---|---|---|---|---|---|---|---|
| (m) | (m) | (m) | (m) | |||||
| G 31.28+0.06 | 18456–0129 | 4.85 | 89.33 | 1071.0 | 3693.0 | 1.26 | 2.34 | G 31.28-MM1 |
| G 59.78+0.06 | 19410+2336 | 14.4 | 108.8 | 982.5 | 1631.0 | 0.98 | 1.83 | G 59.78-MM2 |
| G 173.49+2.42 | 05358+3543 | 5.6 | 74.7 | 722.3 | 1310.0 | 1.12 | 2.11 | G 173.49-MM4 |
| G 188.95+0.89 | 06058+2138 | 13.9 | 140.2 | 955.5 | 1666.0 | 1.00 | 1.83 | G 188.95-MM1 |
| G 192.60–0.05 | 06099+1800 | 107.2 | 371.6 | 3145.0 | 5285.0 | 0.54 | 1.47 | G 192.60-MM2 |
| Source | rms | |||||
|---|---|---|---|---|---|---|
| (km s-1) | (K) | (K) | (km s-1) | (K km s-1) | ||
| G 31.28-MM1 | 0 | 110.5 | 0.15 | 0.01 | 4.1 | 0.66 |
| 1 | 110.5 | 0.13 | 0.01 | 4.1 | 0.59 | |
| 2 | 110.5 | 0.06 | 0.01 | 4.0 | 0.24 | |
| 3 | 110.9 | 0.03 | 0.01 | 4.0 | 0.14 | |
| 4 | 110.0 | 0.01 | 0.01 | 4.1 | 0.01 | |
| G 59.78-MM2 | 1 | 21.3 | 0.07 | 0.02 | 1.8 | 0.14 |
| 2 | 21.5 | 0.05 | 0.02 | 1.5 | 0.09 | |
| G 173.49-MM1 | see | Kalenskii | et | al. | (kalenskii00 (2000)) | |
| G 188.95-MM1 | 0 | 2.3 | 0.05 | 0.02 | 4.0 | 0.23 |
| 1 | 2.4 | 0.04 | 0.02 | 4.1 | 0.21 | |
| 2 | 2.5 | 0.03 | 0.02 | 4.1 | 0.13 | |
| 3 | 3.8 | 0.02 | 0.02 | 4.1 | 0.10 | |
| G 192.60-MM2 | 0 | 8.2 | 0.07 | 0.02 | 3.0 | 0.24 |
| 1 | 7.8 | 0.08 | 0.02 | 2.7 | 0.22 | |
| 2 | 7.8 | 0.03 | 0.02 | 3.2 | 0.12 | |
| 3 | 7.6 | 0.03 | 0.02 | 3.1 | 0.10 |
| Source | rms | |||||
|---|---|---|---|---|---|---|
| (km s-1) | (K) | (K) | (km s-1) | (K km s-1) | (km s-1) | |
| G 31.28-MM1 | 108.5 | 1.89 | 0.17 | 3.6 | 7.20 | 106;114 |
| G 59.78-MM2 | 22.5 | 1.31 | 0.07 | 2.0 | 2.83 | 16;27 |
| G 173.49-MM1 | -16.7 | 0.51 | 0.06 | 3.2 | 1.71 | -15;-11 |
| G 188.95-MM1 | 3.0 | 0.66 | 0.08 | 3.2 | 2.25 | 8;12 |
| G 192.60-MM2 | 6.2 | 0.67 | 0.04 | 3.0 | 2.15 | 1;6 |
3.2.1 G 31.28+0.06
Three mm sources are detected toward G 31.28+0.06 (Fig. 2a). They are distributed along a dusty filament seen with SIMBA (Fig. 2a). The methanol maser site coexists with a H ii region and an IRAS source in the mm source G 31.28+0.06-MM1 (hereafter G 31.28-MM1), but is separated from the radio source peak emission by AU at a distance of 5.6 kpc. The morphology of the H ii region is irregular and clumpy, with a major axis of about . From the values given by Kurtz et al. (kurtz94 (1994)), the peak brightness temperatures are only K at 3.6 cm and K at 2 cm. This implies that this H ii region has a low value EM, and does not belong to the class of UC H ii regions as defined by Kurtz et al. (kurtz00 (2000)). The number of ionizing photons required to excite the H ii region is s-1. This could be supplied by an O9.5 ZAMS star, which has a luminosity of L⊙. No OB association or optical H ii region is seen nearby to G 31.28+0.06 although W 43 is located south. The nature of the NVSS radio source in N-E is unclear. G 31.28-MM2 and -MM3 are much weaker mm emitters. G 31.28-MM1 and G 31.28-MM2 also coincide with sub-mm and mid-IR sources within the positional accuracy (Fig. 2b). In figure 2c, a SED model is presented for the clumps 1 and 2. The SED of G 31.28-MM1 is consistent with that of L⊙ and M⊙ clump. The SED of G 31.28-MM1 is not well modelled between 8.3 and 12.1 m. This may be due to silicate absorption at 8.7 m that is not taken into account in our modelling. CH3CN and C18O lines (Fig. 2d) were detected toward the methanol maser site at velocities falling in the methanol maser velocity range (106 to 114 km s-1). The gas column density and temperature agree quite well with those derived from dust observations. The clump is gravitationally bound (see table 5). G 31.28-MM2 is less luminous ( L⊙), less massive ( M⊙) and much cooler (16 K) than G 31.28-MM1.
3.2.2 G 59.78+0.06
G 59.78+0.06 is a typical isolated maser, with no bright UC H ii region associated with it (Fig. 3). The maser site, however, coincides with an IRAS source satisfying the Wood & Churchwell criteria for a UC H ii region, as well as a weak radio source of flux mJy (Sridharan et al. sridharan02 (2002)). The 1.2-mm continuum map reveals a “peanut” shape with two clumps, G 59.78-MM1 and -MM2. G 59.78-MM1 is the coolest clump with no mid-IR emission. Since SCUBA observations could not be made, the SED could not be drawn. In contrast, the methanol maser site G 59.78-MM2 is a much warmer clump of gas and dust. IRAS data was used in compiling the SED for G 59.78-MM2, given the close spatial coincidence between all types of emission. A luminosity of L⊙ and a mass of M⊙ were estimated for a distance of 2.1 kpc. Strong C18O emission was also detected whereas the CH3CN lines are weak and thus only lower limits are given in table 5. CH3CN and C18O lines were detected toward the methanol maser site at velocities falling in the methanol maser velocity range (16 to 27 km s-1). G59.78-MM2 is gravitationally bound within the mass estimate errors.
3.2.3 G 173.49+2.42 (S231, S233IR)
G 173.49+2.42, also known as S231 in maser catalogues (e.g. Pestalozzi, Minier & Booth pestalozzi04 (2004)) or as S233IR (e.g. Porras et al. porras00 (2000)), is a methanol maser source without any associated visible star-forming region. The methanol maser site is surrounded by three H ii regions (Israel & Felli israel78 (1978)), S231 (north), S233 (north-west) and S235 (east), which are too offset to be seen in Fig. 4a. Two radio sources are observed east from the maser site (Fig. 4a) and are associated with source S235 #2 in Israel & Felli (israel78 (1978)). No radio continuum detection has been reported toward G 173.49+2.42 in Sridharan et al. (sridharan02 (2002)). In contrast, the sub-mm continuum map is rich in emission sites. Four objects were detected with SCUBA: G 173.49-MM1, G 173.49-MM2, G 173.49-MM3 and G 173.49-MM4. G 173.49-MM1 harbours the methanol maser, exhibits mid-IR emission and coincides with one of the 1.2-mm continuum sources observed by Beuther et al. (beuther02 (2002)). G 173.49-MM2 and G 173.49-MM3 are only seen at sub-mm/mm wavelengths. G 173.49-MM4 appears to be associated with the far-IR source reported in the IRAS archives. The four mm objects are also associated with H2 nebulosities (Porras et al. porras00 (2000)). SCUBA observations of G 173.49-MM3 are incomplete because it appears at the edge of the map. SEDs are built for G 173.49-MM1, G 173.49-MM2 and G 173.49-MM4, with only a single grey-body function fitted to the observed data of G 173.49-MM2. The single grey-body fit is certainly a rough estimate but it confirms that G 173.49-MM2 is the coolest clump. G 173.49-MM1 and G 173.49-MM4 are modelled as massive ( M⊙) and luminous ( L⊙) clumps for a distance of 1.8 kpc. The SED of G 173.49-MM1 is not well modelled between 8.3 and 12.1 m. This may be due to silicate absorption at 8.7 m that is not taken into account in our modelling. CH3CN and C18O lines were detected toward the methanol maser site (see tables 3 and 4) at velocities slightly blueshifted with respect to the methanol maser velocity range (-15 to -11 km s-1). Column densities toward G 173.49-MM1 derived from gas and dust observations agree within a factor of 2 (see table 5). G 173.49-MM1 is gravitationally bound within the mass estimate errors.
3.2.4 G 188.95+0.89 (S252, AFGL 5180)
G 188.95+0.89 is a methanol maser site seen in projection nearby Sh 2-247, a complex of H ii regions and OB stars (fig. 5a). Another radio source (G 188.95+0.91) to the east is an unknown and unresolved nebula (Kurtz et al. kurtz94 (1994)). No radio source has been reported near the location of the maser site. 1.2-mm continuum emission is detected toward the methanol maser position. The mm map is divided into two clumps, G 188.95-MM1 and -MM2. At a distance of 2.2 kpc they are just resolved with the beam of SIMBA/SEST. G 188.95-MM1 is the methanol maser site and exhibits emission from mid-IR to mm. G 188.95-MM2 is also a strong sub-mm and mm source, but does not coincide with any mid-IR peak emission. A third region to the south-east appears in the MSX contour map. The far-IR emission observed with IRAS probably includes emission from both G 188.95-MM1 and -MM2. The SED of G 188.95-MM1 requires a large mass ( M⊙) and high luminosity ( L⊙). The SED of G 188.95-MM1 is not well modelled between 8.3 and 12.1 m. This may be due to silicate absorption at 8.7 m that is not taken into account in our modelling. Similarly, the SED of G 188.95-MM2, modelled with a single grey-body function, also requires a high mass and luminosity. Note that a total mass of 60 M⊙ is given in Lada & Lada (lada03 (2003)) for AFGL 5180 at a distance of 1.5 kpc. 170 M⊙ in total are derived from SIMBA observations for G 188.95+0.89 at a distance of 2.2 kpc. By taking 1.5 kpc instead of 2.2 kpc in eq. 1, a total mass of 78 M⊙ would have been calculated. Our result is consistent with the Lada & Lada’s mass estimate. CH3CN and C18O lines were detected toward the methanol maser site (see tables 3 and 4) at velocities blueshifted with respect to the methanol maser velocity range (8 to 12 km s-1). Similar column densities are derived from gas and dust emission. The gravitational status of G 188.95-MM1 is unclear.
3.2.5 G 192.60-0.05 (S255IR)
G 192.60-0.05 is a methanol maser site situated between two H ii regions, S255 and S257 (see Minier et al. minier01 (2001) and references therein), consisting of OB stars (fig. 6a). SIMBA observations at 1.2 mm reveal a dusty filament elongated north-south, centred at the location of the methanol maser. Three mm sources are identified: G 192.60-MM1, G 192.60-MM2 and G 192.60-MM3. An additional mm core might be present at a median position between G 192.60-MM1 and G 192.60-MM2 (Fig. 6b), but is too poorly resolved to be successfully fitted as a compact source. G 192.60-MM1 is also concident with a UC H ii region, a sub-mm source, and a mid-IR source (fig. 6b). G 192.60-MM2 is the site of the methanol maser. It also contains three weak and very confined radio sources that might be interpreted as hyper-compact H ii regions (Minier et al. minier01 (2001) for explanation). It is also associated with mid-IR, far-IR and sub-mm emission. The IRAS source coincides with the maser site. G 192.60-MM3 is a colder source that is not clearly identified as a clump. G 192.60-MM1 and G 192.60-MM2 are modelled as two spherical clumps with a high mass ( M⊙) and luminosity ( L⊙) for a distance of 2.6 kpc. The SED of G 192.60-MM1 is not well modelled between 8.3 and 12.1 m. This may be due to silicate absorption at 8.7 m. CH3CN and C18O lines were detected toward the methanol maser site (see tables 3 and 4) at velocities redshifted with respect to the methanol maser velocity range (1 to 6 km s-1). Column densities in G 192.60-MM2 derived from gas and dust observations agree within a factor 5 (see table 5). G 192.60-MM2 is gravitationally bound within the mass estimate errors.
3.3 Dust grain emissivity index ()
The dust grain emissivity index varies between 1.6 and 1.9 for all sources modelled, with the exception of G 59.78-MM2, whose SED is poorly constrained with the absence of sub-millimetre data. This range of values is consistent with the numerical estimates of presented by Ossenkopf & Henning (ossenkopf94 (1994)), who found values of ranging between 1.8 and 2 for dust grains with ice mantles. The adopted value of m2 kg-1 at mm taken from Ossenkopf & Henning (ossenkopf94 (1994)) is therefore self-consistent.
| Continuum | Spectral line | ||||||||||
|---|---|---|---|---|---|---|---|---|---|---|---|
| Source | |||||||||||
| (K) | () | ( | ( | (L⊙) | (K) | () | ( | ( | () | ||
| ) | ) | ) | ) | ||||||||
| G 31.28-MM1 | 39 | 12.6 | 17.5 (90.3) | 13.1 | 10.3 | 34 | 21.6 | 15.1 | 8.0 | 7.4 | |
| G 59.78-MM2 | 53 | 1.0 | 9.8 (36.5) | 19.5 | 1.1 | 0.9 | |||||
| G 173.49-MM1 | 49 | 1.2 | 15.5 (31.8) | 36.0 | 4.9 | 69 | 1.0 | 6.5 | 10.8 | 1.8 | |
| G 188.95-MM1 | 42 | 0.5 | 4.5 (41.0) | 8.6 | 1.1 | 58 | 1.6 | 7.4 | 10.0 | 2.3 | |
| G 192.60-MM2 | 42 | 3.2 | 22.3 (59.5) | 37.3 | 5.1 | 55 | 1.5 | 5.3 | 6.3 | 2.4 | |

4 Discussion
4.1 Methanol masers and MSF
The aim of this work was to study the large-scale ( pc) environment of methanol masers. The results demonstrate that each radio-quiet maser site is always associated with a massive ( M⊙) and very luminous ( L⊙) clump of molecular gas and dust. Whether the clumps are very young clusters, i.e. protoclusters ( a few yr), forming high-mass stars or single protostellar cores is the subject of this discussion.
These individual clumps are at best partially resolved with the relatively low angular resolution of SIMBA, SCUBA or MSX. An estimate of their diameter is given by in Fig. 2-6. It varies between and AU, i.e. 0.1 to 0.3 pc. This implies H2 mass densities of to M⊙ pc-3 in the clumps with a methanol maser (table 6). However, the uncertainties on the clump diameters is of crucial importance as the density value varies with . By taking the beam size of as an upper limit for each clump diameter, the mass density would be to M⊙ pc-3 at heliocentric distances of 1.8 to 5.6 kpc. These values agree with those determined for star-forming clusters such as W3:IRS5 (Megeath et al. megeath96 (1996)), Mon R2 (Carpenter et al. carpenter97 (1997)), NGC 2024 in Orion B and the Trapezium (Lada & Lada lada03 (2003)). More generally, our results are consistent with the physical parameters describing the least evolved embedded clusters in Lada & Lada (lada03 (2003)). Embedded clusters are all associated with massive (100-1000 M⊙) and dense ( cm-3) clumps with diameters pc and mass density M⊙ pc-3 within the molecular clouds. Interestingly, the overall mass, luminosity and linear size for each star-forming complex are not much larger than those measured for protoclusters forming stars less massive than B2 stars such as L1688 in -Oph with L⊙ (due to HD 147889, a B2 star as well as the nearby Sco OB2 association), M⊙ and a diameter pc (Greene & Young greene89 (1989); Wilking & Lada wilking83 (1983)).
The visual extinction of the clumps with a methanol maser can be estimated with mag (Frerking et al. frerking82 (1982)). It varies from 40 to 240 mag, implying a high degree of embeddedness and presumably a very young age ( yr). In comparison, the visual extinction in the -Oph central C18O cloud in L1688 is in the range 50-100 mag (Wilking & Lada wilking83 (1983)) with a column density cm-2 and a diameter pc. Three mm cores (Oph-C, Oph-CS and Oph-E) were mapped by Motte et al. (motte98 (1998)) in the central cloud and have column densities ranging from to cm-2, which compare to those in the methanol maser clumps ( to cm-2).
In summary, the methanol maser sites exhibit the properties of young, deeply embedded clusters of YSOs. Only luminosities in excess of L⊙ (ZAMS B0.5, Panagia panagia73 (1973)) for clumps less than pc in diameter clearly suggest the presence of high-mass ( M⊙) YSOs.
The detection of CH3CN and C18O toward each methanol maser site indicates that they are within HMCs with gas density cm-3. CH3CN emission usually arises from the 0.1-pc inner part of the hot core although ground state CH3CN emission could trace a cooler region in HMCs than those probed with vibrationally excited CH3CN lines (Olmi et al. olmi03 (2003)). This might explain the relatively low rotational temperatures (18-69 K) in table 5. The C18O antenna temperatures (table 4) are much larger than those measured for CH3CN (table 3). A possible explanation is that C18O emission arises from a larger area than CH3CN emission. The CH3CN rotational temperatures agree well with the values (table 5), which suggest that CH3CN() and dust emission arises from the same area. The fitted source solid angles ( and used to estimate and ) in the dust emission models are all smaller than the OSO and Mopra telescope beam sizes, which then probably overestimate the true size of the emitting regions. In consequence, the densities ( cm-3) derived from the C18O data (table 5) with the telescope beam sizes as the source angular sizes are lower limits of the CH3CN clump densities. In addition to CH3CN emission, NH3 and CH3OH quasi-thermal lines were also detected toward G 59.78+0.06, G 173.49+2.42, G 188.95+0.89 and G 192.60-0.05 (Minier & Booth minier02 (2002)). The presence of the typical HMC species (CH3CN, NH3 and CH3OH) suggest again a very young age ( a few yr) for the methanol maser sites (e.g. Rodgers & Charnley rodgers01 (2001)).
In conclusion, methanol masers trace very luminous, deeply embedded, massive, molecular clumps in the five star-forming regions considered here. In a few of the clumps (G 31.28-MM1, G 192.60-MM2 and G 59.78-MM2), ionised sources were also detected in the radio. This implies that high-mass stars are currently forming within these clumps and that the deeply embedded star-forming clumps are protoclusters of high-mass YSOs.
Yet, whether methanol masers are themselves directly associated with a massive YSO remains unclear. In G 31.28+0.06, the maser is offset by AU from the UC H ii region (Walsh et al. walsh98 (1998)). The maser site in G 59.78+0.06 appears to coincide with a very weak radio source within (Sridharan et al. sridharan02 (2002)). In contrast, no radio continuum emission has been detected in G 173.49+2.42 and in G 188.95+0.89. Finally, the methanol maser in G 192.60-0.05 coincides with a 4.4-mJy radio source. Assuming that a maser site and a radio continuum source coincident in the maps are indeed co-spatial, the methanol masers in G 59.78+0.06 and G 192.60-0.05 are associated with the precursors of a UC H ii region. In G 31.28+0.06, G 173.49+2.42 and G 188.95+0.89, further high angular resolution and high sensitivity mm continuum observations are required to identify the nature of the maser sources.
4.2 Multiple star-forming (proto)clusters
A secondary aspect of this work is the detection of objects only seen in mm continuum (hereafter “mm-only” clumps) and the variation of the SED profiles with the evolutionary status of the YSOs.
4.2.1 Cold cores
G 59.78-MM1 and G 173.49-MM2 are typical mm-only clumps. G 31.28-MM3, G 173.49-MM3 and G 192.60-MM3 are other possible mm-only clumps, making in total five mm-only clumps. G 188.95-MM2 probably emits in mid-IR, but its flux was not measured due to confusion with the main mid-IR source, G 188.95-MM1. These mm-only clumps are cold ( K for G 173.49-MM2). The modelled luminosity in G 173.49-MM2 is only 300 L⊙. Assuming K for G 31.28-MM3, G 59.78-MM1, G 173.49-MM3, G 192.60-MM3, masses of M⊙ are derived for the five mm-only clumps. Excluding G 31.28-MM3 at 5.6 kpc, masses range M⊙ for G 59.78-MM1, G 173.49-MM2, G 173.49-MM3 and G 192.60-MM3. The modelled diameter of G 173.49-MM2 is only AU, i.e. 0.1 pc. Using an angular size of for each object, column densities cm-2 and visual extinction mag are estimated. The physical parameters of all detected mm-only clumps are summarised in table 6.
The cold clumps might be prestellar clumps or protostellar clumps in the process of forming stars. Unfortunately, such types of clumps have marginally been detected and it is difficult to compare the mm-only clump properties with those of statistical samples of massive prestellar and early protostellar clumps. A good protostar candidate in an early accretion phase is IRAS 23385+6053 (Fontani et al. fontani03 (2003)), which is a cold ( K) and small ( pc) molecular core embedded in a colder ( K) and larger ( pc) halo. The SED, luminosity ( L⊙) and temperature ( K) of IRAS 23385+6053 resemble those of G 173.49-MM2, when the IRAS points are excluded (Fig. 13 in Fontani et al. fontani03 (2003)). But as stated by the authors, it represents a lower limit. The luminosity of G 173.49-MM2 could also be underestimated without the knowledge of the far-IR flux.
4.2.2 SED profiles
In addition to the mm-only clumps, three other types of SED profile are identified. They might represent different evolutionary phases or result from geometrical effects that modify our perception of the YSO environments in function of the line-of-sight. G 31.28-MM2 is the only example of a cold (16 K) envelope with a nearly hot (115 K) core. The envelope continuum emission and the core continuum emission peak at relatively low frequencies. G 59.78-MM2, G 173.49-MM4, G 188.95-MM1 and G 192.60-MM2 exhibit SEDs with a “warm” ( K) component peaking in the far-IR at m and a hot ( K) component peaking in the mid-IR at m. They are all very luminous ( L⊙). Finally, G 31.28-MM1, G173.49-MM1, G192.60-MM1 and perhaps G 188.95-MM2 see their SED profile dominated by a strong far-IR component. The core component of the SED has shifted to longer wavelengths ( m) and cooled down to K. The warm ( K) envelope emission has strengthened and still peaks around 100 m. The temperatures of all the “warm” components are in good agreement with those expected given the luminosities, sizes and (e.g. see eq. 11 in Garay & Lizano garay99 (1999)). The hot component most likely probe the central part ( to 3000 AU in Fig. 2-6) of the core around the luminous protostellar object.
To compare the evolutionary status of each object, arguments are presented below and in Fig. 7. Only the clumps for which the SED can be built are considered. G 173.49-MM2 and G 31.28-MM2 present while the other clumps have , where is the luminosity integrated between 1.2 mm and 450 m. Similar results are noticed when considering ratios, which are also independent of distances. G 173.49-MM2 and G 31.28-MM2 have lower ratios (3-10 L⊙ M) than those measured for the other clumps ( L⊙ M). This could be explained if G 173.49-MM2 and G 31.28-MM2 are younger than the other objects associated with maser sites and UC H ii regions, hence less luminous. This is also seen in Fig. 7-top where G 173.49-MM2 (#5 in Fig. 7) and G 31.28-MM2 (#2 in Fig. 7) lie below the other sources whose luminosities follow . The objects G 59.78-MM2, G 173.49-MM4, G 188.95-MM1 and G 192.60-MM2 are all relatively hot inside, and strongly emit in the mid-IR with respect to the sub-mm emission (Fig. 7 bottom). They are all good HMC candidates. The mid-IR component is very much absorbed in the FIR component in the SEDs of G 31.28-MM1, G 173.49-MM1, G 188.95-MM2 and G 192.60-MM1. G 31.28-MM1 and G 192.60-MM1 contain H ii regions. The cases of G 173.49-MM1 and G 188.95-MM2 are unclear and they might belong to the HMC or UC H ii class of objects.
Alternatively, the least massive clumps near the methanol maser site could be low- or intermediate-mass star-forming protoclusters. Their physical characteristic resemble those of the -Oph mm cores (Motte et al. motte98 (1998)). Indeed G 173.49-MM4 is coincident with S233IR NE, a cluster of low-mass YSOs seen in near-IR (Porras et al. porras00 (2000)). The derived luminosity ( L⊙) and mass ( M⊙) are typical of the mm cores in -Oph. In Fig. 7-middle, G 173.49-MM4 appears slightly isolated from the group of clearly identified massive star-forming clumps for which and (e.g. Lumsden et al. lumsden02 (2002)). G 173.49+2.42 is therefore a good example of a star-forming complex in which various mass types of YSO clusters co-exist.
High resolution and high sensitivity observations in mid-IR, mm and cm are needed to differentiate between these two scenarii by searching for multiple mm core system within each mm clump as seen in -Oph and weak free-free emission around high-mass protostars.
| Clump | D | M | Density | ||
|---|---|---|---|---|---|
| name | (kpc) | () | (pc) | () | (mag) |
| G 31.28-MM1 | 5.6 | 12.6 | 0.3 | 186 | |
| G 31.28-MM2 | 5.6 | 3.4 | 0.5 | 50 | |
| G 31.28-MM3 | 5.6 | 1.8 | 0.6∗ | ∗ | 26 |
| G 59.78-MM1 | 2.1 | 0.8 | 0.2∗ | ∗ | 78 |
| G 59.78-MM2 | 2.1 | 1.0 | 0.1 | 104 | |
| G 173.49-MM1 | 1.8 | 1.2 | 0.1 | 164 | |
| G 173.49-MM2 | 1.8 | 0.3 | 0.1 | 40 | |
| G 173.49-MM3 | 1.8 | 0.3 | 0.2∗ | ∗ | 35 |
| G 173.49-MM4 | 1.8 | 0.2 | 0.1 | 28 | |
| G 188.95-MM1 | 2.2 | 0.5 | 0.1 | 48 | |
| G 188.95-MM2 | 2.2 | 1.2 | 0.1 | 114 | |
| G 192.60-MM1 | 2.6 | 2.2 | 0.3 | 150 | |
| G 192.60-MM2 | 2.6 | 3.2 | 0.2 | 237 | |
| G 192.60-MM3 | 2.6 | 1.0 | 0.3∗ | ∗ | 70 |
5 Conclusions
Five methanol maser sites have been studied from mid-IR to mm wavelengths. Each radio-quiet maser site is always associated with a massive ( M⊙), very luminous ( L⊙), deeply embedded ( mag) molecular clump. They are all underluminous stellar objects (). The properties of the maser sites derived from observations and modelling suggest that they are embedded HMCs in which high-mass stars are in the process of forming. All these elements demonstrate that the radio-quiet methanol masers trace high-mass star-forming protoclusters in earlier phases than those detected in the H ii region surveys.
In addition, colder gas clumps seen only at mm wavelengths are also found near the methanol maser sites. These might represent an even earlier phase of massive star formation. These results suggest an evolutionary sequence for massive star formation from a cold clump only seen at mm wavelengths, evolving to a HMC with a two-component SED with peaks at far-IR and mid-IR wavelengths, and ending with (ultra-compact) H ii regions very bright at far-IR wavelengths. Alternatively, the cold clumps might be clusters of less massive ( M⊙) YSOs, in formation near the high-mass star-forming protoclusters.
Finally, the values of the dust grain emissivity index () range between 1.6 and 1.9, which agree with modelling work (Ossenkopf & Henning ossenkopf94 (1994)).
Acknowledgments
This research was funded by an Australia Research Council Discovery Grant. It has also made use of Centre de Données astronomiques de Strasbourg (CDS), the Digitized Sky Survey produced at the Space Telescope Science Institute, the NASA/IPAC Infrared Science Archive operated by the Jet Propulsion Laboratory, California Institute of Technology. We thank the SEST staff for their help during the SIMBA observation and data reduction, especially Markus Nielbock for his data analysis support. The SEST and the Onsala-20m telescope are operated by the Swedish National Facility for Radio Astronomy, Onsala Space Observatory at Chalmers University of Technology. The Mopra millimetre radio-telescope is part of the Australia Telescope which is funded by the Commonwealth of Australia for operation as a National Facility managed by CSIRO.
References
- (1) Batrla, W., Matthews, H., Menten, K., & Walmsley, C. 1987, Nature, 326, 49
- (2) Becker, R.H., White, R.L., Helfand, D.J., & Zoonematkermani, S. 1994, ApJS, 91, 347
- (3) Beuther, H., Schilke, P., Menten, K.M., et al. 2002, ApJ, 566, 945
- (4) Bourke, T.L., Garay, G., Lehtinen, K.K., et al. 1997, ApJ, 476, 781
- (5) Carpenter, J.M., Meyer, M.R., & Dougados, C. 1997, AJ, 114, 198
- (6) Caswell, J.L., Vaile, R.A., Ellingsen, S.P., Whiteoak, J.B., & Norris, R.P. 1995, MNRAS, 272, 96
- (7) Caswell, J.L. 1996, MNRAS, 279, 79
- (8) Condon, J.J., Cotton, W.D., Greisen, E.W., et al. 1998, AJ, 115, 1693
- (9) Egan, M.P., Price, S.D., Moshir, M.M., Cohen, M., & Tedesco, E. 1999, The Midcourse Space Experiment Point Source Catalog Version 1.2 Explanatory Guide, Technical Report, AD-A381933
- (10) Fontani, F., Cesaroni, R., Testi, L., et al. 2003, A&A, in press
- (11) Frerking, M.A., Langer, W.D., & Wilson, R.W. 1982, ApJ, 262, 590
- (12) Garay, G., & Lizano, S. 1999, PASP, 111, 1049
- (13) Greene, T.P., & Young, E.T. 1989, ApJ, 339, 258
- (14) Gregory, P.C., Scott, W.K., Douglas, K., & Condon, J.J. 1996, ApJS, 103, 427
- (15) Hildebrand, R.H. 1983, QJRAS, 24, 267
- (16) Hofner P., Cesaroni R., Rodríguez L.F., Martí J, 1999, A&A 345, L43
- (17) Israel, F.P., & Felli, M., 1978, A&A 63, 325
- (18) Kalenskii, S.V., Promislov, V. G., Alakoz, A., Winnberg, A.V., & Johansson, L.E.B. 2000, A&A, 354, 1036
- (19) Kurtz, S., Churchwell, E., & Wood, D.O.S. 1994, ApJS 91, 659
- (20) Kurtz, S., Cesaroni, R., Churchwell, E., Hofner, P., & Walmsley, M. 2000, In: Mannings V., Boss A.P., Russell S. S. (eds.) Protostars and Planets IV. University of Arizona Press, p. 299
- (21) Lada, C.J., & Lada, E.A. 2003, ARA&A, 41, 57
- (22) Lockman, F.J., ApJS, 71, 469
- (23) Lumsden, S.L., Hoare, M.G., Oudmaijer, R.D., & Richards, D., 2002, MNRAS, 336, 621
- (24) MacLaren, I., Richardson, K.M., & Wolfendale, A.W. 1988, ApJ, 333, 821
- (25) Megeath, S.T., Herter, T., Beichman, C., et al. 1996, A&A, 307, 775
- (26) Minier, V., Booth, R.S., & Conway, J.E. 2000, A&A, 362, 1093
- (27) Minier, V., Conway, J.E., & Booth, R.S. 2001, A&A, 369, 278
- (28) Minier, V., & Booth, R.S. 2002, A&A, 387, 179
- (29) Minier, V., Ellingsen, S.P., Norris, R.P., & Booth, R.S. 2003, A&A, 403, 1095
- (30) Motte, F., André, P., & Neri, R. 1998, A&A, 336, 150
- (31) Nummelin, A. 1998, PhD thesis, Technical Report No. 347, Chalmers University of Technology
- (32) Olmi, L., Cesaroni, R., Hofner, P., et al. 2003, A&A, 407, 225
- (33) Ossenkopf, V., & Henning, T. 1994, A&A, 291, 943
- (34) Panagia, N. 1973, AJ, 78, 929
- (35) Panagia, N., & Felli, M. 1975, A&A, 39, 1
- (36) Pestalozzi, M.R., Minier, V., & Booth R.S. 2004, A&A, submitted
- (37) Phillips, C.J., Norris, R.P., Ellingsen, S.P., & McCulloch P.M. 1998, MNRAS 300, 1131
- (38) Porras, A., Cruz-González, I., & Salas, L. 2000, A&A, 361, 660
- (39) Purcell, C.R., Burton, M.G., Hunt, M., Minier, V., & Hill, T. 2004, In: Star Formation at High Angular Resolution, IAU, Symposium 221, in press
- (40) Rodgers, S.D., & Charnley, S.B. 2001, ApJ, 546, 324
- (41) Salter, C.J. 1983, The NRAO 12-m Telescope User’s Guide
- (42) Schutte, A., van der Walt, D., Gaylard, M., & MacLeod, G. 1993, MNRAS, 261, 783
- (43) Snell, R.L., & Bally, J., 1986, ApJ 303, 683
- (44) Sridharan, T.K., Beuther, H., Schilke, P., Menten, K.M., & Wyrowski, F. 2002, 566, 931
- (45) van der Walt, D.J., Churchwell, E., Gaylard, M.J., & Goedhart, S. 2003, MNRAS, 341, 270
- (46) Walsh, A., Burton, M., Hylard, A., & Robinson, G. 1998, MNRAS, 301, 640
- (47) Walsh, A.J., Macdonald, G.H., Alvey, N.D.S., Burton, M.G., & Lee, J.-K. 2003, A&A, 410, 597
- (48) Wilking, B.A., & Lada, C.J. 1983, ApJ, 274, 571