Clusters of Galaxies: New Results from the CLEF Hydrodynamics Simulation
Abstract
Preliminary results are presented from the CLEF hydrodynamics simulation, a large ( particles within a comoving box) simulation of the cosmology that includes both radiative cooling and a simple model for galactic feedback. Specifically, we focus on the X-ray properties of the simulated clusters at and demonstrate a reasonable level of agreement between simulated and observed cluster scaling relations.
keywords:
cosmology , clusters of galaxies , X-ray , numerical simulations , hydrodynamics , galaxy formationPACS:
95.30.Lz , 95.85.Nv , 98.65.Cw , 98.80.-k, , , , , , and
1 Introduction
As the largest and latest virialised structures to form, galaxy clusters are especially useful cosmological probes (e.g. see Viana et al., 2003, and references therein). Next generation cluster cosmology surveys, such as the XCS (Romer et al., 2001), will detect sufficiently large numbers of clusters that uncertainties in values of cosmological parameters will be mainly systematic, requiring for example an accurate calibration between cluster X-ray temperature and mass. Such measurements demand an improved understanding of cluster physics, therefore realistic numerical simulations of the cluster population are essential.
In this paper we present a preliminary analysis of the cluster population within the CLEF hydrodynamics simulation, a large state-of-the-art cosmological simulation that, besides gravity and gas dynamics, includes a model for the effects of galaxy formation. As we will show, the simulation does a reasonably good job at reproducing X-ray scaling relations at .
2 The CLEF hydrodynamics simulation
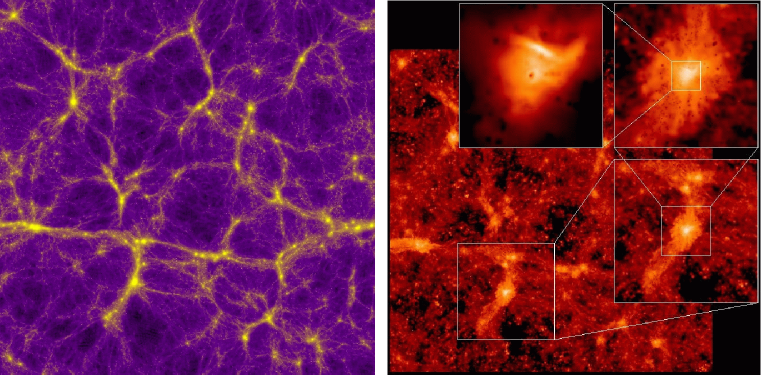
The CLEF (CLuster Evolution and Formation) hydrodynamics simulation (see Fig 1) is a large simulation of structure formation within the CDM cosmology, with the following cosmological parameters: , , , and . These values are in good agreement with recent WMAP analyses (Spergel et al., 2003).
Initial conditions were generated using a modified version of the cosmic software package provided with the hydra code (Couchman, Thomas and Pearce, 1995). The appropriate transfer function, generated using cmbfast (Seljak and Zaldarriaga, 1996), was read in and a displacement field generated for a comoving box at . Two regular cubic grids of particles, separated by half the interparticle distance in each of the and directions, were then perturbed by these displacements to create the initial particle positions. Thus, the gas and dark matter particle masses were set to and respectively.
This initial configuration was then evolved to using version 2 of the gadget code (Springel, Yoshida and White, 2001), a hybrid Particle-Mesh/Tree gravity solver with a version of Smoothed Particle Hydrodynamics (SPH) that explicitly conserves entropy where appropriate. In addition, the gas could cool radiatively, assuming a fixed metallicity of . Cooled gas, with and K, could either form stars if or be reheated by stars if , where is a random number drawn for each particle from the unit interval and is the reheated mass fraction parameter. Each reheated gas particle was given a fixed amount of entropy, , where , which further heats the ICM as the particle does work on its surroundings. Further details may be found in Kay et al. (2004).
3 X-ray scaling relations at
In this paper, we concentrate on comparing a selection of simulated and observed X-ray cluster scaling relations at . Clusters were identified by first identifying local maxima in the density field and growing spheres around these maxima until the average density within each sphere was a fixed factor, , above the critical density, . Values of used will be given in each subsection. For the virial density () there are clusters with keV ( above 3 keV).
3.1 Temperature–mass relation
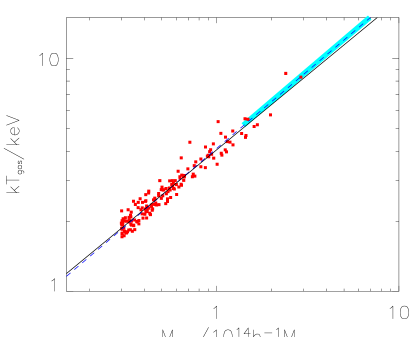
We begin by showing in Fig. 2 the relation between hot gas mass-weighted temperature (, where the sum is over all gas particles with K) and total mass for a density contrast . All clusters with are considered. The dashed line is a best-fit relation to the clusters for a fixed slope of 2/3, as expected if the clusters form a self-similar population. This relation is
| (1) |
where . When the slope is allowed to vary, the best-fit relation (solid line) is
| (2) |
close to the self-similar relation. The thick band is the observed relation derived by (Allen, Schmidt and Fabian, 2001), in good agreement with our results.
It is more common in the literature for observed temperature-mass relations to be presented at larger radii, using spectroscopic (photon-weighted) temperatures and mass estimates assuming -model surface brightness profiles and polytropic-model temperature profiles (e.g. Nevalainen, Markevitch and Forman 2000; Finoguenov, Reiprich and Böhringer 2001; Sanderson et al. 2003). These results generally suggest a slope closer to 1/2 than 2/3, attributed to non-gravitational processes (see below), and a normalisation that is offset in mass from simulation predictions by 40 per cent. Examining, for example, the X-ray emission-weighted temperature-mass relation from our simulation at , [, where is an energy-dependent cooling function], we find a similar slope to the observations (0.53) but an offset in normalisation comparable to previous simulations. The cause of this offset is likely due to incorrect estimates of cluster masses (e.g. Rasia et al., 2004) and is something we will return to in a future paper.
3.2 Entropy–temperature relation
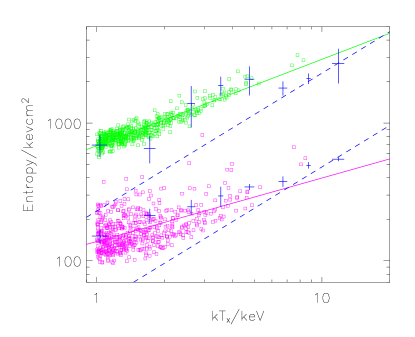
Galaxy formation increases the entropy of intracluster gas, producing a relationship with temperature that is flatter than the self-similar scaling (). We plot this relation in Fig. 3, again using an X-ray emission-weighted temperature for each cluster. Two radii are considered ( and ) and only clusters with keV are studied. Again, the simulated clusters are in reasonably good agreement with the observations (Ponman, Sanderson and Finoguenov, 2003), containing an excess of entropy that is larger in smaller systems. For
| (3) |
and for
| (4) |
3.3 Luminosity–temperature relation
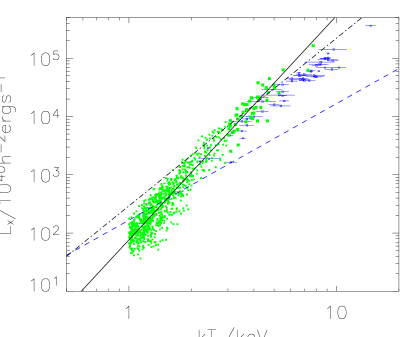
Finally, we show bolometric X-ray luminosity versus X-ray emission-weighted temperature in Fig. 4. Again, only clusters with keV are considered. Symbols with errors are observational data from Markevitch (1998) and Arnaud and Evrard (1999). To remain approximately consistent with this data, emission from within of our simulated cluster centres is omitted.
The dashed line is a best-fit relation for a fixed slope equal to 2 (self-similar), clearly a poor fit to the observations. When the slope is allowed to vary, the best-fit relation (solid line) is
| (5) |
where , considerably steeper than the self-similar case. In fact, the simulated relation is not adequately described by a power law since the local gradient becomes progressively flatter with increasing temperature. Fitting clusters with keV (dot-dashed line) yields
| (6) |
in reasonable agreement with the observations although the normalisation is a bit too high. Better agreement was reached by Kay et al. (2004), who used a slightly smaller gas fraction (0.15 rather than 0.162 used here, which is a closer match to the WMAP value). It is likely however that fine tuning of the feedback model parameters would improve the agreement between the simulated and observed relations.
References
- Allen, Schmidt and Fabian (2001) Allen, S. W., Schmidt, R., Fabian, A. C., The X-ray Virial Relations for Relaxed Lensing Clusters Observed with Chandra , 2001, MNRAS, 328, L37-L41
- Arnaud and Evrard (1999) Arnaud, M., Evrard, A. E., The Relation and Intracluster Gas Fractions of X-ray Clusters, 1999, MNRAS, 305, 631-640
- Couchman, Thomas and Pearce (1995) Couchman, H. M. P., Thomas, P. A., Pearce, F. R., Hydra: an Adaptive-Mesh Implementation of P3M-SPH, 1995, ApJ, 452, 797-813
- Finoguenov, Reiprich and Böhringer (2001) Finoguenov, A., Reiprich, T. H., Böhringer, H., Details of the Mass-Temperature Relation for Clusters of Galaxies, 2001, A&A, 368, 749-759
- Kay et al. (2004) Kay, S. T., Thomas, P. A., Jenkins, A., Pearce F. R., Cosmological Simulations of the Intracluster Medium, 2004, MNRAS, accepted (astro-ph/0407058)
- Markevitch (1998) Markevitch, M., The Relation and Temperature Function for Nearby Clusters Revisited, 1998, ApJ, 504, 27-34
- Nevalainen, Markevitch and Forman (2000) Nevalainen, J., Markevitch, M., Forman, W., The Cluster Relation from Temperature Profiles Observed with and , 2000, ApJ, 532, 694-699
- Ponman, Sanderson and Finoguenov (2003) Ponman, T. J., Sanderson A. J. R., Finoguenov A., The Birmingham-CfA cluster scaling project - III. Entropy and similarity in galaxy systems, 2003, MNRAS, 343, 331-342
- Rasia et al. (2004) Rasia, E., Mazzotta, P., Borgani, S., Moscardini, L., Dolag, K., Tormen, G., Diaferio, A., Murante, G., Mismatch Between X-ray and Emission-Weighted Temperatures in Galaxy Clusters: Cosmological Implications, 2004, ApJ, submitted (astro-ph/0409650)
- Romer et al. (2001) Romer, A. K., Viana, P. T. P., Liddle, A. R., Mann, R. G., A Serendipitous Galaxy Cluster Survey with XMM : Expected Catalog Properties and Scientific Applications, 2001, ApJ, 547, 594-608
- Sanderson et al. (2003) Sanderson, A. J. R., Ponman, T. J., Finoguenov, A., Lloyd-Davies, E. J., Markevitch, M., The Birmingham-CfA Cluster Scaling Project-I. Gas Fraction and the Relation, 2003, MNRAS, 340, 989-1010
- Seljak and Zaldarriaga (1996) Seljak, U., Zaldarriaga, M., A Line-of-Sight Integration Approach to Cosmic Microwave Background Anisotropies, 1996, ApJ, 469, 437-444
- Spergel et al. (2003) Spergel, D. N., et al. (the WMAP team), First-Year Wilkinson Microwave Anisotropy Probe (WMAP) Observations: Determination of Cosmological Parameters, 2003, ApJS, 148, 175-194
- Springel, Yoshida and White (2001) Springel, V., Yoshida, N., White, S. D. M., GADGET: a Code for Collisionless and Gasdynamical Cosmological Simulations, 2001, NewA, 6, 79-117
- Viana et al. (2003) Viana, P. T. P., Kay, S. T., Liddle, A. R., Muanwong, O., Thomas, P. A., The Power Spectrum Amplitude from Clusters Revisited: using Simulations with Preheating and Cooling, 2003, MNRAS, 346, 319-326