Chemical evolution in the environment of intermediate mass young stellar objects:
We have carried out a molecular survey of the Class 0 IM protostar NGC 7129 – FIRS 2 (hereafter FIRS 2) and the Herbig Be star LkH 234 with the aim of studying the chemical evolution of the envelopes of intermediate-mass (IM) young stellar objects (YSOs). Both objects have similar luminosities (500 L⊙) and are located in the same molecular cloud which minimizes the chemical differences due to different stellar masses or initial cloud conditions. Moreover, since they are located at the same distance, we have the same spatial resolution in both objects. A total of 17 molecular species (including rarer isotopes) have been observed in both objects and the structure of their envelopes and outflows is determined with unprecedent detail.
Our results show that the protostellar envelopes are dispersed and warmed up during the evolution to become a pre-main sequence star. In fact, the envelope mass decreases by a factor 5 from FIRS 2 to LkH 234, while the kinetic temperature increases from 13 K to 28 K. On the other hand, there is no molecular outflow associated with LkH 234. The molecular outflow seems to stop before the star becomes visible.
These physical changes strongly affect the chemistry of their envelopes. The N2H+ and NH3 abundances seem to be quite similar in both objects. However, the H13CO+ abundance is a factor of 3 lower in the densest part of FIRS 2 than in LkH 234, very likely because of depletion. In contrast, the SiO abundance is larger by a factor of 100 in FIRS 2 than in LkH 234. CS presents a complex behavior since its emission arises in different envelope components (outflow, cold envelope, hot core) and could also suffer from depletion. The CH3OH and H2CO column densities are very similar in FIRS 2 and LkH 234 which implies that the beam averaged abundances are a factor 5 larger in LkH 234 than in FIRS 2. The same case is found for the PDR tracers CN and HCN which have similar column densities in both objects. Finally, a complex behavior is found for the deuterated compounds. While the DCO+/H13CO+ ratio decreases by a factor of 4 from FIRS 2 to LkH 234, the D2CO/H2CO ratios is within a factor 1.5 in both objects. The detection of a warn CH3CN component with Tk63 K shows the existence of a hot core in FIRS 2. Thus far, only a handful of hot cores have been detected in low and intermediate mass stars.
Based on our results in FIRS 2 and LkH 234, we propose some abundance ratios that can be used as chemical clocks for the envelopes of IM YSOs. The SiO/CS, CN/N2H+, HCN/N2H+, DCO+/HCO+ and D2CO/DCO+ ratios are good diagnostics of the protostellar evolutionary stage.
Key Words.:
Stars: formation – pre-main sequence – individual: LkH 234 – ISM: abundances – clouds – individual: NGC 7129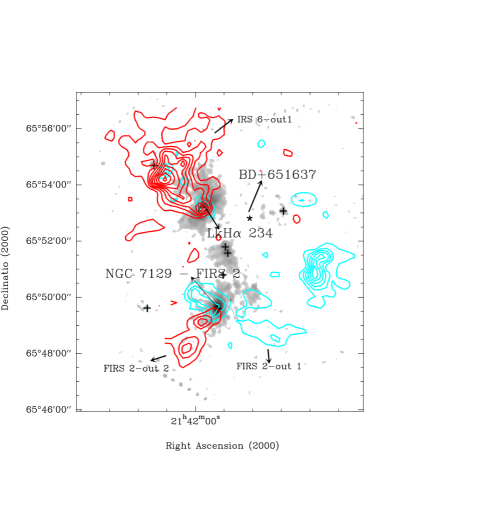
1 Introduction
Chemistry is a powerful tool to study young stellar objects (YSOs) and their environments. On the one hand, chemistry is a diagnostic tool of the different envelope components. On the other hand, it is a good time indicator during the protostellar evolution. Chemical studies have been used to determine the physical structure of low-mass YSOs (e.g. Maret et al. 2004; Jørgensen et al. 2004a, b). These studies have revealed, for example, the presence of warm regions where the ices evaporate giving rise to regions similar to hot cores in massive protostars. However, the chemistry of the two classes of objects is different and rises questions on the mechanisms that lead to the observed chemical complexity and its dependence on the stellar mass (Cazaux et al. 2003; Bottinelli et al. 2004).
Chemistry has also been used as a time evolution indicator in both low-mass and high-mass objects. For instance, Maret et al. (2004) studied a sample of low-mass Class 0 objects and found some indications that the H2CO abundance increases during the protostellar evolution. However, the different abundances can be due to different initial cloud conditions from which the protostars evolved. Further chemical studies are required to clarify this subject.
In this paper, we present a chemical study of the two intermediate mass (IM) YSOs, FIRS 2 and LkH 234. Contrary to low-mass protostars, IM YSOs have been very little studied thus far, specially young protostars. For example, out of 42 Class 0 sources compiled by André et al. (2000), only six had luminosities in excess of 40 L⊙ (the precursors to HAe stars) and only one had a luminosity of L⊙ (the precursor to HBe stars). IM YSOs (M∗ 2 -10 M⊙) are not only an important link between low mass and high mass stars but they share many characterisitcs of high mass star formation (clustering, PDR/HII regions) without the disadvantage of being too distant (d 1 Kpc), or too complex. They are also important for the understanding of planet formation since Herbig Ae stars are the precursors of Vega-type systems. On a larger scale, they dominate the mean UV interstellar field in our Galaxy (Wolfire et al. 2003).
2 Target selection and observational strategy
FIRS 2 has been classified as a Class 0 IM object (Eiroa et al. 1998) and is, very likely, the youngest IM object known at present. An energetic bipolar molecular outflow is associated with it (Fuente et al. 2001). LkH 234 is a embedded HBe star which still keeps a massive envelope (M16 M⊙) but no bipolar molecular outflow seems to be driven by it (Fuente et al. 2001, 2002). These objects have the peculiarity of having similar luminosities ( 500 L⊙) and be located in the same molecular cloud. During the protostellar and pre-main sequence evolution, the luminosity remains quite constant for a given stellar mass (André et al. 2000). Thus, the same luminosity implies similar stellar mass. In addition, both sources are located in the same molecular cloud. This minimizes chemical effects due to very different stellar mass (both of them have M∗ 5 M⊙) and/or different initial cloud conditions. Thus, in spite of our reduced sample, we have an excellent opportunity to find an evolutionary track for IM YSOs. In Fig. 1 we show the 1.3mm continuum map of the reflection nebula NGC 7129. Both, FIRS 2 (NGC 7129–FIRS 2) and LkH 234 (NGC 7129 – FIRS 1) are associated with intense centrally peaked 1.3mm continuum and far infrared sources. We have also overlaid the red and blue lobes (as traced by the 12CO J=21 line) of the bipolar outflows associated to these YSOs (see Fuente et al. 2001 for a more detailed description). Clustering becomes significant in this range of stellar masses (Testi et al. 1999). Interferometric observations towards LkH 234 show the existence of a young infrared companion (IRS 6) which is very likely the exciting source of the bipolar molecular outflow and the [SII] jet detected by Ray et al. (1990). The quadrupolar morphology of the ouflow detected in NGC 7129–FIRS 2 is also due to the superposition of two bipolar molecular outflows FIRS 2-out 1 and FIRS 2-out 2 (Fuente et al. 2001). Fuente et al. (2001) proposed that FIRS 2-out 1 is associated with the Class 0 protostar while FIRS 2-out 2 is more likely associated with a more evolved infrared star (FIRS 2 - IR).
A complex chemical evolution occured in the YSO envelopes during the protostellar evolution. This involves accretion of species in an icy mantle during the pre-collapse phase, followed by grain-surface chemistry and evaporation of ices once the YSO has started to heat its surroundings (e.g. Brown et al. 1988). In massive YSOs, the evaporated molecules drive a rapid high-temperature chemistry for a period of 104–105 years, resulting in the complex, saturated organic molecules (CH3OCH3,CH3CN,C2H5OH,…), which are characteristic of a hot core (e.g. Charnley et al. 1992; Caselli et al. 1993; Rodgers & Charnley 2003; Nomura & Millar 2004; Viti et al. 2004). Once most of the envelope has been cleared up, the UV radiation can escape to form a photon-dominated-region (PDR) and, in the case of massive stars, an HII region. Simultaneously, the energetic bipolar outflows develope a shock chemistry in the surrounding molecular cloud.
To discern between the different envelope components and determine the protostellar envelope evolution, we have selected a set of molecular tracers. Specifically, NH3, N2H+, H13CO+ and HC18O+ have been observed as tracers of the cold envelope; the volatile species CH3OH and H2CO to study the warm envelope where the icy grain mantles have been evaporated; the complex molecule CH3CN to trace the hot core; and, CN and HCN in order to trace the incipient PDR. In addition, we have also observed several CS and C34S lines that are useful to constrain the physical conditions of the envelope and SiO as an excellent tracer of the shock chemistry associated to the outflow. The observation of the deuterated compounds N2D+,DCO+ and D2CO also provide us some information about how the deuterium fractionation is affected by the YSO evolution. Obviously, the molecular tracer–envelope component correspondence is not unique and all the species have contributions from other envelope components. Arguments based on the morphology of the emission, kinematics and different excitation conditions are used to discern between the different components in these cases.
3 Observations
The (J,K) = (1,1), (2,2), (3,3) and (4,4) inversion lines of ammonia were observed using the Effelsberg 100–m radiotelescope of the MPIfR in December 2000 and October 2002. We observed only one position in both sources. The half power beam width (HPBW) of the telescope at the rest frequency of the NH3 lines, 23.7 GHz, was 40″. We used the new cooled dual-channel HEMT K–band receiver with a typical system temperature of 200 K on a main beam brightness temperature scale. The 8192–channel autocorrelator was used as the backend. The four ammonia lines were observed simultaneously with a total bandwidth of 10 MHz and a channel separation of 0.098 km s-1. We estimate that line intensities are accurate to within 15%.
The main set of observations were carried out with the IRAM 30m telescope in Pico de Veleta (Spain) during three different observing periods in May 1999, July 2002 and August 2003. The list of observed lines, the telescope characteristics at each frequency and a summary of the observations are shown in Table 1. When possible, all the lines of the same molecule were observed simultaneously in order to avoid observational errors. The backends were an autocorrelator split in several parts and a 256 100 kHz filter-bank. All the lines were observed with a spectral resolution of 78 kHz except in the cases that are explicitly indicated in Table 1. The intensity scale used in this paper is main brightness temperature. Comparing the intensity of some pattern lines in different observing periods, we estimate that the calibration is accurate within a 20 % at 3mm and within a 30% at 1.3mm. We have observed a high S/N ratio spectra towards the star positions for all the lines listed in Table 1. In addition, we have carried out small maps in the most intense lines (see Table 1). In the case of the SiO 21, SiO 32, H13CO+ 10 and CS 32 lines we have mapped the entire outflows as traced by the high velocity CO emission. Fits to the oberved lines at the (0,0) position are shown in Tables 2 and 3.
| Line | Freq. (GHz) | HPBW | Observed positions | |
|---|---|---|---|---|
| N2H+ 10 | 93173.2 | 26.5′′ | 0.71 | 60′′60′′ map |
| CN 10 | 113490.0 | 23′′ | 0.65 | 60′′60′′ map (FIRS 2), 60100′′ map (LkH 234) |
| HCN 10 | 88631.8 | 27.5′′ | 0.73 | 60′′60′′ map (FIRS 2), 60100′′ map (LkH 234) |
| H13CO+ 10 | 86754.3 | 27.5′′ | 0.73 | complete map |
| HC18O+ 10 | 85162.2 | 27.5′′ | 0.73 | (0,0) |
| SiO 21 | 86846.9 | 27.5′′ | 0.73 | complete map |
| SiO 32 | 130268.6 | 20′′ | 0.60 | complete map |
| CS 32 | 146969.0 | 16.5′′ | 0.55 | complete map |
| C34S 21 | 96412.9 | 25.9′′ | 0.70 | (0,0) |
| C34S 32 | 144617.1 | 17′′ | 0.55 | (0,0) |
| C34S 54 | 192818.5 | 13′′ | 0.47 | (0,0) |
| CH3OH 2(1,3)1(1,3) | 96755.5 | 26′′ | 0.70 | 72′′72′′ map |
| CH3OH 2(0,3)1(0,3) | 96744.6 | 26′′ | 0.70 | 72′′72′′ map |
| CH3OH 2(1,4)1(1,4) | 96741.4 | 26′′ | 0.70 | 72′′72′′ map |
| CH3OH 2(0,1)1(0,1) | 96739.4 | 26′′ | 0.70 | 72′′72′′ map |
| CH3OH 3(0,3)2(0,3) | 145093.7 | 17′′ | 0.55 | (0,0) |
| CH3OH 3(1,4)2(1,4) | 145097.5 | 17′′ | 0.55 | (0,0) |
| CH3OH 3(0,1)2(0,1) | 145103.2 | 17′′ | 0.55 | (0,0) |
| CH3OH 3(2,2)2(2,2)a | 145124.4 | 17′′ | 0.55 | (0,0) |
| CH3OH 3(1,3)2(1,3) | 145131.9 | 17′′ | 0.55 | (0,0) |
| CH3OH 5(2,4)4(2,4) | 241904.1 | 10′′ | 0.40 | 72′′72′′ map |
| CH3OH 5(0,1)4(0,1) | 241791.4 | 10′′ | 0.40 | 72′′72′′ map |
| CH3OH 5(1,4)4(1,4) | 241767.2 | 10′′ | 0.40 | 72′′72′′ map |
| CH3OH 5(3,1)4(3,1) | 241832.9a | 10′′ | 0.40 | 72′′72′′ map |
| CH3OH 5(2,2)4(2,2) | 241842.3 | 10′′ | 0.40 | 72′′72′′ map |
| CH3OH 8(1,4)7(0,3) | 229758.7 | 10.5′′ | 0.42 | (0,0) |
| CH3OH 11(1,4)10(2,4) | 104300.5 | 24.5′′ | 0.68 | (0,0) |
| H2CO 312211 | 225697.8 | 10.5 | 0.43 | 60′′60′′ map (FIRS 2), 72′′72′′ map (LkH 234) |
| H2CO 212111 | 140839.5 | 18′′ | 0.57 | 60′′60′′ map (FIRS 2), 72′′72′′ map (LkH 234) |
| H213CO 212111 | 137449.9 | 18′′ | 0.57 | (0,0) |
| CH3CN 5(0)4(0) | 91987.0 | 27′′ | 0.72 | (0,0) |
| CH3CN 5(1)4(1) | 91985.3 | 27′′ | 0.72 | (0,0) |
| CH3CN 5(2)4(2) | 91980.0 | 27′′ | 0.72 | (0,0) |
| CH3CN 5(3)4(3) | 91971.4 | 27′′ | 0.72 | (0,0) |
| CN 21 | 226874.7 | 11′′ | 0.42 | 60′′60′′ map (FIRS 2), 60100′′ (LkH 234) |
| N2D+ 32 | 231321.7 | 10.5′′ | 0.42 | (0,0) |
| DCO+ 21 | 144077.3 | 17′′ | 0.56 | 60′′60′′ map |
| DCO+ 32 | 216112.6 | 11′′ | 0.44 | 60′′60′′ map |
| D2CO 404303 | 231410.3 | 10.5′′ | 0.42 | (0,0) |
a Only observed with a frequency resolution of 1 MHz.
| Line | TMB | V (km s-1) | V (km s-1) | |
|---|---|---|---|---|
| NH3 (1,1) | 3.08(0.07) | -9.59(0.01) | 1.0(0.1) | 0.1a |
| NH3 (2,2) | 0.70(0.02) | -9.63(0.02) | 1.3(0.1) | 0.1a |
| NH3 (3,3) | 0.12(0.01) | -9.35(0.18) | 3.8(0.5) | 0.1a |
| NH3 (4,4) | rms = 0.05 K kms-1 with v=3.0 kms-1 | |||
| N2H+ 10 | 9.22(0.02) | -9.51(0.01) | 1.91(0.01) | 1.28(0.10) |
| CN 10 | 2.3(0.3) | -9.7(0.1) | 1.4(0.1) | 1.9 |
| HCN 10 | 2.3(0.3) | -9.3(0.1) | 3.1(0.1) | 0.7 |
| Line | Area (K kms-1) | V (km s-1) | V (km s-1) | TMB (K) |
| H13CO+ 10 | 1.92(0.02) | -9.74(0.01) | 1.27(0.02) | 1.39 |
| HC18O+ 10 | 0.17(0.02) | -9.68(0.09) | 1.1(0.2) | 0.14 |
| SiO 21 | 1.55(0.09) | -7.5(0.2) | 6.8(0.4) | 0.21 |
| 0.23(0.06) | -9.5(0.1) | 1.6(0.4) | 0.13 | |
| SiO 32 | 2.50(0.20) | -7.3(0.2) | 6.9(0.7) | 0.34 |
| CS 32 | 3.69(0.12) | -9.1(0.1) | 5.81(0.24) | 0.60 |
| 1.88(0.09) | -9.9(0.1) | 1.19(0.04) | 1.48 | |
| C34S 21 | 0.16(0.08) | -7.8(0.8) | 3.1(1.3) | 0.05 |
| 0.28(0.07) | -9.8(0.1) | 1.3(0.2) | 0.20 | |
| C34S 32 | 1.05(0.08) | -9.4(0.1) | 4.3(0.4) | 0.23 |
| C34S 54 | 1.21(0.16) | -8.8(0.3) | 4.2(0.7) | 0.27 |
| CH3OH 2(1,3)1(1,3) | 0.6(0.3) | -9(1) | 5(3) | 0.11 |
| CH3OH 2(0,3)1(0,3) | 1.85(0.06) | -8.20(0.09) | 6.1(0.2) | 0.28 |
| CH3OH 2(1,4)1(1,4) | 4.71(0.05) | -9.2(0.2) | 3.0(0.2) | 1.47 |
| CH3OH 2(0,1)1(0,1) | 5.83(0.07) | -9.58(0.01) | 5.3(0.1) | 1.03 |
| CH3OH 3(0,3)2(0,3) | 4.12 (0.04) | -8.78(0.08) | 6.98(0.08) | 0.55 |
| CH3OH 3(1,4)2(1,4) | 8.9(0.09) | -8.32(0.01) | 5.71(0.07) | 1.46 |
| CH3OH 3(0,1)2(0,1) | 9.6(0.1) | -8.34(0.02) | 5.07(0.06) | 1.78 |
| CH3OH 3(2,2)2(2,2) | 2(1) | -12(4) | 7(10) | 0.27 |
| CH3OH 3(1,3)2(1,3) | 1.9(0.1) | -8.7(0.2) | 6.4(0.5) | 0.28 |
| CH3OH 5(2,4)4(2,4) | 3(1) | -8.9(0.7) | 4(2) | 0.70 |
| CH3OH 5(0,1)4(0,1) | 12.3(0.7) | -7.4(0.1) | 4.6(0.3) | 2.51 |
| CH3OH 5(1,4)4(1,4) | 8.8(0.8) | -7.8(0.2) | 4.6(0.5) | 1.80 |
| CH3OH 5(3,1)4(3,1) | 1.7(1.7) | -8.1(3) | 6.9(7) | 0.23 |
| CH3OH 5(2,2)4(2,2) | 1.3(1.5) | -10(4) | 7(11) | 0.17 |
| CH3OH 8(1,4)7(0,3) | 4.5(0.4) | -7.7(0.1) | 4.3(0.3) | 0.98 |
| CH3OH 11(1,4)10(2,4) | 0.14(0.04) | -9.9(0.4) | 3.6(5.9) | 0.04 |
| H2CO 312211 | 2.3(0.2) | -9.6(0.1) | 1.3(0.1) | 1.66 |
| 6.7(0.3) | -8.6(0.2) | 7.7(0.5) | 0.81 | |
| H2CO 212111 | 3.0(0.1) | -9.66(0.01) | 1.41(0.03) | 2.00 |
| 6.0(0.1) | -8.97(0.06) | 6.3(0.2) | 0.91 | |
| H213CO 212111 | 0.33(0.04) | -9.4(0.2) | 2.8(0.5) | 0.11 |
| CH3CN 5(0)4(0) | 0.24(0.05) | -9.1(0.4) | 4.2(0.8) | 0.05 |
| CH3CN 5(1)4(1) | 0.25(0.05) | -9.1(0.6) | 5(1) | 0.05 |
| CH3CN 5(2)4(2) | 0.11(0.02) | -9.7(0.9) | 4(2) | 0.02 |
| CH3CN 5(3)4(3) | 0.12(0.02) | -8(1) | 7(3) | 0.02 |
| CN 21 | 2.74(0.24) | -9.7(0.1) | 2.6(0.2) | 1.0 |
| N2D+ 32 | 0.64(0.05) | -9.90(0.04) | 1.1(0.1) | 0.53 |
| DCO+ 21 | 2.93(0.04) | -9.86(0.01) | 1.0(0.1) | 2.61 |
| DCO+ 32 | 1.9(0.1) | -9.73(0.02) | 1.0(0.1) | 1.83 |
| D2CO 404303 | 0.3(0.1) | -9.6(0.3) | 3.9(1) | 0.05 |
a In case of optically thin emission, cannot be determined and is set arbitrarily to 0.1.
| Line | TMB | V (km s-1) | V (km s-1) | |
|---|---|---|---|---|
| NH3 (1,1) | 0.60(0.03) | -9.87(0.02) | 0.9(0.2) | 0.86(0.07) |
| NH3 (2,2) | 0.27(0.04) | -9.94(0.05) | 1.1(0.2) | 0.1a |
| NH3 (3,3) | 0.10(0.03) | -11(1) | 1.6(0.7) | 0.1a |
| NH3 (4,4) | rms = 0.13 K kms-1 with v=1.1 kms-1 | |||
| N2H+ 10 | 1.53(0.06) | -9.48(0.01) | 1.82(0.04) | 1.32(0.7) |
| CN 10 | 1.9(0.2) | -9.9(0.1) | 2.6(0.1) | 0.8 |
| HCN 10 | 3.2(0.3) | -10.0(0.1) | 2.9(0.1) | 0.1a |
| Line | Area (K kms-1) | V (km s-1) | V (km s-1) | TMB (K) |
| H13CO+ 10 | 1.00(0.03) | -9.80(0.03) | 1.79(0.07) | 0.52 |
| HC18O+ 10 | 0.14(0.04) | -10.1(0.2) | 2(1) | 0.06 |
| SiO 21 | 0.31(0.06) | -9.9(0.9) | 8.5(2.0) | 0.03 |
| SiO 32 | 0.60(0.08) | -8.7(0.2) | 3.2(0.5) | 0.18 |
| CS 32 | 14.9(0.2) | -9.7(0.1) | 3.0(0.1) | 4.67 |
| C34S 21 | 0.66(0.04) | -9.9(0.1) | 3.4(0.2) | 0.18 |
| C34S 32 | 1.41(0.05) | -9.5(0.1) | 3.2(0.2) | 0.41 |
| C34S 54 | 1.71(0.22) | -9.1(0.3) | 4.5(0.8) | 0.36 |
| CH3OH 2(1,3)1(1,3) | 0.3(0.1) | -7(3) | 12(5) | 0.02 |
| CH3OH 2(0,3)1(0,3) | 0.20(0.04) | -9.8(0.3) | 2.9(0.7) | 0.06 |
| CH3OH 2(1,4)1(1,4) | 0.48(0.03) | -9.6(0.1) | 2.2(0.2) | 0.20 |
| CH3OH 2(0,1)1(0,1) | 0.64(0.04) | -9.5(0.1) | 5.2(0.4) | 0.11 |
| CH3OH 3(0,3)2(0,3) | 1.27(0.09) | -9.5(0.1) | 4.6(0.4) | 0.26 |
| CH3OH 3(1,4)2(1,4) | 1.91(0.09) | -9.2(0.1) | 4.8(0.3) | 0.37 |
| CH3OH 3(0,1)2(0,1) | 1.94(0.07) | -9.2(0.1) | 3.3(0.2) | 0.55 |
| CH3OH 3(2,2)2(2,2) | 1.6(0.4) | -12(1) | 9(4) | 0.17 |
| CH3OH 3(1,3)2(1,3) | 1.3(0.4) | -10(1) | 8(3) | 0.15 |
| CH3OH 5(2,4)4(2,4) | 2.6(0.5) | -9.4(0.5) | 5(1) | 0.49 |
| CH3OH 5(0,1)4(0,1) | 2.9(0.2) | -8.8(0.1) | 4.1(0.6) | 0.66 |
| CH3OH 5(1,4)4(1,4) | 2.1(0.2) | -9.2(0.1) | 3.1(0.2) | 0.64 |
| CH3OH 8(1,4)7(0,3) | 2.0(0.3) | -9.7(0.5) | 7(1) | 0.27 |
| CH3OH 11(1,4)10(2,4) | 0.13(0.04) | -9.9(0.8) | 6(2) | 0.02 |
| H2CO 312211 | 5.4(0.3) | -9.4(0.1) | 2.2(0.1) | 2.2 |
| 5.9(0.3) | -9.8(0.1) | 5.5(0.2) | 1.0 | |
| H2CO 212111 | 8.1(0.6) | -9.7(0.1) | 2.4(0.1) | 3.1 |
| 3.1(0.6) | -9.5(0.2) | 6(1) | 0.5 | |
| H213CO 212111 | 0.24(0.05) | -9.4(0.4) | 4(1) | 0.05 |
| CH3CN 5(0)4(0) | 0.17(0.02) | -10.2(0.2) | 2.6(0.4) | 0.06 |
| CH3CN 5(1)4(1) | 0.16(0.02) | -9.9(0.2) | 2.9(0.4) | 0.05 |
| CH3CN 5(2)4(2) | 0.07 K kms-1 with v=3.2 km s-1 | |||
| CH3CN 5(3)4(3) | 0.07 K kms-1 with v=3.2 km s-1 | |||
| CN 21 | 6.0(0.3) | -9.0(0.1) | 2.9(0.2) | 1.9 |
| N2D+ 32 | =0.11 K kms-1 en v= 1.5 km s-1 | |||
| DCO+ 21 | 0.62(0.04) | -9.58(0.04) | 1.5(0.1) | 0.38 |
| DCO+ 32 | 0.76(0.07) | -9.4(0.1) | 2.2(0.2) | 0.33 |
| D2CO 404303 | 0.60(0.2) | -9.1(0.5) | 4(1) | 0.15 |
a In case of optically thin emission, cannot be determined and is set arbitrarily to 0.1.
| NGC 7129 – FIRS 2 | LkH 234 | ||||||||
|---|---|---|---|---|---|---|---|---|---|
| Molecule | Comp | Trot (K) | Nb (cm-2) | Molecule | Comp | Trot (K) | Nb (cm-2) | ||
| NH3 | Cold | 13 | 4.9 1014 | NH3 | Cold | 22 | 4.0 1013 | 8′′ | |
| Warm | 31 – 87 | 1.5 1013 | Warm | 49 – 134 | 1.1 1013 | ||||
| N2H+ | 13a | 3.8 1013 | 21′′ | N2H+ | 22a | 1.0 1013 | 8′′ | ||
| H13CO+ | 13a | 2.2 1012 | H13CO+ | 22a | 1.7 1012 | ||||
| CH3OH | 17 | 7.8 1014 | CH3OHp | 24 | 1.4 1014 | ||||
| Hot core | 80 | 2.0 1014 | 250 | 4.0 1014 | |||||
| CH3OHe | 59 | 4.8 1014 | |||||||
| H2CO | Narrow | 10 | 2.2 1013 | H2CO | 11 | 8.0 1013 | |||
| Wide | 9 | 4.8 1013 | |||||||
| H213CO | 10a | 2.3 1012 | H213CO | 11a | 2.4 1012 | ||||
| CH3CN | Hot core | 63 | 3.6 1012 | CH3CN | 53 | 2.0 1012b | |||
| CN | 5 | 4.8 1013 | CN | 6.5 | 6.1 1013 | ||||
| HCN | 5a | 1.6 1013 | HCN | 6.5a | 2.1 1013 | ||||
| N2D+ | 13a | 5.4 1011 | N2D+ | 22a | 2.3 1011 | ||||
| DCO+ | 8.5 | 1.8 1012 | DCO+ | 17 | 4.2 1011 | ||||
| D2CO | 10a | 2.0 1012 | D2CO | 11a | 3.7 1012 | ||||
a Assumed rotation temperature.
p Assuming a point source.
e Assuming a beam filling factor of 1.
4 Analysis
The data have been analysed using the rotation diagram method. The molecular constants, the upper state energies and the partition functions required for applying this method have been taken from the JPL line catalog (Pickett et al. 1998). This method gives the rotation temperature and total column density of a particular species knowing the integrated line intensities of several lines with different upper state energies. The rotation temperatures and column densitites estimated in this way are shown in Table 4. The rotation temperature is a lower limit to the gas kinetic temperature, and only constitutes a good measure of the kinetic temperature if the lines are thermalized. This is the case of the ammonia inversion lines which are thermalized with densities, n103 cm-3. For this reason, we have used the NH3 inversion lines to estimate the gas kinetic temperature of the different envelope components.
For some molecules we have only observed one transition. In this case we have calculated the total column density assuming optically thin emission, local thermodynamic equilibrium (LTE) and the rotation temperature derived from a molecule with similar excitation requirements. In these cases we have marked with the superindex a” the rotation temperature in Table 4.
The molecules NH3, N2H+, CN and HCN present hyperfine splitting. This allows us to derive the line opacity directly from the hyperfine line ratios. In these cases the column densities have been estimated directly from the line opacities. For N2H+ and NH3, we have also calculated the source size assuming the rotation temperature derived from the NH3 inversion lines when the opacity of the main component is determined. We have made LVG calculation for SiO, CS and C34S. These calculations are shown in Tables 6 and 8. In all the cases, we have fitted the densities assuming a fixed kinetic temperature. The assumed gas kinetic temperatures are based on those derived from the NH3 data in Section 5.1 and are shown in Table 6 and 8. We have used the CS collisional coefficients calculated by Green & Chapman (1978) in the LVG calculations. The same collisional coefficients are used for SiO. This is a reasonable approximation since both molecules have the same mass and similar dipole moments. In the case of CS, we have been able to calculate the opacity and the source size because we have observed the main isotope and the rarer isotope C34S. All the column densities in Table 4, 6 and 8 are beam averaged column densities.
5 Results
5.1 NH3
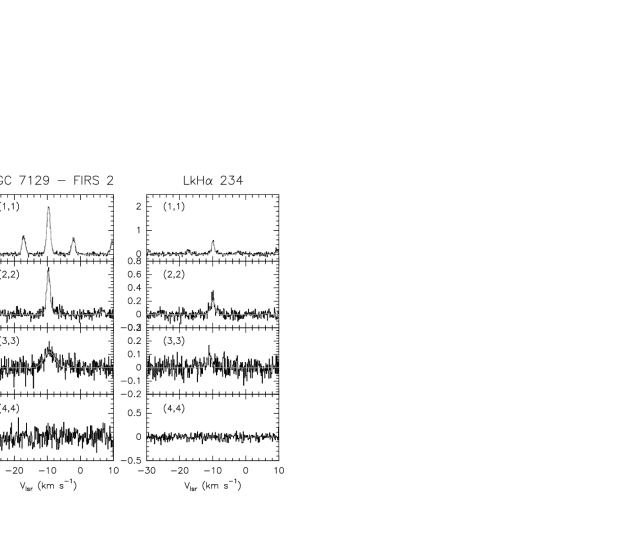
We have observed the ammonia (1,1), (2,2), (3,3) and (4,4) inversion transitions towards NGC 7129 – FIRS 2 and LkH 234. All the spectra are shown in Fig. 1. The (1,1), (2,2) and (3,3) lines have been detected in both sources but only an upper limit has been obtained for the (4,4) line. We have fitted these lines using the NH3 procedure in the CLASS (this is the program dedicated to the analysis of single-dish spectra of the GILDAS softwares (http://www.iram.fr/IRAMFR/GILDAS). This procedure fit all the hyperfine components assuming equal excitation temperature, central velocity and linewidth. The parameters given by the procedure are , , V, and where is the main group opacity and the excitation temperature (see Bachiller et al. 1987 for a more detailed description of this procedure). In case of optically thin emission cannot be determined and is set arbitrarily to 0.1.
The fits to the NH3 lines in NGC 7129–FIRS 2 are shown in Table 2. The NH3 emission is optically thin in all the lines. However, the linewidth of the (3,3) line is almost a factor of 3 larger than the linewidth of the (1,1) and (2,2) lines (see Table 2 and Fig. 2). In addition, the central velocity of the lines is slightly lower than those of the lower energy lines. This suggests that the (3,3) line is arising in a different region that the (1,1) and (2,2) lines. This interpretation is reinforced by the NH3 rotational diagram (see Fig. 3). The three lines detected in NGC 7129–FIRS 2 cannot be fitted by one single straight line which implies the existence of at least two gas components with different rotation temperatures, a cold component traced by the (1,1) and (2,2) lines and a hot component only detected with the (3,3) line. Using the (1,1) and (2,2) lines, we derive a rotation temperature, T12=13 K and a column density, N(NH3)=4.9 1014 cm-2 for the cold component. Because of the lack of radiative transitions between different K-ladders, the ammonia inversion lines are good thermometers of dense clouds. In fact, detailed radiative transfer calculations for NH3 show that Tk=T12 for Tk20 K (Danby et al. 1988). This low value of the kinetic temperature in the cold envelope implies that depletion could be important in this young protostar.
Since we have not detected the (4,4) line, we can only derive lower and upper limits for the rotation temperature of the hot component. The lower limit is given for the excitation temperature between the (1,1) and (3,3) lines, and the upper limit is given for the excitation temperature between the (3,3) line and the upper limit to the (4,4) line. We obtain that the hot component has a rotation temperature, Trot30 –90 K, which implies a lower limit of 50 K to the kinetic temperature of this component. We have estimated N(NH3)1.5 1013 cm-3 for the hot component. This value has been derived from the integrated intensity of the (3,3) line assuming Trot=90 K and LTE conditions and is, in fact, a lower limit to the actual column density of the hot gas.
The same procedure has been repeated for the ammonia lines towards LkH 234. Similarly to NGC 7129 – FIRS 2, the ammonia emission towards LkH 234 cannot be fitted with one single rotation temperature (see Fig. 3). However, in this case the linewidth of the (3,3) line is more similar to those of the (1,1) and (2,2) lines (see Table 3). The linewidths seem to increase monotonically with the energy of the transition, but there is not a jump between the linewidth of the (3,3) line and those of the others as in the case of the protostar. We have fitted a two components model to the rotational diagram in LkH 234 and obtained rotation temperatures of 22 K and 49–134 K for cold and hot components respectively. This implies a kinetic temperature of Tk28 K for the cold envelope (Danby et al. 1988) and a lower limit of Tk100 K for the hot component. Contrary to FIRS 2, the (1,1) line is moderately thick in this source. This allows us to estimate the size of the NH3 emission. Assuming that the excitation temperature of the (1,1) line is equal to the rotation temperature of the cold component, we obtain a size of 8′′, which is lower than the size of the clump in the 1.3mm continuum emission.

5.2 N2H+, H13CO+
Recent studies in pre-stellar cores reveal that the widely used tracers of dense gas, C18O and CS, are not adequate to trace dense cold clumps. Both are strongly depleted in the core at densities of a few 104 cm-3 and Tk20 K (Tafalla et al. 2004) . Only nitrogenated molecules seem to be unaffected by depletion. In fact, N2H+ seems to keep a constant abundance through the core and is an excellent tracer of the cold gas (e.g. Caselli et al. 1999; Tafalla et al. 2002).
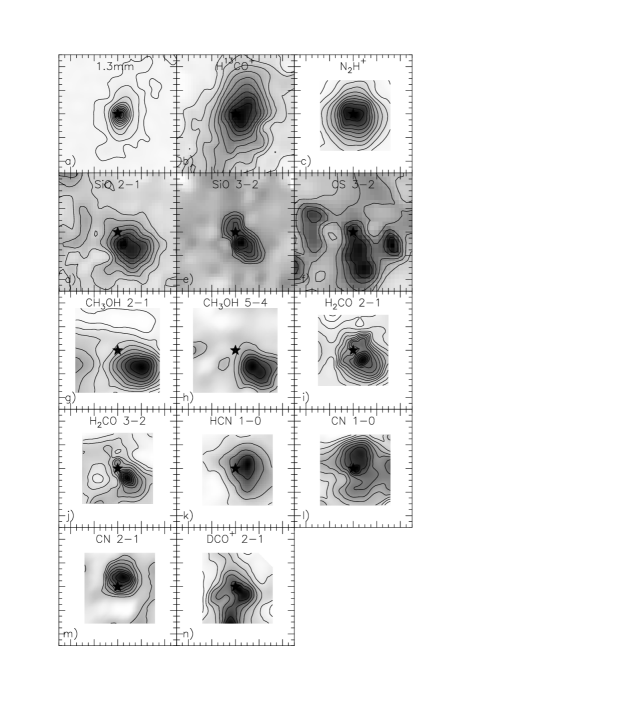
We have made small maps in the N2H+ 1-0 and the H13CO+ 1–0 lines toward FIRS 2 and LkH 234. In addition we have observed the HC18O+ line towards the star position to have an estimate of the opacity of the H13CO+ 1–0 line. In Fig. 4 and 5 we show the N2H+ 1-0 and the H13CO+ 1–0 line integrated intensity maps together with the continuum map at 1.3mm, and in Table 2 and 3 we show the fits to the molecular lines. Due to the splitting of the N2H+ 10 line, we can have an estimate of the line opacity using the same method as in the case of NH3.
Intense centrally-peaked emission is observed in the continuum map at 1.3mm toward FIRS 2. The same morphology is observed in the H13CO+ and N2H+ maps, although the profile of the H13CO+ emission is flatter than that of N2H+. To quantify this difference in the emission profile, we have calculated the line intensity ratio, = , where is the intensity of the main component of the N2H+ 10 line and the intensity of the H13CO+ 10 line, in a radial strip at 0′′ offset in declination. The ratio r1 changes from 2.7 at the center of the clump to 1.5 at an offset of (30′′,0′′). Using the LTE approximation with Trot = 13 K (based on our NH3 calculations) and assuming optically thin emission in the H13CO+ line, we derive that the N2H+/H13CO+ abundance ratio changes from 17 in the (0,0) position to 5 at (-30′′,0 ). Thus, the abundance of H13CO+ relative to N2H+ seems to decrease by a factor of 3 towards the clump center. However, this change in the estimated H13CO+ abundance could be due to the larger opacity of the H13CO+ line. To constrain the opacity of the H13CO+ 10 line, we have observed the HC18O+ 10 line towards the (0,0) position. The H13CO+ 10 /HC18O+ 10 line intensity ratio is 11, showing that the H13CO+ 1–0 line is optically thin at this position.
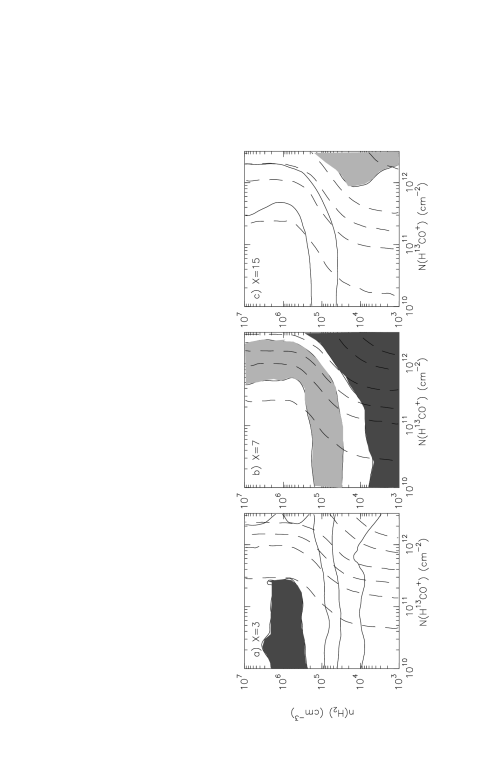
In the above calculations, we have assumed that the rotation temperature is uniform in all the strip. This assumption could be unrealistic since the density and kinetic temperature are expected to decrease with the distance from the star. We have used an LVG code to investigate if the different values of are due to a gradient in the physical conditions in the clump or/and are the result of a change in the relative abundance of both molecules. Since we are comparing the ground state lines of both species, the ratio is very little dependent on the kinetic temperature and depends mainly on the hydrogen density and the N2H+/H13CO+ abundance ratio. In Fig. 6 we show the ratio and the opacity of the main hyperfine N2H+ 10 line for a wide range of physical conditions assuming X= N2H+/H13CO+=3,7,15. The values of the opacity and measured towards the star position can only be fitted assuming X=15 (see Fig. 6). A lower value of X would imply that the N2H+ line is optically thin in contradiction with our observational results. On the contrary, the value measured at the offset (–30′′,0′′) can only be fitted with X 7. Thus we conclude that the gradient in the value of cannot be due to the expected gradient in the excitation temperature of the observed lines across the clump, but to a gradient in the N2H+/H13CO+ abundance ratio.
As commented above, detailed studies in pre-stellar clumps show that the abundance of N2H+ remains constant in these cold clumps while H13CO+ could suffer from depletion in the densest part (Lee et al. 2003; Caselli et al. 2002). Assuming that N2H+ has a constant abundance in the clump, we need to assume an H13CO+ depletion factor 2 to fit our observations.
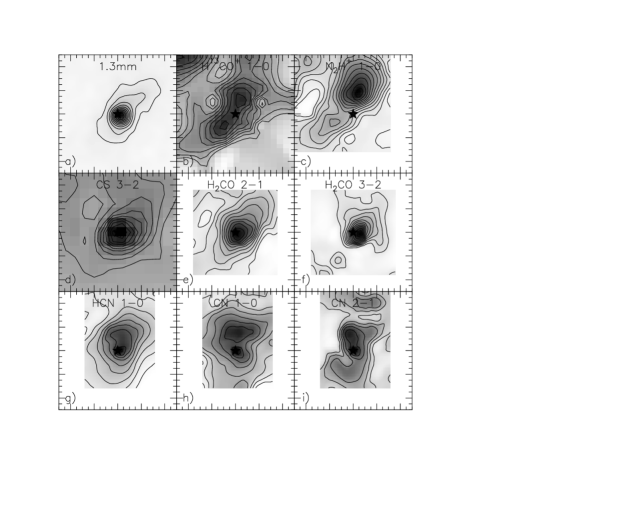
The integrated intensity maps of the H13CO+ 10 and N2H+ 10 lines towards LkH 234 are shown in Fig. 5. The N2H+ 10 map presents a very different morphology to that of the continuum and the H13CO+ maps. While the continuum map presents a intense point-like emission at the position of LkH 234, the N2H+ map peaks at the offset (–6′′,+18′′). The map of the H13CO+ line show both peaks. As we will argue in the following, these different morphologies can only be explained if one assumes a different temperature and chemistry between both peaks.
In Table 4 we show the estimated N2H+ and H13CO+ column densities in LKH 234 assuming a rotation temperature of 22 K derived from the NH3 observations. We have obtained N(N2H+)1.0 1013 cm-2 and a N2H+/H13CO+ abundance ratio of 6. The N2H+/H13CO+ ratio in LkH 234 is lower than that found in FIRS 2.
We have repeated the same calculations for the offset (-6′′,+18′′). Continuum observations suggests that this clump is colder than that associated to LkH 234. In fact, if we assume that the N2H+ abundance is uniform in the region and a typical dust temperature of 30 K towards LkH 234, we need to assume a dust temperature 10 K at the offset (-6′′,+18′′) in order to explain the measured continuum flux. Thus, we have assumed a rotation lower temperature, Trot10 K, in our LTE caculations. With these assumptions, we obtain a N2H+ column density of 1.3 1013 cm-2 and a N2H+/H13CO+ abundance ratio of 10. This value is intermediate between those measured in LkH 234 and FIRS 2. However, the difference is of a factor of 2 which is within the uncertainty involved in these kind of calculations. Based on our results, we can propose an evolutionary trend based on the N2H+/H13CO+ ratio. This ratio is maximum in the IM Class 0 object FIRS 2 where molecular depletion is significant, it may take an intermediate value in the infrared low-mass star IRS 6 and is minimum in the envelope of the more evolved object, the HBe star LkH 234.
| Source | Trot (K) | N(H13CO+) | N(N2H+) | N2H+/H13CO+ |
|---|---|---|---|---|
| (K) | (cm-2) | (cm-2) | ||
| FIRS 2 | 13 | 2.2 1012 | 3.8 1013 | 17 |
| (–30,0) | 13 | 8.0 1011 | 4.2 1012 | 5 |
| LkH 234 | 22 | 1.7 1012 | 1.0 1013 | 6 |
| (–6,+18) | 10 | 8.8 1011 | 8.5 1012 | 10 |
5.3 CO outflows, SiO
The SiO abundance is strongly enhanced (up to several orders of magnitude) in shocked regions. However, its abundance is very low in dark clouds and PDRs (Schilke et al. 2001). Because of this peculiarity, SiO is used as a diagnostic for shocks in both galactic and extragalactic regions (e.g. Bachiller et al. 1991; Martín-Pintado et al. 1992; García-Burillo et al. 2000, 2001). In particular, it is commonly used to look for the energetic outflows associated with the youngest stellar objects. We have carried out maps of the J=21 and 32 rotational lines of SiO around FIRS 2 and LkH 234 to study the physical conditions and chemistry of the bipolar outflows found in these regions.
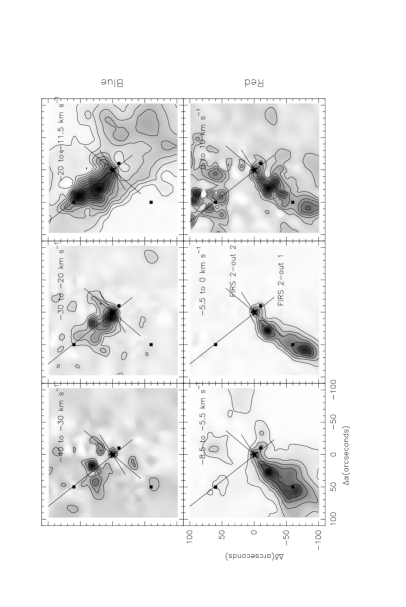
Interferometric and single-dish CO 21 observations show the existence of two bipolar outflows associated with FIRS 2. The axis of these outflows form an angle of almost 90∘ giving a quadrupolar morphology to the spatial distribution of the high velocity gas of the region. In Fig. 7 we show the maps of the high velocity 12CO 21 emission reported by Fuente et al. (2001). Interferometric observations shows that the NE-SW outflow, hereafter FIRS 2-out 1, is the one associated with the millimeter source FIRS 2-MM1. An intense blue lobe is detected in the CO 21 emission in this outflow while the red lobe is only marginally detected. The NW-SE outflow, hereafter FIRS 2-out 2, seems to be associated with an infrared star FIRS 2-IR (Fuente et al. 2001). In FIRS 2-out 2, the red lobe is more prominent than the blue one, giving a peculiar appearance to the high velocity gas around FIRS 2. The peaks of the 12CO emission in this lobe present a Z”-like shape which suggests that the axis of the outflow FIRS 2-out 2 is precessing. Precession has been found in bipolar outflows associated to young low-mass stars (Gueth et al. 1996).
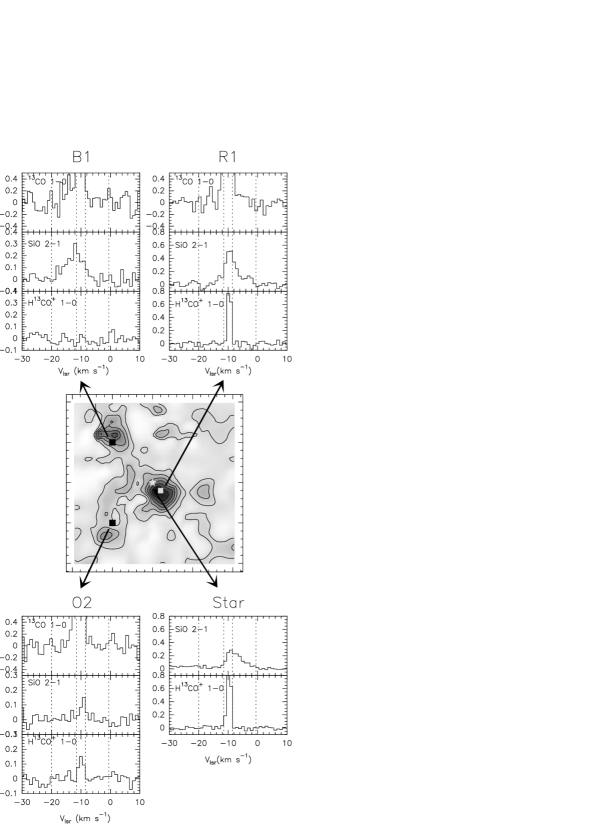
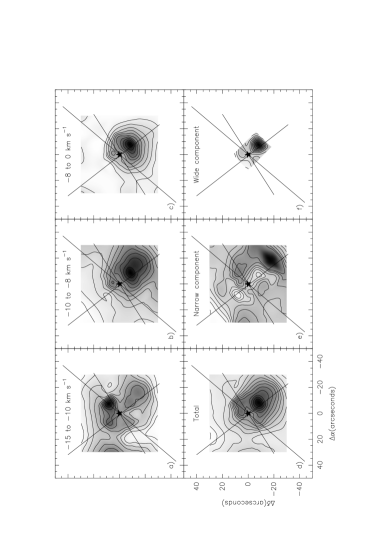
In Fig. 8 we present the integrated intensity map of the SiO 21 line towards FIRS 2. The SiO emission is only observed along the axis of the two outflows. Furthermore the SiO peaks are not located at the star position but in the bow shocks located at the end of the outflow lobes. Thus, the SiO emission seems to be closely related to the bipolar outflows. The spectra of the SiO lines towards some selected positions are shown in Fig. 8. The SiO 21 line towards the star position presents two velocity components, a narrow component with 1.6 km s-1 which is centered at the velocity of the ambient cloud, km s-1, and a wide component, 7.0 km s-1 which is centered at km s-1. The component at kms-1 corresponds to a well defined high velocity clump which peaks at the position (-10′′,-10′′) (see Fig. 8). Hereafter we will refer to this clump as R1. There exists a counterpart blue clump at a velocity, Vlsr km s-1 which peaks at the position (50′′,50′′) (hereafter B1). At this position, the profile of the SiO 21 line only presents a wide component with 7 km s-1. The high velocity clumps R1 and B1 have well defined velocities and positions like the bullets” found in low-mass stars (see Bachiller 1996). The jet-like morphology of the SiO emission along the outflow axis as well as the existence of bullets argues in favor of the youth of this outflow.
The component at the velocity of the ambient cloud, km s-1, is also present in FIRS 2-out 2. The emission of this narrow component in FIRS 2-out 2 is surrounding the red lobe as detected in 12CO. In fact, the narrow component is located adjacent to the peaks of the high velocity CO emission suggesting that SiO emission is tracing the molecular cloud gas entrained in the outflow. Narrow SiO components widespread in the molecular cloud in which the bipolar outflow is embedded has been detected in other Class 0 protostars (Codella et al. 1999). We propose an interpretation in which the morphology of the SiO emission is related to the evolutionary stage of the outflow. In FIRS 2-out 1, the SiO emission has a jet-like morphology and is concentrated in bullets” ejected by the exciting star. This jet-like” morphology is also observed in the interferometric 12CO image reported by (Fuente et al. 2001). The SiO emission in FIRS 2-out 2 is surrounding the red CO lobe. We propose that in this case the SiO emission traces the material adjacent to the cavity walls excavated by the outflow which is being entrained into the outflow. The different profiles of the SiO emission in FIRS 2-out 1 and FIRS 2-out 2 are clearly seen in Fig. 8.
We have calculated the SiO 32/21 line intensity ratio, , at the (0′′,0′′) position by degrading the angular resolution of the SiO 32 map to that of the SiO 21 one. A value of 0.8 is found in the three channels centered at the ambient velocity, while a value 1.0 is found for the high velocity gas. This reveals a higher excitation temperature for the high velocity gas. In order to determine the physical conditions for both components, we have used an LVG code. Since suggests different physical conditions for the different velocity ranges, we have carried out LVG calculations for the ambient, moderate velocity and high velocity gas components (see Table 6). Taking into account the kinetic temperature derived from the NH3 lines we have assumed =15 K for the ambient narrow component and Tk=50 K for the high velocity components. The derived densities and column densities are shown in Table 6. We are aware that the NH3 and SiO emissions could arise in different regions and the assumed kinetic temperatures are very uncertain. But since the SiO lines are optically thin, the derived column densities are weakly dependent on the assumed kinetic temperature and are accurate within a factor of 2. The values of Table 6 clearly show that the SiO abundance is larger by almost 2 orders of magnitude in the high velocity gas of FIRS 2-out 1 than in the narrow component associated with FIRS 2-out 2. Within FIRS 2-out 1, we also detect a gradient in the SiO abundance, being the SiO/13CO ratio 2 orders of magnitude larger in the high velocity component than in the ambient component. This enhancement of the SiO abundance in the high velocity gas is also observed in very young low-mass protostellar outflows (Bachiller et al. 1991, 2001) and interpreted as due to the chemical gas processing by the energetic shocks associated with the high velocity bullets”.
Hydrogen densities are also quite independent on the assumed temperature for Tk50 K. The estimated hydrogen density decreases by only a factor of 4 if we change the kinetic temperature from 15 K to 100 K. Thus, the estimated hydrogen densities are accurate within a factor of 4. Our calculations show that the density seems to increase from a few 105 cm-3 in the ambient component to 106 cm-3 in the high velocity gas at the star position. We have also carried out LVG calculations for R1 and B1, and at the offset (50′′,-50′′) where only the narrow component has been detected. The density in the bullets R1 and B1 is 105 cm-3 while the density in the narrow component detected at the offset (50′′,-50′′) is of a few 104 cm-3. This density is an upper limit to the hydrogen density in the narrow component, since the kinetic temperature is never expected to be lower than 15 K. Thus, we consider that the estimated difference in the hydrogen density of the wide and narrow components is reliable. The lower density of the narrow component also supports our interpretation of the SiO emission arising in the gas of the molecular cloud surrounding the outflow.
We have observed a map of 80′′80′′ around LkH 234 in the SiO 21 and 32 lines. We have detected SiO emission only towards the star position. Since we have integrated double time towards the star position than in the other map positions, we cannot exclude the possibility of SiO emission at the same level in other positions. Thus we have poor information about the spatial distribution of the emission. Regarding the kinematical information, the large linewidth of the SiO lines, 3 km s-1, compared to that of the (1,1) and (2,2) ammonia lines suggests that the emission arises in the warm component. The weakness of the SiO 21 line emission as well as the lack of information about the source size make any estimate of the hydrogen density very uncertain. We have derived the SiO column density assuming n 5 105 cm-3. With this assumption we derive a SiO column density of 1011 cm-2. This value is lower by a factor of 6 than the total SiO column density towards FIRS 2. The SiO/13CO ratio towards this star is similar to that found in PDRs (Schilke et al. 2001).
In Table 7 we present a summary of the SiO observations. There is a clear evolutionary trend in the SiO behavior. The youngest outflow FIRS 2-out 1 presents intense SiO emission at high velocity with SiO abundances as high as 10-8. Towards the more evolved outflow FIRS 2-out 2 we have detected only a weak SiO line at ambient velocity. The SiO abundance in this component is 10-10, i.e., two orders of magnitude lower than the SiO abundance in the high velocity gas associated with FIRS 2-out 1 but still larger than the SiO abundance in PDRs and dark clouds. Towards LkH 234 we have detected SiO emission at the ambient velocities with a fractional abundance of 10-12. This abundance is similar to that measured in PDRs and could be associated with the PDR produced by LkH 234.
This evolutionary trend confirms that SiO is a good tracer of energetic shocks. The SiO abundance is highly enhanced when the shocks are strong enough to release the silicon from the grains to the gas phase (Martín-Pintado et al. 1992). In a MHD shock model the release of Si to the gas phase requires Vshock 40 km s-1 (Flower, Pineau des Forets, Field, & May 1996). This is consistent with the trend of having larger SiO abundances in the higher velocity gas. Because of projection effects, the velocity we measure is a lower limit to Vshock. As the protostar evolves, the ouflow fades and the amount of high velocity molecular gas decreases. This produces a decrease in the SiO abundance. When the bipolar molecular outflow stops, the SiO abundance around the star decreases to the typical value in PDRs.
| Source | Vel. range | Tk(K) | n | N(13CO) | N(SiO) | N(H13CO+) | ||
|---|---|---|---|---|---|---|---|---|
| (km s-1) | (K) | (cm-3) | (cm-2) | (cm-2) | (cm-2) | SiO/13CO | SiO/H13CO+ | |
| FIRS 2 (Star) | -13.5 – -11.5 | 50 | 5 105 | 1.5 1011 | 1.0 1011 | 1.5 | ||
| -11.5 – -8.5 | 15 | 5 105 | 1.1 1012 | 1.5 1012 | 0.7 | |||
| -8.5 – -4.5 | 50 | 4 105 | 1.2 1012 | |||||
| -4.5 – -0.5 | 50 | 1 106 | 4.7 1011 | |||||
| Total | 2.8 1012 | 1.5 1012 | 1.9 | |||||
| (-10′′,-10′′) R1 | -13.5 – -11.5 | 50 | 5 105∗ | 3 1015 | 4 1011 | 0.0001 | ||
| (FIRS 2-out 1) | -11.5 – -8.5 | 15 | 4 105 | 4 1016 | 3 1012 | 1 1012 | 0.00007 | 3 |
| -8.5 – -4.5 | 50 | 4 105 | 3 1015 | 1.5 1012 | 0.0005 | |||
| -4.5 – -0.5 | 50 | 3 104 | 3 1014 | 1.5 1012 | 0.005 | |||
| Total | 4.6 1016 | 6.4 1012 | 1 1012 | 0.0001 | 6 | |||
| (50′′,50′′) B1 | -17.5 – -12.5 | 50 | 2 105 | 1.5 1015 | 1.5 1012 | 0.001 | ||
| (FIRS 2-out 1) | -12.5 – -8.5 | 50 | 2 105 | 5.5 1016 | 1.5 1012 | 0.00003 | ||
| -8.5 – -4.5 | 50 | 2 105 | 2.0 1015 | 2.0 1011 | 0.0001 | |||
| Total | 5.8 1016 | 3.2 1012 | 2 1012 | 0.00005 | 1 | |||
| (50,-50) O2 | -11.5 – -8.5 | 15 | 8 104 | 1.0 1011 | 3 1011 | 3 | ||
| (FIRS 2-out 2) | ||||||||
| LkH 234 | -12.5 – -8.5 | 50 | 5 105∗ | 1.3 1017 | 2.0 1011 | 1.0 1012 | 0.000001 | 0.2 |
| (IRS 6-out 1) | ||||||||
∗ Assumed value for the hydrogen density
| Outflow | Age (Myr) | Component | X(SiO)3 |
|---|---|---|---|
| FIRS 2-out 1 | 0.0031 | High velocity | 10-8 |
| FIRS 2-out 2 | 0.0051 | Ambient | 10-10 |
| LkH 234 | 0.12 | Ambient | 10-12–10-11 |
1 Estimated age of the outflow assuming a velocity of 15 km s-1 and the lobe sizes measured from
Fig. 1.
2 Stellar age from Fuente et al. (1998)
3 Fractional abundance estimates assuming X(13CO) = 2 10-6 and X(H13CO+)=10-10

5.4 CS, C34S
We have carried out a map of the CS 32 emission towards FIRS 2 and LkH 234. In addition we have observed the C34S 21, 32 and 54 lines towards the (0,0) position. The spectra towards the (0,0) position are shown in Fig. 9 and the Gaussian fits are shown in Tables 2 and 3. The integrated intensity maps of the CS J=32 line are shown in Fig. 4.
Similarly to the case of SiO, the profiles of the CS and C34S lines towards FIRS 2 present high velocity wings at red-shifted velocities. However, the terminal velocity of these wings is lower than those of the SiO lines. The velocity range of the CS emission is between -14 and -5 km s-1, i.e. , it is only detected at the ambient velocities and in the moderate velocity component of the SiO emission. The spatial distribution of this component in the CS 32 line is different from that of the same component of the SiO emission, suggesting that both molecules might be tracing different gas components even when comparing the same velocity range.
We have carried out LVG calculations to estimate the physical conditions of the gas emitting in CS. Different line ratios are found at the ambient velocities and in the moderate velocity range in the C34S lines (see Fig. 9). Thus, we have estimated the physical conditions in the two velocity intervals. We have derived a density 3 106 cm-3 for the ambient component in FIRS 2. This density is larger by a factor 6 than the density estimated from SiO lines. This difference is not due to the assumed kinetic temperature, since even assuming a kinetic temperature of 100 K the density would decrease only by a factor of 4. However, the densities derived from the C34S lines in the moderate range are similar to those derived from the SiO lines. We propose that at least part of the C34S lines emission at ambient velocities does not arise in the outflow. We speculate with the possibility of the C34S emission arising in a hot core.
The CS and C34S lines observed in LkH 234 are shown in Fig. 9 The line-widths of the C34S lines are similar to that of the SiO and the NH3 (3,3) lines suggesting that they are tracing a warm component. The emission of the CS lines is concentrated towards the star position, therefore the connection between the outflow and the CS emission is not clear. We have derived a density 105 cm-3 for this warm component. This density is lower than the typical density of the hot cores associated with massive stars. Since LkH 234 is a visible star, the envelope has already been disrupted by the star and the UV radiation is escaping through the envelope. A dense (n 106 cm-3) hot region similar to the hot cores in massive stars is not expected at this evolutionary stage.
| Source | Vel. range | Tk(K) | n (cm-3) | Ns(C34S)(cm-2) | |
|---|---|---|---|---|---|
| NGC 7129 – FIRS 2 | -10.5 – -9.5 km s-1 | 15 | 3 106 | 8.0 1011 | 9′′ |
| -9.5 – -6.5 km s-1 | 50 | 6 105 | 7.1 1011 | 4′′ | |
| Total | 1.5 1012 | ||||
| LkH 234 | -11.5 – -9.5 km s-1 | 50 | 2 105 | 9.6 1011 | 14′′ |
| -9.5 – -5.5 km s-1 | 50 | 4 105 | 7.8 1011 | 6′′ | |
| Total | 1.7 1012 |
5.5 CH3OH
We have observed up to 17 methanol lines towards the (0,0) position in FIRS 2 and LkH 234. The large number of lines allows us to have a good estimate of the rotation temperature and the CH3OH column density. In addition, we have obtained a small map in the intense CH3OH 21 and 54 lines towards FIRS 2. The CH3OH maps around FIRS 2 are shown in Fig. 4. The CH3OH emission peaks towards the bullet R1 suggesting that these lines arise mainly in the molecular outflow.
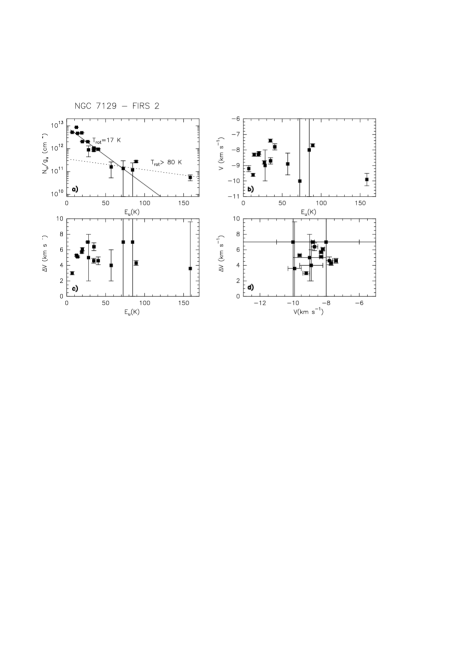
The high-velocity resolution spectra of the CH3OH lines are shown in Fig. 10. The velocity profiles of the CH3OH lines towards FIRS 2 are similar to those found in the SiO lines. The low energy lines present two velocity components, a narrow component at the ambient velocity and a wide wing which extends to red-shifted velocities and is centered at -61 km s-1 . In higher energy transitions, the narrow component becomes weaker and only the wide red-shifted one is detected. This is consistent with the integrated intensity maps of the CH3OH 21 and 54 lines shown in Fig. 4 which show a strong peak emission at the position of the bullet R1. In order to further investigate the nature of the CH3OH emission, we have fit the lines with Gaussian profiles and make some correlations. In Fig. 11 we plot the central velocity and linewidths of the CH3OH lines vs. the upper state energy of the observed transition. It is clearly seen that the linewidths of the CH3OH lines increase with the upper state energy of the transition at moderate energies. In fact, they increase from 3 km s-1 in the low energy transitions to 7 km s-1 in transitions with Eu50 K. But this trend is not valid for higher energy lines which seem to have a constant linewidth of 4 km s-1. A similar behavior is found when one compares the velocity of the line with the upper state energy. The line velocity changes from v10 km s-1 to 7.5 km s-1 when the energy increases from 10 K to 50 K. However, for higher energies, the line velocities seem to make the reverse way and change from 8 km s-1 to 10 km s-1. This suggests that the emission of the low and moderate energy transitions ( Eu50 K) arise in the molecular outflow. The correlation found between the linewidth and the energy of the transition suggests that the high velocity gas is associated with higher excitation temperatures. This result is consistent with the density estimated from the SiO lines. For Eu 50 K, there is a jump in the line velocity which go back to -10 km s-1 . We propose that this could be due to the existence of a hot component in the CH3OH emission in addition to that related to the bipolar outflow.
In Fig. 11 we show the CH3OH rotational diagram for FIRS 2. All the observed CH3OH transitions cannot be fitted with a single straight line. We need to assume at least two rotation temperatures to fit the observational data. The low energy transitions (Eu50 K) are well fit with a Trot17 K, while the high energy transitions require a higher rotation temperature, Trot80 K. We propose the existence of a hot core” component which dominates the emission in the high energy transitions.
Several CH3OH lines have also been observed in LkH 234. In this case all the lines are centered at the ambient velocity. However, there are important variations in the linewidths of the observed lines. Like in the case of FIRS 2, the linewidths seem to increase with the energy of the upper level for Eu50 K (see Fig. 12). We have only detected the methanol lines towards the (0,0) position and consequently, we have no information about the size of the emitting region. Thus, we have considered the two limiting cases of a point source and a beam filling factor of 1 to make the rotational diagram. In the first case, we need two gas components to fit all the observed transitions. The cold one would have Trot24 K, and the hot one, Trot250 K. But if we assume a beam filling factor of 1, all the oberved transitions are well fit with a Trot60 K. With our data, we cannot discern between these two cases.


5.6 H2CO
We have observed two H2CO rotational transitions and one of the rarer isotope H213CO+ toward FIRS 2 and LkH 234. The obtained spectra are shown in Fig. 10. Similarly to other molecules, the H2CO spectra towards FIRS 2 present two well differentiated components, a narrow one centered at 9.6 km s-1 with a linewidth of 1.3 kms s-1 and a much wider one centered at 9.0 km s-1. However, the wide component has not the typical R1 profile observed in the SiO, CS and methanol lines at the star position. While the profiles of the SiO,CS and methanol lines present only red wings, the H2CO lines present a quite symmetric profile with blue and red wings. Consequently, the central velocity of the wide H2CO component is similar to that of the ambient gas and the linewidth is as large as v=7 km s-1. To further investigate the nature of these components we have studied the integrated intensity maps of the H2CO 212111 line for the different velocity intervals (see Fig. 13). The most striking feature could be the jet-like morphology observed in the H2CO emission at blue velocities (from -15 to -10 km s-1). At red velocities, the emission is maximum at the offset (-7′′,-7′′) which is located close to the bullet R1. Since the wide component have a very well differentiated profile, we have been able to subtract the wide component to the observed spectra and mapped both components separately. Our results are quite suggestive. The wide component presents a jet-like morphology with the maximum towards the position R1. The morphology of the narrow component is an intense ridge which surrounds the jet. This strongly suggests that the narrow component is tracing the shocked gas of the molecular cloud which is interacting with the jet. The maximum of this narrow component coincides with the position where the bullet R1 impinges in the cloud. We have derived rotation temperatures and column densities in the narrow and wide components separately, and obtained similar excitation conditions in both components. Thus, although the kinematics is clearly different, the physical condition of both components are quite similar.
In Fig. 10 we show the H2CO spectra towards LkH 234. The profiles of the H2CO lines in this source, also suggest the existence of a narrow and wide components. However, these two component cannot be easily separated. For this reason, we have derived rotation temperatures by considering the sum of the two components. We obtain a rotation temperature and H2CO column density similar to those obtained in FIRS 2. In Fig. 5 we show the integrated line intensity maps in this source. Similarly to the case of FIRS 2 we find emission along the outflow and in a direction perpendicular to it. Thus far, no bipolar outflow has been detected in this direction. Thus, this H2CO emission is associated with the flattened clump in which the Herbig Be star LkH 234 is embebded that is being heated by the recently born star.
5.7 CH3CN
We have observed the CH3CN 54 and 1312 lines towards FIRS 2 and LkH 234. Because of the rotational structure of CH3CN, one can observe several lines at different energies very close in frequency. This allows us to estimate the rotation temperature avoiding observational errors and the uncertainty due to the unknown source size. We have carried out these calculations towards our two sources. Unlike the other molecules observed, we do not detect a cold component in the CH3CN lines, but only the warm one. The detection of a hot CH3CN component with Tk 63 K in FIRS 2 shows the existence of a hot core in this object.
CH3CN seems to be the best tracer of hot cores in these intermediate-mass stars. Contrary to CH 3OH and H2CO whose low energy lines arise mainly in the bipolar outflow, the rotational lines of CH3CN seems to arise in the hot core and provide a good measure of the kinetic temperature of this hot component.

5.8 CN,HCN
We have mapped a small region around FIRS 2 and LkH 234 in the HCN 10 and CN 10 and 21 lines. The integrated intensity maps around FIRS 2 are shown in Fig. 4 and 5. Thus far, we have two different kind of molecules depending on the morphology of their emission in FIRS 2. The first group is formed by the molecular ions N2H+ and H13CO+ which peak at the YSO position and trace the bulk of the cold envelope. The second group is formed by CS, SiO, CH3OH and H2CO peaks at the position R1 and its emission has an important contribution from the molecular outflow FIRS 2-out 1. The morphology of the CN 10 emission is different from those of these two groups. The CN emission does not peak at the star position nor at the position of the bullet R1, but to the north, suggesting a new chemical differentiation in the protostellar envelope. The morphology of the HCN emission is also different from those of the other molecular lines. In fact, the HCN emission peaks to the NW from the star position, in a position intermediate between the bullet R1 and the peak of the CN emission. The large linewidths of the HCN 10 line (see Fig. 15) show that, in contrast to the CN 10 line, the emission of the HCN 10 line has a significant contribution from the molecular outflow giving rise to this peculiar morphology.
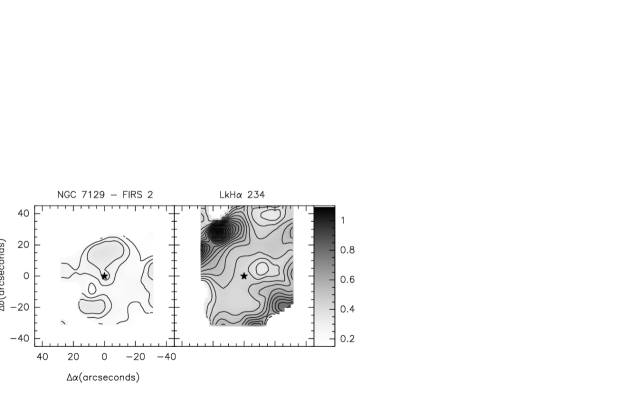
The radicals CN and HCN are known to be specially abundant in PDRs. In particular, the CN/HCN ratio has been successfully used as a PDR tracer in different kind of objects. In Fig. 16,we show the maps of the (CN 10)/(HCN 10) intensity ratio in FIRS 2 and LkH 234. The (CN 10)/(HCN 10) line intensity ratio is maximum at the star position and to the north, forming a conical feature with the star at its apex. We have been estimated the CN rotation temperature from the (CN 21)/(CN 10) line intensity ratio (see Table 4). Assuming the LTE approximation and the same rotation temperature for CN and HCN, we obtain a CN/HCN abundance ratio of 3 at the star position. This value is similar to those found in PDRs and suggests that the gas chemistry in this conical feature is being affected by the UV radiation from the protostar. However, the axis of this conical feature seems to be more similar to that of the outflow FIRS 2-out 2 than to that of the outflow FIRS 2-out 1. This suggests that the PDR traced by the high CN/HCN ratio could be related to the star driving the outflow FIRS 2-out 2 instead of to the Class 0 object. In fact, the PDR could be formed in the walls of the cavity excavated by the outflow FIRS 2-out 2 when they are illuminated by the exciting star. But observations with higher spatial resolution are required to conclude about this point.
We have also observed the CN and HCN lines towards LkH 234. In this case, the linewidths of the CN and HCN lines are similar, and in agreement with those found in the warm component. But, contrary to most of the observed molecular species, the CN and HCN emission do not peak at the star position but to the north forming a conical feature. We have calculated the CN/HCN integrated intensity ratio in the region. Surprisingly, the CN/HCN ratio is minimum at the star position and maximum at the border of the clump as traced by the 1.3mm observations suggesting that the clump is illuminated from outside. Making column densities estimates, we derive N(CN)/N(HCN)3 at the star position.
Thus, the CN/HCN fractional abundance ratio at the star position is equal (within the uncertainties) in FIRS 2 and LkH 234 and consistent with the expected value in a PDR. However the behavior of the CN/HCN ratio is very different in the rest of the envelope. In the case of FIRS 2, the CN/HCN ratio decreases outwards from the star as expected from a PDR illuminated from the interior and with an optically thick envelope. In the case of LkH 234, the CN/HCN ratio is quite constant inside the clump and increases at the edges. This suggests that the clumps is also illuminated from outside (the clump is located at the border of an HII region). Since the envelope is less massive than that associated with FIRS 2, the whole envelope can be considered as a PDR.

6 Deuterated compounds
In order to derive the deuterium fractionation we have observed the DCO+ 21 and 32, N2D+ 32 , and D2CO 404303 lines toward the studied regions. In Fig. 15 we show the spectra of these lines toward FIRS 2 and LkH 234. The integrated line intensity maps of the DCO+ 21 line toward FIRS 2 are shown in Fig. 4.
The linewidths of the DCO+ and N2D+ lines are 1.0 km s-1 suggesting that they arise in the cold component of the envelope like the non-deuterared compounds HCO+ and N2H+. The linewidth of the D2CO line is 4 km s-1 like those of the lines arising in the warm component, and in particular, the lines of the chemically related species H2CO and H213CO. In Table 9 we show the DCO+/H13CO+, N2D+/NH2+ and D2CO/H2CO abundance ratios in both sources. The DCO+/H13CO+ abundance ratio is a factor of 20 lower in LkH 234 than in FIRS 2. This factor is so large that cannot be due to the H13CO+ depletion but to a different value of the deuterium fractionation in these cold envelopes. Thus, we propose that the deuterium fractionation in the cold envelope decrease during the protostellar evolution. As we will comment in detail in next section, this increase in the deuterium fractionation can be understood as the consequence of the envelope warming during the protostellar evolution.
A very different case is the D2CO/H2CO abundance ratio which increases by a factor 1.5 from FIRS 2 to LkH 234. Since a factor of 1.5 is within the uncertainities of our column density estimates, we conclude that the deuterium fractionation, as measured by the D2CO/H2CO abundance ration, seems to be constant (or slightly increase) in the warm component during the protostellar evolution. Thus, the evolution of the deuterium fractionation in the warm envelope seems to follow a different trend than in the cold envelope. The evaporation of the icy grain mantles is very likely the main responsible of this behavior.

7 Discussion
7.1 Physical structure of the YSOs envelopes and its evolution
Our data show the existence of at least two well differentiated components in the envelope of FIRS 2 and LkH 234, the cold envelope traced by the low energy lines of NH3, N2H+ and H13CO+, and the warm envelope traced by the CS, CH3OH and H2CO lines. These two components can be differentiated observationally by their kinematics, the morphology of their emission and by their physical conditions. Thus the lines arising in the cold component are narrow (v1 km s-1) and the emission peak is located at the star position in FIRS 2. Besides, the kinetic temperature of this gas estimated from the NH3 lines is 13 K in FIRS 2 and 28 K in LkH 234.
A warm envelope component is detected towards these sources traced by the emission of species like CS, CH3OH and H2CO. These species present enhanced abundances in regions where the icy grain mantles are evaporated (van der Tak et al. 2000). They are also abundant in molecular ouflows where they can be released to the gas phase by shock fronts. In FIRS 2, the emission of the low energy transitions of these species arise mainly in the bipolar outflow. However, this association is not clear in LkH 234 where their emisison could arise in the inner and warmer part of the envelope.
Finally, we have strong evidences for the existence of a hot core in the Class 0 protostar FIRS 2. The high density measured at ambient velocities from the C34S lines, the high temperature component of the CH3OH lines and, above all, the detection of the CH3CN lines with rotation temperature of 63 K show the existence of a hot core in this target.
7.2 Physical and Chemical evolution of the YSOs envelopes
7.2.1 Cold envelope
In Table 9, we show the physical paramenters and molecular column densities in the Class 0 protostar FIRS 2 and LkH 234. The molecules NH3, N2H+, H13CO+ and their deuterated compounds DCO+ and N2D+ trace the cold envelope component. The column densities of these species decrease by a factor of 5–10 from the Class 0 protostar to the Type I Herbig Be star showing that the mass of the cold envelope decrease by at least a factor of 5 during the protostellar phase. Based on the NH3 and N2H+ data we have also derived the kinetic temperature and size of this cold component. The kinetic temperature increases from 13 to 28 K and the size of the emitting region decreases from 21′′ to 6′′ from FIRS 2 and LkH 234. This is consistent with previous results by Fuente et al. (2002) which shows the protostellar envelope is dispersed and becomes warmer during its evolution to become a visible star.
The warming of the cold envelope produces changes in its chemical composition. In Table 5 we show the N2H+/H13CO+ and NH3/N2H+ abundance ratios in several positions. Note that the N2H+/H13CO+ ratio is different in the studied objects. The N2H+/H13CO+ ratio is 17 in the cold young object FIRS 2 and 6 in the more evolved and warmer Herbig Be star LkH 234. As discussed in Section 3.2, this gradient in the N2H+/H13CO+ ratio is very likely due to the H13CO+ depletion in the cold envelope of the protostar. Molecular depletion is expected to be significant only for kinetic temperatures Tk20 K. Thus, molecular depletion is negligible in the envelope of LkH 234 where the gas kinetic temperature is 28 K.
Within the nitrogen chemistry, we have also studied the NH3/N2H+ ratio. Since the beam is very different for the NH3 and N2H+ observations, this abundance ratio is very dependent on the assumed source size. For LkH 234 we have been able to calculate both, the NH3 and N2H+ emitting regions sizes. We have derived the same size, 6′′–8′′, for both molecules and the NH3/N2H+ ratio is 10. In the case of FIRS 2 we have not been able to derive the source size from the NH3 emission but we have estimated a size of 21′′ from the N2H+ observations. We have assumed two limiting cases for the calculations of the NH3/N2H+ ratio in this source. Assuming a beam filling factor of 1 for both molecules we obtain NH3/N2H+13 in this object. However if we assume that the size of the NH3 emission is 21′′, like in the case of N2H+, we obtain NH3/N2H+33. In this case, we would have an NH3 abundance enhancement in the colder envelope of the Class 0 protostar. Recent results in pre-stellar core show that the NH3 abundance could be enhanced in dense regions of these cores where the CO is expected to be depleted (Tafalla et al. 2004).
7.2.2 Warm envelope
When the star heats the envelope a sublimation front proceeds outwards the star removing molecules from grain mantles. The region of the envelope in which the gas kinetic temperature is high enough to evaporate the grain mantles is what we have called warm envelope”. The species released to gas phase are called parent molecules” and increase significantly their abundances. The molecules CH3OH, NH3, and H2CO are within this group. These molecules drive a high temperature chemistry giving rise to daughter” molecules like CH3CN. Within this scheme, CH3OH, H2CO and CH3CN are tracers of the warm part of the envelope where the ices have been evaporated (Rodgers & Charnley 2003). Some of these species are also abundant in the molecular outflow where shock fronts remove them from the grains mantles, and to a lesser extent in the cold envelope. This is the case for NH3 with the emission of the low-lying transitions dominated by the cold envelope in both, FIRS 2 and LkH 234, while the (3,3) line arise in the warmer component.
In Table 9 we show the physical conditions and the molecular column densities in the warm envelope of FIRS 2 and LkH 234. Contrary to the species tracing the cold envelope, the species tracing the warm envelope present similar column densities in both targets (see Fig. 17). In fact, some species like H2CO and C34S seem to have larger column densities in LkH 234. On the other hand, the size of the warm envelope is larger in the case of the Herbig Be star than in the case of the Class 0 YSO. Thus, the mass and size of the warm envelope remains quite constant, or even increase, during the protostellar evolution.
Although the column densities of the warm envelope” species are not very different in the two YSOs, the origin of their emission could be different. The CH3OH and H2CO emission seem to be dominated by the molecular in FIRS 2. In the case of CH3OH we have detected two components in FIRS 2. The one centered at 7 km s-1 is clearly associated with the molecular outflow FIRS 2-out 1 and dominates the CH3OH emission in all the transitions with Eu100 K. We have observed only two low-energy H2CO lines in our targets. The emission of these lines in FIRS 2 is clearly associated with the outflow FIRS 2-out 1 (see Fig. 13).
Intense CH3OH and H2CO lines have also been detected in LkH 234. In this case the link between these species and the molecular outflow is not clear. In fact, these lines could arise from a warm inner envelope where the icy mantles are being evaporated releasing these species to the gas phase. Thus, although the CH3OH and H2CO column densities are very similar in both objects, the mechanism which removes these species from the icy mantles can be different in the Class 0 protostar FIRS 2 and the Herbig Be star LkH 234. While shock fronts are very likely the main mechanism for the erosion of grain mantles in FIRS 2, ice evaporation could be a dominant mechanism in LkH 234.
7.2.3 CN,HCN
The CN and HCN column densities increases from FIRS 2 to LkH 234 by a factor of 6. This is easily understood within an evolutionary trend. Since the cold envelope has already been dispersed in LkH 234, the UV radiation can penetrate deeper into the cloud affecting the chemistry all across the envelope in LkH 234. The enhancement of ionization fraction (in particular, the enhancement in the C+ abundance) in the LkH 234 envelope could produce an enhancement in the fractional abundances of the nitrogenated chains CN and HCN relative to N2H+ and NH3.
The CN/HCN ratio has been widely used as a PDR tracer thus far. Values of the CN/HCN ratio 1 has been considered as a prove of the existence of a photon-dominated chemistry region (see e.g. Fuente et al. 1993, 1995, 2003; Bachiller et al. 1997; Rodríguez-Franco et al. 1998). We have detected a small region in the vicinity of the Class 0 source in FIRS 2 in which the CN/HCN ratio is 1. This strongly suggests the existence of an incipient PDR in the inner part of this protostellar envelope. However, our limited angular resolution prevent us to discern if this PDR is associated with the Class 0 source or with the IR companion star which is driving the outflow FIRS 2-out 2.
7.2.4 Deuterated compounds
We have observed DCO+ and N2D+ in order to be able to derive the D/H ratio in the cold envelope of these stars and its possible changes during the central object evolution. Enhancements of the D/H ratio over the 10-5 ratio of [HD]/[H2] have been found in dark clouds and young protostars (e.g. Butner et al. 1995; Williams et al. 1998). There are two main ways of producing these enhancements. Firstly, grain surface chemistry may enhance molecular D/H ratios (Tielens 1983; Brown & Millar 1989a, b; Charnley et al. 1997). Secondly, some key gas phase reactions involving destruction of deuterated species run slower at low temperatures than the equivalent reactions with hydrogen, and this leads to molecular D/H enhancements where a cold gas phase chemistry has been active (Roberts & Millar 2000a, b). Furthermore, in colder gas, depletion of heavy molecules such as CO results in an increase of [H2D+]/[H] and molecular D/H ratios (Dalgarno & Lepp 1984; Brown & Millar 1989a; Roberts & Millar 2000a, b). We have found DCO+/H13CO+0.7 in FIRS 2 and 0.25 in LkH 234. Assuming a 12C/13C isotopic ratio of 89, this would imply DCO+/HCO+0.008 in FIRS 2 and 0.003 in LkH 234. These ratios are similar to that found in low mass Class 0 protostar IRAS+16293–2422 by van Dishoeck et al. (1995) but are lower that the values found in dark clouds (see e.g. Tiné et al. 2000). A cold gas chemistry as well as depletion of heavy molecules can explain the enhanced values DCO+ /HCO+ ratio found in the young stellar object FIRS 2.
We have also observed the doubly deuterated formaldehyde D2CO. The linewidths of the observed D2CO lines show that this species, like the non-deuterated compound H2CO, arise in the warm envelope. The D2CO column densities as well as the D2CO/H2CO ratio, are similar in LkH 234 than in FIRS 2. This suggests that the deuterium fractionation remains constant (or even increase, see Table 9) in the warm envelope during the protostellar evolution. Thus, the evolution of the deuterium fractionation is different in the cold and warm part of the envelope. Grain-surface chemistry may enhanced the deuterium fractionation in the warm envelope where molecular evaporation is very likely the main chemical phenomenum, while the cold gas chemistry and depletion could determine the evolution of the deuterium fractionation in the cold envelope.
The deuterium fractionation has been proposed as a chemical clock in YSOs. Our data confirms that the deuterium fractionation changes significantly during the protostellar evolution and consequently, can be used as a chemical clock. However, these changes are different in the cold and in the warm part of the envelope, and the measured D/H ratio is very dependent on the molecular compounds used to determine it.
| NGC 7129 – FIRS 2 | LkH 234 | |
| Age | 3000 yr | 105 yr |
| n(cm-3) | 5 105 – 3 106 | 2 105 |
| Cold envelope | ||
| Tk | 13 K | 28 K |
| 21 ′′ | 8′′ | |
| NH3 | 4.9 1014 | 4.0 1013 |
| N2H+ | 3.8 1013 | 1.0 1013 |
| H13CO+ | 2.2 1012 | 1.7 1012 |
| DCO+ | 1.8 1012 | 4.2 1011 |
| N2D+ | 5.4 1011 | 2.3 1011 |
| N2H+/H13CO+ | 17 | 6 |
| NH3/N2H+ | 13 -33b | 10 |
| DCO+/H13CO+ | 0.7 | 0.2 |
| N2D+/N2H+ | 0.014 | 0.02 |
| Warm envelope | ||
| Tk | 50 K | 100 K |
| 9′′ | 14′′ | |
| C34S | 1.5 1012 | 1.7 1012 |
| CH3OH | 9.8 1014 | 5.4 1014 |
| CH3CN | 3.6 1012 | 2.0 1012 |
| H2CO | 7.0 1013 | 8.0 1013 |
| H213CO | 2.3 1012 | 2.4 1012 |
| D2CO | 2.0 1012 | 3.7 1012 |
| D2CO/H2CO | 0.03 | 0.05 |
| PDR | ||
| CN | 4.8 1013 | 6.1 1013 |
| HCN | 1.6 1013 | 2.1 1013 |
| Outflow | ||
| SiO | 2.8 1012 | 2.0 1011 |
b Assuming beam filling factor 1 and a source size of 21′′ for the NH3 emitting region.
| NGC 7129 – FIRS 2 | LkH 234 | |
|---|---|---|
| SiO/C34S | 2 | 0.1 |
| CN/N2H+ | 1 | 6 |
| HCN/N2H+ | 0.4 | 2 |
| DCO+/HCO+ | 0.008 | 0.002 |
| D2CO/DCO+ | 1 | 10 |
8 Summary and Conclusions: Chemical-clocks in intermediate-mass YSOs
We have carried out a molecular survey towards the IM YSOs FIRS 2 and LkH 234. Our survey confirms that protostellar envelopes are very complex objects composed by several components characterized by different physical and chemical properties:
-
1.
A cold envelope observationally characterized by narrow lines (v1 km s-1) and low kinetic temperatures (Tk 50 K). This component is well traced by the species NH3,N2H+, H13CO+, DCO+ and N2D+.
-
2.
A warm envelope observationally characterized by large linewidths (v3 km s-1) and kinetic temperatures (Tk50 K). The low energy transitions of CS, C34S, CH3OH, and H2CO arise in this warm component.
-
3.
A hot core characterized by high densities (n106 cm-3) and a high kinetic temperature (Tk100 k). The symmetric rotor CH3CN seems to be the best tracer of this hot component.
-
4.
In addition to these envelope components, energetic outflows are associated with very YSOs. In addition to CO and its isotopes, the SiO emission is very likely the best tracer of the outflow component for very young stellar objects.
Once, we have used chemistry to determine the physical structure of the YSOs, FIRS 2 and LkH 234, we can determine the evolution of the protostellar envelopes of IM stars during the protostellar phase. FIRS 2 is an IM Class 0 objects while LkH 234 is a very young (and still deeply embedded) HBe star. As expected, different physical conditions and chemistry are found in these objects. The Class 0 IM is a cold object (Tk 13 K) in which molecular depletion is still important. We have no evidence of a change in the N2H+ abundance between both objects. The decrease in the N2H+ column density observed in Fig. 17 is the consequence of the disruption of the cold envelope during the stellar evolution. However, we have found evidences for H13CO+ depletion in FIRS 2. Molecules like CH3OH and H2CO are expected to trace mainly the warm region in which grain mantles have been evaporated. The column densities of these molecules remain constant (or increase) from the Class 0 IM to the more evolved HBe star, suggesting that the abundances of these molecules and/or the mass of the warm gas increases with the protostellar evolution. The detection of CH3CN and the high temperature derived from it (Tk63 K) shows that a hot core has developed in the Class 0 protostar FIRS 2. Thus, our results suggest an evolutionary sequence in which as the protostar evolves to become a visible star, the total column density of gas is decreasing while the amount of warm gas remains quite constant or slightly increase. These physical and chemical changes imply important changes in the beam averaged column densities during the protostellar evolution.
Based on our observational study of FIRS 2 and LkH 234, we propose some abundance ratios that can be used as chemical clocks in YSOs. These ratios are defined to be useful tools to discern between different evolutionary stages of YSOs, but do not correspond to the actual abundance ratios in any of the envelope components. They have been calculated with beam averaged column densities and, as largely discussed in this paper, are the consequence of a complex physical and chemical evolution in the whole envelope.
In Table 10 we list the proposed chemical clocks. We find the maximum variation between the Class 0 and the HBe object when comparing the SiO/C34S ratio. This ratio decreases by a factor of 20 between these two objects. This decrease is the consequence of the decay of the bipolar outflow phenomenum during the protostellar evolution. This ratio is specially useful to determine the evolutionary stage of the youngest objects which are associated with the most energetic bipolar outflows. The nitrogen chemistry is also useful to determine the evolutionary stage of YSOs. The CN/N2H+ and HCN/N2H+ ratios are larger by a factor of 6 in the HBe star than in the Class 0 object. As commented above this is mainly due to the fact that the LkH234 envelope is thinner and warmer than that of the FIRS 2. These ratios would probably be more useful to differentiate between objects in the late protostellar evolution when the protostellar envelope becomes optically thinner. Finally, the deuterated species could also be a good indicator of the protostellar evolution. The DCO+/HCO+ ratio decreases by a factor 4 due to the warmer envelope in LkH 234. However, we can have a different behavior in the deuterated species whose emission arise in the warm envelope component. This is the case of the doubly deuterated compound D2CO. We obtain the largest contrast in the abundance ratio if we compare the D2CO and DCO+ abundances. The D2CO/DCO+ ratio increases by a factor of 10 from the Class 0 to the Herbig Be star. However, we should be cautious using this ratio because we are comparing species arising in different regions of the envelope.
Acknowledgements.
We are grateful to the MPIfR and IRAM staff in Pico de Veleta for their support during the observations. This work has been partially supported by the Spanish DGICYT under grant AYA2003-07584 and Spanish DGI/SEPCT under grant ESP2003-04957. J.R.R. acknowledges the financial support from AYA2003-06473.References
- André et al. (2000) André, P., Ward-Thompson, D., & Barsony, M. 2000, Protostars and Planets IV, 59
- Bachiller, Guilloteau, & Kahane (1987) Bachiller, R., Guilloteau, S., & Kahane, C. 1987, A&A, 173, 324
- Bachiller et al. (1991) Bachiller, R., Martin-Pintado, J., & Fuente, A. 1991, A&A, 243, L21
- Bachiller (1996) Bachiller, R. 1996, IAU Symp. 178: Molecules in Astrophysics: Probes & Processes, 178, 103
- Bachiller et al. (1997) Bachiller, R., Fuente, A., Bujarrabal, V., Colomer, F., Loup, C., Omont, A., & de Jong, T. 1997, A&A, 319, 235
- Bachiller et al. (2001) Bachiller, R., Pérez Gutiérrez, M., Kumar, M. S. N., & Tafalla, M. 2001, A&A, 372, 899
- Bottinelli et al. (2004) Bottinelli, S., Ceccarelli, C., Lefloch, B., et al., 2004, ApJL submitted
- Brown et al. (1988) Brown, P. D., Charnley, S. B., & Millar, T. J. 1988, MNRAS, 231, 409
- Brown & Millar (1989a) Brown, P. D. & Millar, T. J. 1989a, MNRAS, 240, 25P
- Brown & Millar (1989b) Brown, P. D. & Millar, T. J. 1989b, MNRAS, 237, 661
- Butner et al. (1995) Butner, H. M., Lada, E. A., & Loren, R. B. 1995, ApJ, 448, 207
- Caselli et al. (1993) Caselli, P., Hasegawa, T. I., & Herbst, E. 1993, ApJ, 408, 548
- Caselli et al. (1999) Caselli, P., Walmsley, C. M., Tafalla, M., Dore, L., & Myers, P. C. 1999, ApJ Let, 523, L165
- Caselli et al. (2002) Caselli, P., Walmsley, C. M., Zucconi, A., Tafalla, M., Dore, L., & Myers, P. C. 2002, ApJ,
- Cazaux et al. (2003) Cazaux, S., Tielens, A. G. G. M., Ceccarelli, C., Castets, A., Wakelam, V., Caux, E., Parise, B., & Teyssier, D. 2003, ApJL 593, L51
- Charnley et al. (1992) Charnley, S. B., Tielens, A. G. G. M., & Millar, T. J. 1992, ApJ Let, 399, L71
- Charnley et al. (1997) Charnley, S. B., Tielens, A. G. G. M., & Rodgers, S. D. 1997, ApJ Let, 482, L203
- Codella et al. (1999) Codella, C., Bachiller, R., & Reipurth, B. 1999, A&A, 343, 585
- Dalgarno & Lepp (1984) Dalgarno, A. & Lepp, S. 1984, ApJ Let, 287, L47
- Danby et al. (1988) Danby, G., Flower, D. R., Valiron, P., Schilke, P., & Walmsley, C. M. 1988, MNRAS235, 229
- Eiroa et al. (1998) Eiroa C., Palacios J., Casali M. M., 1998, A&A 335, 243
- Flower, Pineau des Forets, Field, & May (1996) Flower, D. R., Pineau des Forets, G., Field, D., & May, P. W. 1996, MNRAS, 280, 447
- Fuente et al. (1993) Fuente, A., Martin-Pintado, J., Cernicharo, J., & Bachiller, R. 1993, A&A, 276, 473
- Fuente et al. (1995) Fuente, A., Martin-Pintado, J., & Gaume, R. 1995, ApJ Let, 442, L33
- Fuente et al. (1998) Fuente, A., Martín-Pintado, J., Bachiller, R., Neri, R., & Palla, F. 1998, A&A 334, 253
- Fuente et al. (2001) Fuente, A., Neri, R., Martín-Pintado, J., Bachiller, R., Rodríguez-Franco, A., & Palla, F. 2001, A&A, 366, 873
- Fuente et al. (2002) Fuente, A., Martín-Pintado, J., Bachiller, R., Rodríguez-Franco, A., & Palla, F. 2002, A&A 387, 977
- Fuente et al. (2003) Fuente, A., Rodríguez-Franco, A., García-Burillo, S., Martín-Pintado, J., & Black, J. H. 2003, A&A, 406, 899
- García-Burillo et al. (2001) García-Burillo, S., Martín-Pintado, J., Fuente, A., & Neri, R. 2001, ApJ Let, 563, L27
- García-Burillo et al. (2000) García-Burillo, S., Martín-Pintado, J., Fuente, A., & Neri, R. 2000, A&A, 355, 499
- Green & Chapman (1978) Green, S. & Chapman, S. 1978, ApJS, 37, 169
- Gueth et al. (1996) Gueth, F., Guilloteau, S., & Bachiller, R. 1996, A&A, 307, 891
- Lee et al. (2003) Lee J.-E., Evans N.J., & Shirley Y.L., 2003, ApJ 583, 789
- Jørgensen et al. (2004a) Jørgensen, J. K., Hogerheijde, M. R., van Dishoeck, E. F., Blake, G. A., & Schöier, F. L. 2004a, A&A, 413, 993
- Jørgensen et al. (2004b) Jørgensen, J. K., Schöier, F. L., & van Dishoeck, E. F. 2004b, A&A, 416, 603
- Maret et al. (2004) Maret, S., et al. 2004, A&A, 416, 577
- Martín-Pintado et al. (1992) Martín-Pintado, J., Bachiller, R., & Fuente, A. 1992, A&A, 254, 315
- Nomura & Millar (2004) Nomura, H. & Millar, T. J. 2004, A&A, 414, 409
- Pickett et al. (1998) Pickett H.M., Poynter R.L., Cohen E.A., Delitsky M.L., Pearson J.C., Muller H.S.P., 1998, J. Quant. Spectrosc. & Rad. Transfer 60, 883
- Ray et al. (1990) Ray, T.P., Poetzel, R., Solf, J., & Mundt, R., 1990, ApJL, 357, L45
- Roberts & Millar (2000a) Roberts, H. & Millar, T. J. 2000a, A&A, 361, 388
- Roberts & Millar (2000b) Roberts, H. & Millar, T. J. 2000b, A&A, 364, 780
- Rodgers & Charnley (2003) Rodgers, S. D. & Charnley, S. B. 2003, ApJ, 585, 355
- Rodríguez-Franco et al. (1998) Rodríguez-Franco, A., Martin-Pintado, J., & Fuente, A. 1998, A&A, 329, 1097
- Schilke et al. (2001) Schilke, P., Pineau des Forêts, G., Walmsley, C. M., & Martín-Pintado, J. 2001, A&A, 372, 291
- Tafalla et al. (2002) Tafalla, M., Myers, P. C., Caselli, P., Walmsley, C. M., & Comito, C. 2002, ApJ, 569, 815
- Tafalla et al. (2004) Tafalla, M., Myers, P. C., Caselli, P., & Walmsley, C. M. 2004, A&A, 416, 191
- Testi et al. (1999) Testi, L., Palla, F., & Natta, A. 1999, A&A, 342, 515
- Tielens (1983) Tielens, A. G. G. M. 1983, A&A, 119, 177
- Tiné et al. (2000) Tiné, S., Roueff, E., Falgarone, E., Gerin, M., & Pineau des Forêts, G. 2000, A&A, 356, 1039
- van Dishoeck et al. (1995) van Dishoeck, E. F., Blake, G. A., Jansen, D. J., & Groesbeck, T. D. 1995, ApJ, 447, 760
- van der Tak et al. (2000) Van der Tak, F. F. S., van Dishoeck, E. F., & Caselli, P. 2000, A&A, 361, 327
- Viti et al. (2004) Viti, S., Collings M.P., Dever J.W., McCoustra M.R.S., Williams D.A., in press (astro-ph0406054)
- Williams et al. (1998) Williams J.P., Bergin E.A., Caselli P., Myers P.C., Plume R., 1998, ApJ 503, 689
- Wolfire et al. (2003) Wolfire M.G., McKee C.F., Hollenbach D., Tielens A.G.G.M., 2003, ApJ 587, 278