Fe K emission in the ultraluminous infrared galaxy Arp220
Abstract
Prominent Fe K line emission is detected in the XMM-Newton spectrum of the ultraluminous infrared galaxy Arp220. The centroid of the line is found at an energy of 6.7 keV and the equivalent width of the line is keV (at significance). A few other spectral features are found at various degrees of significance in the lower energy range on a hard 2.5–10 keV continuum (). The large EW of the Fe K line poses a problem with interpreting the hard X-ray emission as integrated X-ray binary emission. A thermal emission spectrum with a temperature of keV modified by absorption of cm-2, can describe the 2.5–10 keV continuum shape and the Fe K emission. A hot bubble that is shocked internally in a starburst region would have a similar temperature and gives a good explanation for the observed X-ray properties with a high star formation rate. An ensemble of radio supernovae in a dense environment, as suggested from VLBI imaging, could be another possibility, if such powerful supernovae are produced continuously at a high rate. However, the apparent lack of emission from X-ray binaries is incompatible with the high supernova rate ( SNe yr-1) required by both interpretations. Highly photoionized, low-density gas illuminated by a hidden Compton-thick AGN is a possible alternative for the hard X-ray emission, which can be tested by examining whether radiative recombination continua from highly ionized Ca and Fe are present in better quality data from a forthcoming observation.
keywords:
Galaxies: individual: Arp220 — X-rays: galaxies1 Introduction
Arp220 is the nearest ultraluminous infrared galaxy (ULIG), at (corresponding to Mpc for km s-1 Mpc-1), with per cent of its total bolometric luminosity emitted at infrared/submillimetre wavelengths [L⊙] (Soifer et al. 1984; Sanders et al 1988, 2003). It is an advanced merger system involving two relatively large spiral disks, as evidenced by the detection in the optical of two large, faint, crossed tidal tails (Joseph & Wright 1985; Sanders et al 1988), with two nuclei separated by arcsec ( pc), as determined from images in the radio (e.g. Becklin & Wynn-Williams 1987; Norris 1988; Baan & Haschick 1995) and near-infrared (e.g., Graham et al 1990; Scoville et al 2000) bands. High resolution CO observations imply an extreme nuclear molecular gas concentration (M⊙ at radii pc corresponding to a mean H2 density of - cm-3) (e.g., Scoville et al 1986; Solomon, Radford, Downes 1990; Scoville et al 1998; Sakamoto et al 1999). This is probably a consequence of disk gas being funnelled into the central regions of both galaxies during the merger (e.g., Barnes & Hernquist 1992). There is evidence for a galactic-scale outflow, as H and soft X-ray nebulae with a size of kpc (Armus, Heckman & Miley 1990; Heckman et al 1996) suggest, which is thought to be driven by a super-starburst (but see Colina, Arribas & Clements 2004 for a merger shock interpretaion). The optical spectrum is LINER-like (Veilleux, Kim & Sanders 1999), most likely due to shock-heated interstellar gas by the galactic wind (e.g., Taniguchi et al 1999), while the double nucleus region is heavily obscured by dust.
Arp220 is often used as a nearby template of luminous star-forming galaxies at high redshift, thus verifying the true dominant power source in Arp220 continues to be of great importance. There is still no convincing direct evidence, from radio to hard X-ray wavelengths, for an active nucleus in Arp220. The general assumption has been that the bolometric luminosity of Arp220 is mostly powered by a starburst, as perhaps best represented by a view based on ISO mid-infrared spectral characteristics (e.g. the PAH feature at 7.7 m – Genzel et al 1998; Sturm et al 1996). However, the interpretation of the ISO data for ULIGs, and Arp220 in particular, has recently been revised by Spoon et al (2004), who took ice absorption into account and concluded that the PAH component is rather weak with only moderate obscuration. They inferred that a major power source, whether a super star cluster or an AGN, must be deeply enshrouded in dust, similar to an interpretation previously proposed by Dudley & Wynn-Williams (1997). A few authors have suggested that a hidden QSO could be a major power source for Arp220 (e.g., Sanders et al 1988; Haas et al 2001). If an energetically significant AGN is present in Arp220, it must be Compton-thick (e.g., Rieke 1988). Hard X-rays constrain the lower bound of the absorbing column density to be cm-2 (Iwasawa et al 2001). The lack of cold reflection characterised by a 6.4 keV Fe K line means that the covering factor of the obscuring matter has to be close to unity.
Recent studies of nearby elliptical galaxies suggests that all large spheroids contain a supermassive black hole (SMBH: e.g., Richstone et al 1998). Given that the host galaxy of Arp220 already appears to have relaxed into an elliptical-like -law profile (e.g. Wright et al 1990), it seems reasonable to speculate that Arp220 may also contain a SMBH, perhaps even two, since the two observed nuclei have yet to merge. Two SMBH have recently been discovered in the luminous infrared galaxy NGC6240 (Komossa et al 2003), which is also an advanced merger system similar to Arp220. Given the detection of an enormous nuclear concentration of molecular gas in Arp220 there is plenty of material in the nuclear region to feed, and therefore build a SMBH, while also simultaneously suppressing the amount of direct emitted radiation from the nuclear source. This is not an implausible scenario, and a sensitive hard X-ray observation would have a better chance to catch the faintest sign of such a hidden AGN than observations at longer wavelengths, as sensitive hard X-ray observations of NGC4945 (Iwasawa et al 1993; Done et al 1996; Guainazzi et al 2001) and NGC6240 (Iwasawa & Comastri 1998; Vignati et al 1999; Ikebe et al 2000) have shown.
We present here our analysis and interpretations of the public archive XMM-Newton data on Arp220, with which a strong Fe K line is detected for the first time. This will hopefully be followed by a longer observation that should be scheduled sometime during AO-3.
2 Observations and data reduction
Arp220 was observed with XMM-Newton on 2002, August 11, and 2003, January 15. The two XMM-Newton observations were carried out in the Full Window mode and, when combined together, provide a useful exposure time of 19 ks. We only use the EPIC pn data because of its high sensitivity in the Fe K band. The data analysis presented here was performed using the latest version of the standard analysis package, SAS 6.0. Single and double events from the detector were selected and the data reduction was carried out following the standard procedure.
3 Results
3.1 The XMM-Newton EPIC spectrum

The hard X-ray ( keV) emission in Arp220 is only resolved at the resolution of the Chandra X-ray Observatory (Clements et al 2002; and see Section 3.2), and is point-like when viewed with the XMM-Newton telescope, although a much larger extension of soft X-ray emission is clearly resolved. As we focus on the hard X-ray emission, the spectral data are taken from a circular region of a arcsec radius, enough to collect most of the hard X-ray photons. The detailed location of the hard X-ray source is shown in Section 3.2.
The EPIC pn spectrum is shown in Fig. 1. The soft X-ray emission below keV is mostly due to the extended nebula, within which a wide range of spectral variations are present between regions, as revealed by the Chandra data (McDowell et al 2003). The data analysis presented here is restricted to the energy range 2.5–10 keV to focus on the hard X-ray emission around the double nucleus.
A prominent Fe K line is detected at significance (Fig. 1). The centroid of the feature is found at keV (in the rest frame; the errors represent the 90 per cent confidence region for one parameter of interest), indicating that FeXXV is the major line component. Fitting a single gaussian gives a line flux of ph s-1 cm-2. The corresponding equivalent width (EW) against the underlying continuum is keV. The inclusion of the gaussian line in the fitted model reduces by (23 degrees of freedom). The single gaussian fit does not require statistically significant broadening, but a multiple line complex in the 6.5–7 keV range would be more likely.
There are suggestions of other spectral features at 3.3, 3.9, 4.2 and 5.5 keV with their detection being at or lower. They all have possible identifications with a highly ionized plasma. Because of their low significance, we only give results of spectral fitting with narrow gaussians for those emission features in Table 1, and will not use them as critical materials for further discussion. However, we point out that they would be an important key to constrain the origin of the hard X-ray emission, once their detections are confirmed by better quality data. Especially, radiative recombination continua are spectral features unique to photoionized gas (Section 4.5).
| ID | |||
|---|---|---|---|
| keV | ph s-1 cm-2 | keV | |
| 0.20 | ArXVIII, SXIV RRC | ||
| 0.55 | CaXIX | ||
| 0.17 | CaXX | ||
| 0.45 | CaXX RRC | ||
| 1.85 | FeXX-FeXXVI |
The 2.5–10 keV continuum is very hard: fitting a power-law modified only by Galactic absorption ( cm-2) gives . The total 2–10 keV flux is erg cm-2 s-1. This value is in agreement with the value obtained from the Chandra observation (Clements et al 2002), but is smaller than the BeppoSAX MECS value erg cm-2 s-1. As pointed out by Clements et al (2002), the MECS aperture contains two hard X-ray sources to the south, and the discrepancy with BeppoSAX is probably due to contamination from these sources. The corresponding 2–10 keV luminosity is erg s-1, and .
The possibility that these contaminating sources in the XMM-Newton beam emit the iron line emission can be ruled out. The nucleus of Arp220 is the only significant source within the beam in the narrow band (6–7 keV) Chandra image (see Section 3.2). Given the large EW of the line (which means the iron line emission to dominates the 6–7 keV band), the Arp220 nucleus is certainly the iron line source.
3.2 Chandra imaging
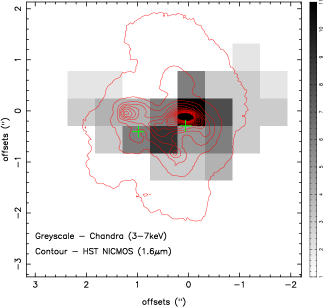
As reported previously, the hard X-ray emission is slightly extended but concentrated around the double nucleus (Clements et al 2002). Most of the 3–7 keV emission comes from radii within 0.7 kpc and very little originates beyond 1 kpc. Fig. 2 shows the Chandra 3–7 keV band image with the HST NICMOS 1.6m image superposed. The astrometry of the Chandra image has been corrected using the latest attitude correction file, and the HST image has been registered in the manner discussed in Scoville et al (1998). In this updated registration, the western nucleus (radio and near-infrared) now coincides with the 3–7 keV peak. Note the positions of the Eastern (radio) nucleus and the 1.6 m peak, the displacement of which is presumably due to strong obscuration (see Scoville et al 2000 for details on the near-infrared extinction in this region). The centroid of the 6–7 keV band emission, for which only 12 counts are detected and which is presumably mostly due to Fe K line emission (see also Clements et al 2002), may be slightly displaced from the Western nucleus to the East, but this is not conclusive. The Chandra spectrum of the hard X-ray source is consistent with the spectral model with gaussian lines fitted to the XMM-Newton spectrum in the 2–5 keV range. At higher energies, a comparison becomes difficult as the efficiency of Chandra declines sharply.
4 The origin of the hard X-ray emission
4.1 X-ray binary emission
It is generally assumed that the 2–10 keV emission in starburst galaxies is dominated by integrated emission from X-ray binaries, and its luminosity has been found to be correlated with star formation rate indicators, e.g., infrared luminosity (Nandra et al 2002; Ranalli, Comastri & Setti 2003; Grimm et al 2003). There may be non-thermal inverse Compton scattered emission of infrared photons by relativistic electrons (e.g., Moran & Lehnert 1997), but its contribution is probably minor. In Arp 220, the hard X-ray emission is resolved with Chandra and its extension coincides roughly with the dense molecular disk (e.g., Sakamoto et al 1999) in shape. However, the detection of the strong Fe K line readily rules out X-ray binaries as a major source of the 2–10 keV emission because of the spectral incompatibility.
If the infrared luminosity from Arp220 is entirely due to a starburst, the implied star formation rate is M⊙ yr-1 (Kennicutt 1998). With this high star formation rate, emission from X-ray binaries – which is estimated by assuming only high-mass X-ray binaries111In a young starburst system, as low mass X-ray binaries are not yet formed, it is appropriate to consider only high-mass X-ray binaries (Persic & Rephaeli 2002)., and by following Franceschini et al (2003; see also Persic & Rephaeli 2002; Persic et al 2004) – should dominate, or in fact, exceed the observed luminosity by more than one order of magnitude, even if absorption of the order of -cm-2 in is taken into account. The lack of X-ray binary emission appears to be a general problem with a starburst interpretation for Arp220, given the good correlation between the 2–10 keV X-ray binary emission and the infrared luminosity claimed for star forming galaxies (e.g., Ranalli, Comastri & Setti 2003; Grimm et al 2003; Persic et al 2004).
In the following subsections, we discuss two possible origins of the Fe K line in the context of a starburst, based on the thermal emission model for the observed X-ray spectrum. Both explanations require as high as a star formation rate mentioned above, therefore the lack of the X-ray binary emission remains to be a problem.
4.2 Thermal emission model
With the Fe K line centred at 6.7 keV, it seems tempting to interpret the hard X-ray emission as thermal emission from hot gas associated with a starburst. Fitting the 2.5–10 keV data with the collisionally ionized plasma spectra computed by the MEKAL code (e.g., Kaastra 1992) gives the following results: The temperature of the gas implied from the fit is keV. The absorption column density is not well constrained, but the likely value for the best-fit temperature is cm-2. The metallicity, which is primarily determined by the Fe K line strength, is found to be solar (the solar abundance table by Anders & Grevesse 1989 is used here).
The thermal emission model accounts for the continuum shape and the Fe K feature (with for 17 degrees of freedom), but would leave the possible lower energy features unexplained. Since the interstellar gas in a starburst region is expected to be enriched by core-collapse supernovae (e.g., Type II SNe), which produce substantial -elements but a relatively small amount of iron. The twice-solar Fe metallicity required to explain the Fe K feature is already large, although it may not be surprising for a region with intense star formation (e.g., Fabbiano et al 2004). A non-solar abundance ratio between -elements and Fe, as expected for chemical enrichment by Type II SNe, might be required, if the detection of the high ionization Ar and Ca features are confirmed by higher quality data. If confirmed, the CaXIX He- at 3.9 keV (Table 1) would not be compatible with the single temperature thermal model, because with a temperature of 7 keV, calcium ions are mostly CaXX.
4.3 A hot bubble in a starburst region
According to the starburst-driven superwind model, a hot bubble of internally shocked wind material with a temperature of several keV will form in the starburst region (Chevalier & Clegg 1985), which eventually breaks away to drive a galactic-scale outflow (e.g., Tomisaka & Ikeuchi 1988). Although such a hot bubble is expected not to be radiative because of its rarefied interior, and is indeed rarely observed directly in starburst galaxies (e.g., Suchkov et al 1994; Strickland & Stevens 2000; Hoopes et al 2003)222The presence of such hot gas has been reported in M82 by Griffiths et al (2000) and in NGC253 by Pietsch et al (2001), but for NGC253, photoionization by AGN is proposed by Weaver et al (2002)., the temperature of keV implied from the above thermal emission model matches the prediction. In fact, the observed temperature and luminosity agree roughly with the predicted values from the wind solution by Chevalier & Clegg (1985) with the mass and energy input rates estimated by Starburst99 (Leitherer et al 1999) for the star formation rate of 200 M⊙ yr-1 (see below) and a high thermalization efficiency ().
As the Chandra image shows, most of the hard X-ray emission in Arp220 comes from within kpc of the double nucleus. Assuming the thermal plasma is uniformly distributed within a sphere with a radius of 0.7 kpc, the mean gas density and the total gas mass are derived to be cm-3 and M⊙, respectively. The thermal energy contained in the volume is estimated to be erg. The bolometric luminosity of the gas of erg s-1 means that the cooling time of the gas is yr. This value is insensitive to the non-solar abundance ratio, because, at a temperature of keV, the cooling is dominated by bremsstrahlung continuum rather than line emission.
With the star formation rate of 200 M⊙ yr-1, the mass injection rate from OB stars is M⊙ yr-1, assuming a Salpeter IMF and a mass loss rate of M⊙, typical for each massive star (see also Elson, Fall & Freeman 1989; Heckman et al 1990). Starburst99 also gives a mass injection rate of M⊙ yr-1 both from stellar winds and supernovae, assuming continuous star formation and a starburst age yr. The above IMF is assumed to have an upper mass cut-off at 100 M⊙. If the IMF is truncated at 30 M⊙, the estimate is reduced by a factor of 2 or less. However, given the cooling time, the expected mass input is sufficient to supply and maintain the hot gas.
At a temperature of 7 keV, the sound speed is km s-1. So, the sound-crossing time over the radius of the hard X-ray emitting region (0.7 kpc), is yr. Since the sound crossing time is much shorter than the cooling time, the hot gas, which will not be static because of its high pressure ( dyne cm-2), will drive a superwind.
In terms of the energetics of the gas, heating by SNe is sufficient to counterbalance the radiative loss. As discussed in the following section, the expected supernova rate is SNe yr-1, implying an energy injection rate of erg s-1(or Starburst99 gives the mechanical luminosity of erg s-1). The required fraction of the SN energy that goes to heating is very small . Therefore, the bulk of the energy has to escape in the form of a wind – given the moderate soft X-ray nebula luminosity – without depositing the energy onto the galactic medium to radiate. This hot bubble interpretation appears entirely plausible, apart from the X-ray binary problem mentioned above.
4.4 Luminous radio supernovae
An alternative origin for the thermal emission is an ensemble of supernovae. Several radio knots distributed over the nuclear region have been imaged with VLBI, and are interpreted as very luminous compact radio supernovae taking place in a dense environment (Smith et al 1998). They can be luminous X-ray sources, as Type IIn SNe (Benetti et al 1995) like SN1986J (Houck et al 1998), SN1988Z (Fabian & Terlevich 1996) and SN1995J (Fox et al 2000) have X-ray luminosities of –erg s-1. Their X-ray spectra seem hard enough to match the hard-band spectrum of Arp220, i.e., temperatures of 3–10 keV in when fitted with a thermal emission model (as summarised in Fox et al 2000), and at least SN1986J shows evidence for a strong Fe K line at 6.7 keV (Houck et al 1998). With a star formation rate of 200 M⊙ yr-1, the expected supernova rate is SNe yr-1, as also estimated by Smith et al (1998). If 1 per cent of the total energy of each SN goes into radiation, and is emitted at erg s-1, then the cooling time is yr, which is roughly comparable to the estimated average time between SNe (however, as the radiative efficiency might be much higher in the dense environment, these SNe could overproduce the integrated X-ray luminosity). Therefore it is plausible to have multiple X-ray SNe at the same time, and to maintain a stable hard X-ray luminosity until most of the massive stars die out.
Whether powerful SNe like SN1986J are constantly produced in the Arp220 nuclear region is questioned by the second VLBI observation following the results presented in Smith et al (1998) three years later. Most of the radio knots have faded by 8–50 per cent (some remain at the same brightness), but no new compact sources have appeared (Smith et al 1999). The slow decline is not consistent with a luminous SN model. The SN rate also has to be lowered ( SNe yr-1, Smith et al 1999). Although this estimate is only for the powerful radio SNe, X-ray luminous SNe are probably closely related. With these facts, it is unclear whether the above explanation of the hard X-ray emisson with powerful SNe is sustainable.
4.5 Photoionized gas
Photoionized gas illuminated by a hidden AGN is still a viable alternative for Arp220. In fact, if the possible radiative recombination continuum (RRC) feature is real, it may be the most likely interpretation. A high ionization parameter erg cm s-1, where erg s-1, cm-3, cm, are respectively the ionizing luminosity, density and distance from the source, is implied by the line emission centred at 6.7 keV. The extension of the hard X-ray emission points to the presence of a larger region of low density interstellar gas with density of the order of 1-10 cm-3. Extended photoionized nebulae have been found in a number of nearby Seyfert 2 galaxies, some of which show extended Fe K emission (e.g., NGC4945, Done et al 2003; NGC4388, Iwasawa et al 2003).
The photoionized gas in AGN appears to have ionization parameters distributed over a wide range (e.g., Krolik & Kriss 2001; Kinkhabwala et al 2002). Although detailed modelling of the Arp220 hard X-ray spectrum is beyond the scope of this paper, given the quality (and also the spectral resolution) of the present data, our preliminary inspection using the photoionization code, XSTAR (Kallman & Bautista 2001) indicates log in the range of 2.8–3.5 is relevant to the observed spectral features. Absorption with a column density of the order of cm-2 would be required for this photoionized spectrum not to dominate the soft X-ray band and to make the spectrum as hard as is observed.
This photoionization model predicts RRC features at 5-5.5 keV from CaXIX,XX and at keV from FeXXV,XXVI, which should be relatively isolated so that they could be resolved at the CCD resolution if the data quality is improved. This could provide a crucial test for the photoionization model when longer exposure hard X-ray data are obtained.
Strong Fe K line complex emission, consisting of a 6.4 keV line, which is usually the strongest as expected from FeI-XVII, and higher energy lines of FeXXV (6.7 keV) and FeXXVI (6.97 keV), has been observed in a number of Compton-thick Seyfert 2 nuclei (e.g., NGC1068, NGC6240, NGC4945). It is clear that the 6.4 keV line and the higher energy lines originate from different matter because of their large difference in ionization stages. The narrow line width of the latter naturally suggests that the line emitting gas is optically thin.
The strong 6.4 keV lines seen in good quality spectra of Seyfert 2 nuclei often show a Compton shoulder, i.e. a weak redward extension to the line core (e.g., Iwasawa et al 1997; Bianchi et al 2002; Kaspi et al 2002; see also George & Fabian 1991; Matt 2002 for theory). This means that the 6.4 keV line results from reflection from optically thick matter, which is, in the torus model for the unification scheme, identified as the visible surface of the inner wall of the obscuring torus (e.g., Awaki et al 1991; Ghisellini, Haardt & Matt 1994; Krolik, Madau & Życki 1994).
No detection of a 6.4 keV line in the Arp220 spectrum implies the lack of reflection from optically-thick cold matter, and perhaps suggests that the visibility of the torus inner wall is very limited. The conditions for an energetically significant AGN to exist in Arp220, imposed by the hard X-ray observation, are that the obscuring matter must have a column density larger than cm-2 with a covering factor close to unity (Iwasawa et al 2001). With the very high covering factor, the inner wall of the obscuring torus is capped and never visible, which could explain the lack of a 6.4 keV line. If a tiny fraction of light from a hidden nucleus leaks through the heavy obscuration, the surrounding low density medium could be highly ionized to give rise to “hot” Fe K line emission.
The covering fraction, , can be estimated based on the Fe K line flux, by comparing the well-studied Compton-thick AGN, NGC1068. NGC1068 has a large infrared excess with erg s-1 for an assumed source distance of 14.4 Mpc. The 6.8 keV line flux measured in the Chandra data is ph s-1 cm-2 (Young, Wilson & Shopbell 2001; a similar flux was measured by Iwasawa et al 1997 for the sum of FeXXV and FeXXVI in the ASCA data). Kinkhabwala et al (2002) estimated erg s-1, by fitting the detailed photoionization model to the RGS data on NGC1068. If both NGC1068 and Arp220 are powered by hidden AGN, and the hot Fe K line emitting region in NGC1068 sees the same ionizing source, then for Arp220 is erg s-1, and with , is estimated to be per cent, which can be compared with per cent for NGC1068 ( per cent from the Chandra image, Kinkhabwala et al 2002) under the same assumption. Thus, reducing the opening fraction of the obscuration further would make the photoionization model consistent with that for NGC1068.
5 The power source of the far-infrared emission
While there is no doubt that a starburst is taking place in Arp220, various mid-infrared characteristics, summarised by Spoon et al (2004, and reference therein), the superwind luminosity inferred from the H and soft X-ray nebulae (Suchkov et al 1996; Iwasawa 1999; also McDowell et al 2003 for an alternative interpretation of merger shock), and the X-ray binary emission in the hard X-ray band, as discussed above, are all unusually low relative to the far-infrared luminosity for starburst galaxies.
The peculiarity of Arp220 is well illustrated by Spoon et al (2004), who re-examined the ISO mid-infrared spectrum with the knowledge of a number of ice absorption features across the band. Their spectral analysis and the higher resolution study by Soifer et al (2002) demonstrate that the mid-infrared emission in Arp220 consists of diffuse PAH emission with a moderate amount of absorption and a NGC4418-like, heavily absorbed continuum. The latter is more likely to contribute to the far-infrared luminosity of Arp220, although the above authors note that, if all the far-infrared luminosity is powered by a hidden AGN, it would not even be visible at mid-infrared wavelengths.
If, say, 10 per cent, of the bolometric luminosity (L⊙) was due to a moderately obscured starburst, the outward characteristics of such a starburst as described above would then be in agreement with most other starburst galaxies. For example, the soft X-ray nebula has the luminosity of erg s-1, consistent with the predicted luminosity ratio of X-ray and starburst-powered infrared emission for a superwind nebula (log (SX/IR) , Leitherer & Heckman 1999; Strickland & Stevens 2000). Also, the X-ray binary emission in the hard X-ray band approaches the correlation line with the star formation rate for local starburst galaxies (Ranalli et al 2002; Grimm et al 2002).
If such a lower luminosity starburst was indeed the case, the rest of Arp220’s luminosity would have to be explained by something else. Spoon et al (2004) suggested a deeply shrouded ultra dense starburst, in addition to the less obscured starburst, which is responsible for the diffuse PAH emission. The estimated optical depth based on their modelling of the ISO spectrum implies that the column density to such a star cluster would be cm-2. Since X-rays at energies higher than a few keV are transparent to this level of obscuration, luminous hot gas, for instance, associated with the star cluster would be observable as a hard X-ray excess, which is not apparent in the data.
An alternative option is an even more deeply buried AGN. If the photoionized gas interpretation was correct for the detected Fe K line, then the presence of an AGN would be proved. It is not straightforward to estimate the intrinsic luminosity of such an obscured AGN without seeing its transmitted radiation: once the line of sight Thomson depth exceeds unity (Compton thick), the visibility of nuclear X-ray emission is largely determined by geometry, e.g., the covering factor, distribution of the gas density etc., which are not known. However, the comparison with NGC1068 (Section 4.4) demonstrates that with per cent, the detected Fe K line luminosity is consistent with the assumption that all the luminosity is powered by an AGN. Therefore once the photoionization origin for the Fe K line is confirmed, it would be plausible that an AGN dominates the energetics. The radio spectrum of Arp220 must then be explained by free-free absorption, the opacity of which should be larger than those in the Compton-thick AGN in NGC6240 and NGC4945 (see Fig. 5 in Iwasawa et al 2001).
There are a few interesting infrared luminous objects to compare with Arp220. NGC4418 is a luminous infrared galaxy with L⊙, and its mid-infrared spectrum shows no PAH features, but is shaped by silicate and various ice absorption features (Spoon et al 2001). Very faint X-ray emission with erg s-1 has been detected from the centre of NGC4418 with Chandra (Maiolino et al 2003). The luminosity ratio of X-ray and infrared emission for NGC4418 is even smaller than that of Arp220. The hyper-luminous infrared galaxy, IRAS 00182–7112 (), has kinematical evidence for a superwind (Heckman et al 1990), as in Arp220, and its mid-infrared spectrum is classified as Class 1 by Spoon et al (2002), i.e., it is NGC4418-like. A recent XMM-Newton observation of IRAS 00182–7112 detected a Fe K line at 6.7 keV with keV on a flat continuum (K. Nandra, priv comm), reminiscent of Arp220.
These three objects share similar properties, and if they are powered by stars, they are starbursts for which the widely used relation between far-infrared (or the translated star formation rate) and hard X-ray (X-ray binary emission) luminosities does not apply. Their 2–10 keV X-ray luminosities are well below the correlation line of Ranalli et al (2003) and Grimm et al (2003). The detection of the Fe K line, in Arp220 in particular, means that their X-ray binary contribution to the 2–10 keV band must be minor, making them deviate from the correlation further. Hiding most of the X-ray binaries behind thick obscuration required a substantial mass of gas and dust, given the observed spatial extension (e.g., Arp220). If the formation of X-ray binaries were suppressed, an unusually large suppressing factor ( for Arp220 when compared with Grimm et al 2003) would be required. An heavily obscured AGN may offer a more relaxed solution for the embedded power sources for all three of these objects. For Arp220, of course, a substantial starburst (L⊙) would still be required to explain the near-mid infrared light, superwind signatures and radio supernovae etc.
Acknowledgements
The XMM-Newton data presented here were obtained from the XMM-Newton Science Archive maintained by the Science Operations Centre and the observations were carried out in the Guaranteed-Time program (PI, B. Aschenbach). We thank Steve Allen, Steve Smartt, Massimo Ricotti, Andy Fabian, and Dave Strickland for useful discussion and Paul Nandra for information on his unpublished result. ASE was supported by NSF grant AST 00-80881. GM, KI and NT thank PPARC for support.
References
- [1] Anders E., Grevesse N., 1989, Geochim. Cosmochim. Acta, 53, 197
- [2] Armus L., Heckman T.M., Miley G.K., 1990, ApJ, 364, 471
- [3] Awaki H., Koyama K., Inoue H., Halpern J.P., 1991, PASJ, 43, 195
- [4] Baan W.A., Haschick A.D., 1995, ApJ, 454, 745
- [5] Barnes, J.E., Hernquist, L., 1992, ARAA, 30, 705
- [6] Becklin, E.E., Wynn-Williams, C.G., 1987, in Star Formation in Galaxies, (Washington, D.C.: U.S. Government Printing Office), ed. C.J. Lonsdale, p643
- [7] Benetti S., Bouchet P., Schwarz H., 1995, IAU Circ., 6170
- [8] Bianchi S., Matt G., Fiore F., Fabian A.C., Iwasawa K., Nicastro F., 2002, A&A, 396, 793
- [9] Brinkman A.C, Kaastra J.S., van der Meer R.L.J., Kinkhabwala A., Behar E., Khan S.M., Paerels F.B.S., Sako M., 2002, A&A, 396, 761
- [10] Chevalier R.A., Clegg A.W., 1985, Nat, 317, 44
- [11] Clements D. L., McDowell J. C., Shaked S., Baker A. C., Borne K., Colina L., Lamb S. A., Mundell C., 2002, ApJ, 581, 974
- [12] Colina L., Arribas S., Clements D., 2004, ApJ, 602, 181
- [13] Done C., Madejski G.M., Życki P.T., Greenhill L.J., 2003, ApJ, 588, 763
- [14] Dudley C.C., Wynn-Williams C.G., 1997, ApJ, 488, 720
- [15] Elson R.A.W., Fall S.M., Freeman K.C., 1989, ApJ, 336, 734
- [16] Evans A.S., et al, 2003, AJ, 125, 2341
- [17] Fabbiano G. et al., 2004, ApJ, 605, L21
- [18] Fabian A.C., Terlevich R., 1996, MNRAS, 280, L5
- [19] Fox D.W., et al., 2000, MNRAS, 319, 1154
- [20] Franceschini A., et al., 2003, MNRAS, 343, 1181
- [21] Ghisellini G., Haardt F., Matt G., 1994, MNRAS, 267, 743
- [22] Genzel R., et al, 1998, ApJ, 498, 579
- [23] George I.M., Fabian A.C., 1991, MNRAS, 249, 352
- [24] Graham, J.R., Carico, D.P., Matthews, K., Neugebauer, G., Soifer, B.T., Wilson, T.D., 1990, ApJ, 354, L5
- [25] Griffiths R.E., Ptak A., Feigelson E.D., Garmire G., Townsley L., Brandt W.N., Sambruna R., Bregman J.N., 2000, Science, 290, 1325
- [26] Grimm H.-J., Gilfanov M., Sunyaev R., 2003, MNRAS, 339, 793
- [27] Haas M., Klaas U., Müller S.A.H., Chini R., Coulson I., 2001, A& A, 367, L9
- [28] Heckman T.M., Armus L., Miley G.K., 1990, ApJS, 74, 833
- [29] Heckman T. M., Dahlem M., Eales S. A., Fabbiano G., Weaver K., 1996, ApJ, 457, 616
- [30] Hoopes C. G., Heckman T. M., Strickland D. K., Howk J. C., 2003, ApJ, 596, L175
- [31] Houck J.C., Bregman J.N., Chevalier R.A., Tomisaka K., 1998, ApJ, 493, 431
- [32] Ikebe Y., Leighly K., Tanaka Y., Nakagawa T., Terashima Y., Komossa S., 2000, MNRAS, 316, 433
- [33] Iwasawa K., Fabian A. C., Matt G., 1997, MNRAS, 289, 443
- [34] Iwasawa K., Comsatri A., 1998, MNRAS, 297, 1219
- [35] Iwasawa K., 1999, MNRAS, 302, 96
- [36] Iwasawa K., Matt G., Guainazzi M., Fabian A. C., 2001, MNRAS, 326, 894
- [37] Iwasawa K., Wilson A.S., Fabian A.C., Young A.J., 2003, 345, 369
- [38] Joseph, R.D., Wright, G.S., 1985, MNRAS, 214, 87
- [39] Kaastra J.S., 1992, An X-Ray Spectral Code for Optically Thin Plasmas, Internal SRON-Leiden Report, updated version 2.0
- [40] Kallman T., Bautista M., 2001, ApJS, 133, 221
- [41] Kaspi S., et al., 2002, ApJ, 574, 643
- [42] Kennicutt R.C.Jr, 1998, ARAA, 36, 189
- [43] Kinkhabwala A., et al., 2002, ApJ, 575, 732
- [44] Komossa S., Burwitz V., Hasinger G., Predehl P., Kaastra J.S., Ikebe Y., 2003, ApJ, 582, 15
- [45] Krolik J. H., Madau P., Życki P. T., 1994, ApJ, 420, L57
- [46] Krolik J.H., Kriss G.A., 2001, ApJ, 561, 684
- [47] Leitherer C., et al, 1999, ApJS, 123, 3
- [48] Maiolino R., et al, 2003, MNRAS, 344, 59
- [49] Matt G., 2002, MNRAS, 337, 147
- [50] McDowell J.C., et al., 2003, ApJ, 591, 154
- [51] Moran, E.C., Lehnert M.D., 1997, ApJ, 478, 172
- [52] Nandra K., Mushotzky R.F., Arnaud K., Steidel C.C., Adelberger K.L., Gardner J.P., Teplitz J.I., Windhorst R.A., 2002, ApJ, 576, 625
- [53] Norris, R.P., 1988, MNRAS, 230, 345
- [54] Persic M., Rephaeli Y., 2002, AA 382, 843
- [55] Persic M., Rephaeli Y., Braito V., Cappi M., Della Ceca R., Franceschini A., Gruber D.E., 2004, A& A, 419, 849
- [56] Pietsch W., et al., 2001, A&A, 365, L174
- [57] Ranalli P., Comastri A., Setti G., 2003, A&A, 399, 39
- [58] Richstone D., et al 1998, Nat, 395, 14
- [59] Rieke G.H., 1988, ApJ, 331, L5
- [60] Sakamoto K., Scoville N.Z., Yun M.S., Crosas M., Genzel R., Tacconi L.J., 1999, ApJ, 514, 68
- [61] Sanders, D.B., Mazzarella, J.M., Kim, D.-C., Surace, J.A., 2003, AJ, 126, 1607
- [62] Sanders D.B., Scoville N.Z., Soifert B.T., 1991, ApJ, 370, 158
- [63] Sanders D.B., Soifer B.T., Elias J.H., Madore B.F., Matthews K., Neugebauer G., Scoville N.Z., 1988, ApJ, 325, 74
- [64] Scoville N.Z., Evans A.S., Thompson R., Rieke M., Hines D.C., Low F.J., Dinshaw N., Surace J.A., Armus L., 2000, AJ, 119, 991
- [65] Scoville, N.Z., Sanders, B.T., Sargent, A.I., Soifer, B.T., Scott, S.L., Lo, K.Y., 1986, ApJ, 311, L47
- [66] Scoville N.Z., Yun M.S., Bryant P.M., 1997, ApJ, 484, 702
- [67] Scoville N.Z., et al., 1998, ApJ, 492, L107
- [68] Smith H.E., Lonsdale C.J., Lonsdale C.J., Diamond P.J., 1998, ApJ, 493, L17
- [69] Smith H.E., Lonsdale C.J., Lonsdale C.J., Diamond P.J., 1999, Ap& SS, in “Ultraluminous Infrared Galaxies: Babies or Monsters”, eds. R. Genzel, D. Lutz & L. Tacconi, 266, 125
- [70] Soifer, B.T., Neugebauer, G., Helou, G., Lonsdale, C.J., Hacking, P., Rice, W., Houck, J.R., Low, F.J., Rowan-Robinson, M., 1984, ApJ, 283, L1
- [71] Soifer B.T., Neugebauer G., Matthews K., Egami E., Weinberger A.J., 2002, AJ, 124, 2980
- [72] Solomon P.M., Radford S.J.E., Downes D., 1990, ApJ, 348, L53
- [73] Spoon H.W.W., Keane J.V., Tielens A.G.G.M., Lutz D., Moorwood A.F.M., 2001, A&A, 365, L353
- [74] Spoon H.W.W., Keane J.V., Tielens A.G.G.M., Lutz D., Moorwood A.F.M., Laurent O., 2002, A&A, 385, 1022
- [75] Spoon H.W.W., Moorwood A.F.M., Lutz D., Tielens A.G.G.M., Seibenmorgen R., Keane J.V., 2004, A&A, 414, 873
- [76] Suchkov A. A., Balsara D. S., Heckman T. M., Leitherner C., 1994, ApJ, 430, 511
- [77] Suchkov A.A., Berman V.G., Heckman T.M., Balsara D.S., 1996, ApJ, 463, 528
- [78] Strickland D.K., Stevens I.R., 2000, MNRAS, 314, 511
- [79] Strickland D., 2002, Chemical Enrichment of the Intracluster and Intergalactic Medium”, ASP Conference Proceedings Vol 253, eds. R. Fusco-Femiano and F. Matteucci, p387
- [80] Strum E., et al, 1996, A&A, 315, L133
- [81] Taniguchi Y., Yoshino A., Ohyama Y., Nishiura S., 1999, ApJ, 514, 660
- [82] Tomisaka K., Ikeuchi S., 1988, 330, 695
- [83] Veilleux S., Kim D.-C., Sanders D.B., 1999, ApJ, 522, 113
- [84] Weaver K.A., Heckman T.M., Strickland D.K., Dahlem M., 2002, ApJ, 576, L19
- [85] Wright, G.S., James, P.A., Joseph, R.D., McLean, I.S., 1990, Nature, 344, 417
- [86] Young A.J., Wilson A.S., Shopbell P.L., 2001, ApJ, 556, 6