11email: mguainaz@xmm.vilspa.esa.es
2Dipartimento di Fisica “E.Amaldi”, Università “Roma Tre”, Via della Vasca Navale 84, I-00146, Roma, Italy
The early stage of a cosmic collision? XMM-Newton unveils two obscured AGN in the galaxy pair ESO509-IG066
We report the XMM-Newton discovery of a X-ray bright AGN pair in the interacting galaxy system ESO509-IG066. Both galaxies host an X-ray luminous ( erg s-1) obscured nucleus with column densities cm-2 and cm-2. The optical morphology is only mildly disturbed, suggesting a merging system in the early stage of its evolution. Still, the pair is probably gravitationally bound, and might eventually evolve into a compact, fully gas embedded systems such as NGC 6240 (Komossa et al. (2003)).
Key Words.:
Galaxies:interactions – Galaxies:Seyfert – Galaxies:individual:ESO509-IG066 – X-rays:galaxies1 Introduction
About 20 bona fide Active Galactic Nuclei (AGN) pairs are currently known (Kochanek et al. (1999)). They represent about 0.1% of QSO optical surveys (Hewett et al. (1998)), although this number is dependent on the criteria used to distinguish between “true pairs” and gravitational lenses (Mortlock et al. (1999)).
AGN pairs are a potentially interesting laboratory to study the early phases of AGN activity. Gas shock and compression caused by galaxy interactions may lead to feeding otherwise quiescent super-massive black holes, and to enhanced star formation (Rees (1984); Byrd et al. (1986)). The possible role of merging and flybys to bring gas to the nuclear region has been examined by means of N-body simulations (Barnes & Hernquist (1992); Hernquist & Mihos (1995); Taniguchi & Wada (1996)). Observationally, quasars seem indeed to live in denser environment then normal galaxies (Kauffmann et al. (2004)), whereas the same evidence for low-luminosity AGN is still controversial (Laurikainen et al. (1994); Rafanelli et al. (1995); de Robertis et al. (1998); Schmitt (2001)).
In this paper we present the first X-ray imaging and spectroscopic observation of the interacting galaxy pair ESO509-IG066 (Arp & Madore (1987)), and report the discovery that both galaxies host a luminous ( erg s-1) and obscured X-ray source. The optical nuclei of the pair are
File Gi131.gif
aligned in the E-W direction at a projected separation of 16, with spectroscopic redshifts and (Sekiguchi & Wolstencroft (1992)). The W source was classified as a Seyfert 2 galaxies on the basis of the [Nii]6583/Hα and [Oiii]5007/Hβ ratios. In the E source, the lack of Hβ detection favored a H II or LINER classification (Sekiguchi & Wolstencroft (1992)). In the X-ray band, only a detection by the Ginga/LAC is reported in the literature, with a 2-10 keV flux of erg cm-2 s-1 (Polletta et al. (1996)).
At their redshift, the apparent distance of the pair members translates into a projected physical separation kpc. The line-of-sight velocity difference is km s-1. For comparison, in the Mortlock et al. (1999) sample of binary quasars: kpc and km s-1.
In this paper: energies are quoted in the source’s frame; errors on the count rates are at the 1- level; errors on the spectral parameters are at the 90% confidence level for 1 interesting parameter; a flat CDM cosmology with Mpc km s-1 and () = (0.3,0.7), (Bennett et al. (2003)) is assumed, unless otherwise specified.
2 The data
XMM-Newton observed the sky region around ESO509-IG066 on January 24, 2004. The 3030 field-of-view EPIC cameras (MOS; Turner et al. 2001; pn, Stüder et al. 2001) were operating in Full Frame Mode with the Medium and Thin optical rejection filter, respectively. Data were reduced with SAS v6.0.0, using the most updated calibration files. Particle background was screened by applying optimized thresholds to the single-event, keV, 10-s binned, field-of-view light curve: 0.5 and 3.5 for the MOS and pn, respectively. After screening the exposure times are 9.7 and 8.6 ks for the MOS and the pn, respectively.
In Fig. 2 we show the EPIC images of the innermost 1
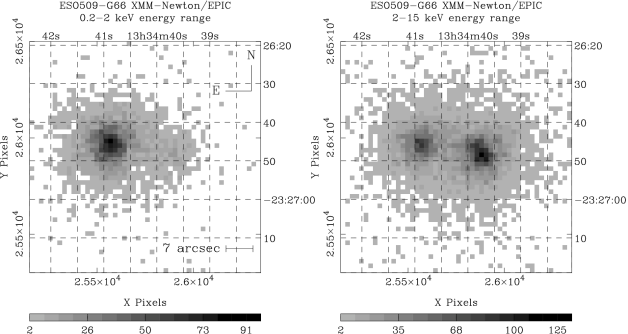
around the ESO509-IG066 Galaxy Pair centroid in the soft (0.2–2 keV) and hard (2–15 keV) energy bands. In the soft band, the E source is clearly visible, whereas the W source becomes the brightest in the hard band.
| Source | RA (J2000) | Dec (J2000) | EB | CR |
|---|---|---|---|---|
| () | (s-1) | |||
| W | 13h34m39s.7 | -23∘2648 | 7 | |
| E | 13h34m40s.8 | -23∘2645 | 10 |
Their positions (Tab. 1) are consistent with the optical nuclei of the galaxy pair members, once the statistical error box, and a residual 2 systematic uncertainties in the absolute position reconstruction are taken into account.
For such close X-ray sources, point spread function contamination is a potential issue in EPIC. In order to account for this effect, we extracted source scientific products from comparatively small circles of 7 and 8 radius for Source W and E, respectively. We used only single and double (single to quadruple) events in the pn (MOS). Background scientific products for each galaxy were generated by combining spectra extracted from standard offset regions on the same chip as the targets, and the appropriate fraction (4%) of the spectrum of the companion. Spectra were rebinned in order to oversample the instrumental resolution by a factor not larger than 3, and to ensure that each background-subtracted spectral channel has 25 counts at least. We have restricted the spectral analysis to the bands 0.5–10 keV and 0.35–15 keV for the MOS and the pn, respectively, where the instrument are best calibrated, and fit the spectra simultaneously with Xspec v11.3.0.
The spectra of both sources can be reasonably well fit with the combination of two continua. The bulk of the X-ray emission is due to a photoelectrically absorbed power-law. The column densities are cm-2, and cm-2 for Source W and E, respectively. Both are significantly larger than the contribution due to intervening gas in our Galaxy ( cm-2, Dickey & Lockman 1990). A soft excess above the photoelectrically absorbed power-law can be well accounted for by another power-law modified only by Galactic absorption In Source W an emission line is detected at the 99.95% confidence level according to the F-test (Protassov et al. (2002)). Its centroid energy is consistent with Kα fluorescence from neutral or mildly ionized iron. The Equivalent Width ( eV) is typical of Compton-thin Seyfert 2 galaxies (Risaliti (2002)). Tab. 2 lists the best-fit parameters
| Absorbed power-law | Soft excess | Kα iron line | Fluxes and luminosities | |||||
| Source | F | |||||||
| ( cm-2) | (%) | (keV) | (eV) | ( erg cm-2 s-1) | ( erg s-1) | |||
| W | 0.12/5.2 | 105.8/130 | ||||||
| E | 6.4a | 0.6/3.0 | 170.2/167 | |||||
afixed
and results. Fig. 3


shows the spectra, best-fit models, and residuals.
The 0.5–10 keV intrinsic luminosity is erg s-1 for both X-ray sources, typical for luminous Seyfert galaxies, and much larger than observed in LINERS (Ho et al. (2001); Terashima et al. (2002)). A substantial contribution by shocked starburst gas, X-ray binaries or supernovae is unlikely. ESO509-IG066 is the X-ray brightest AGN pair ever detected so far. At the flux level observed by XMM-Newton, both AGN should have been detected by the ROSAT All Sky-Survey, with count rates of 5.3 and s-1 for source E and W, respectively. However, the closest detected RASS source is 50 away from the AGN pair centroid. Only a count rate 3 upper limit of s-1 was measured by the RASS at the AGN pair position.
3 Discussion
Once established that most galaxies host a super-massive black hole (Kormendy et al. (1997)), the next open issue is the mechanism that triggers gas accretion and ultimately nuclear activity. Galaxy encounters could be one of these triggers (Silk & Rees (1998); Taniguchi (1999)). Gravitational torques generated during the encounter can cause gas inflow toward the nucleus (Barnes & Hernquist (1996)). Although such inflows are not strong enough to create new black holes, they are consistent with the refueling of “quiescent” black holes.
Is the pair in ESO509-IG066 a binary AGN? On a statistical basis, binary quasars become active at projected separations between 50 and 100 kpc, and recover (apparent) quiescence at separations shorter than 10 kpc (Mortlock et al. (1999)). If the onset of nuclear activity is indeed related to galaxy interaction, it should “turn on” during galaxy merging, and AGN should be found preferentially in highly disturbed environment, with enhanced star formation. This is, however, not the case of ESO509-IG066, whose galaxies exhibit only mild surface brightness disturbances (cf. Fig. 1). An analogous case is MGC 2214+3350 (Muñoz et al. (1998)). Morphologically mildly disturbed systems could represent young binaries, in the earliest phase of their encounter (Kochanek et al. (1999)). It is tempting to speculate that they might represent the first stage of an evolutionary sequence, at whose end one finds compact, morphologically highly disturbed systems like NGC 6240 (Tecza et al. (2000)). This would require that the AGN lifetime is comparable to the time scale for the orbital decay ( yr, where is the black hole mass in units of , Binney & Tremaine (1987)).
Whatever its ultimate fate, the AGN pair in ESO509-IG066 is likely to be a gravitationally bound system. The condition on the minimum center-of-mass frame energy being (Mortlock et al. (1999)) implies a lower limit on the total mass of the system: . From the HST image, we estimate a bulge V luminosity of 8.7 and erg s-1 for the E and W source, respectively, corresponding to a total black hole mass (Magorrian et al. (1998)). This in turn translates into an estimated dark matter halo mass exceeding M⊙ (Ferrarese (2002)). Unfortunately, no other independent estimate of the supermassive black hole mass exists for ESO509-IG066, such as, for instance, those based on the [Oiii] line width or on stellar velocity dispersion measurements. The total AGN bolometric luminosity of the system is 8.4 erg s-1, if a standard ratio between the 1–10 keV and the bolometric luminosity is applied (Elvis et al. (1994)). Even if one assumes the most conservative prescription for the ratio between the galaxy circular and the halo virial velocities (Seljak (2002)), the inferred mass of the latter is sufficient to gravitationally bound the system if the active nuclei are on the average accreting at sub-Eddington rates (Ferrarese (2002)).
X-ray observations allow us to accurately probe the nuclear environment. With the caveat of the small sample, it is intriguing that all members of X-ray detected AGN pairs suffer some degrees of absorption, which in at least 50% of cases might be Compton-thick (Komossa et al. (2003); Ballo et al. (2004)). This may indicate that galaxy encounters are indeed effective in driving gas to the nuclear environment. If this is generally true, a certain number of AGN pairs might be missed by optical surveys due to obscuration of one of the members (or both), which leads to a wrong classification. These pairs could show up only in hard X-rays. ESO509-IG066 could be the prototype of a larger hidden population of binary QSOs, still to be discovered by deep high-resolution X-ray surveys.
Acknowledgements.
This paper is based on observations obtained with XMM-Newton, an ESA science mission with instruments and contributions directly funded by ESA Member States and the USA (NASA). This research has made use of the NASA/IPAC Extragalactic Database (NED) which is operated by the Jet Propulsion Laboratory, California Institute of Technology, under contract with the National Aeronautics and Space Administration. Useful comments by the referee, Dr. D.Grupe, are gratefully acknowledged.References
- Arp & Madore (1987) Arp H.C., Madore B.F., 1987, “A Catalog of Southern Peculiar Galaxies and Associations”, (Cambridge:Cambridge University Press)
- Ballo et al. (2004) Ballo L., Braito V., Della Ceca R., et al., 2004, ApJ, 600, 634
- Barnes & Hernquist (1992) Barnes J.E., Hernquist L., 1992, ARA&A, 30, 705
- Barnes & Hernquist (1996) Barnes J.E., Hernquist L., 1996 ApJ, 471, 115
- Bennett et al. (2003) Bennett C.L., et al., 2003, ApJS, 148, 1
- Binney & Tremaine (1987) Binney J, Tremaine S., 1987, “Galactic Dynamics”, (Princeton:Princeton University Press)
- Byrd et al. (1986) Byrd G.G., Valtonen M.J., Valtaoja L., Sundelius B., 1986, A&A, 166, 75
- de Robertis et al. (1998) de Robertis M.M., Yee H.K.C., Hayhoe K., 1998, ApJ, 496, 93
- Dickey & Lockman (1990) Dickey J.M., Lockman F.J., 1990, ARA&A 28, 215
- Elvis et al. (1994) Elvis M., Wilkes B.J., McDowell J.C., et al., 1994, ApJS, 95, 1
- Ferrarese (2002) Ferrarese L., 2002, ApJ, 578, 90
- Hernquist & Mihos (1995) Hernquist L., Mihos J.C., 1995, ApJ, 448,41
- Hewett et al. (1998) Hewett P.C., Foltz C.B., Harding M.E., Lewis G.F., 1998, AJ, 115, 383
- Ho et al. (2001) Ho L.C., Feigelson E.D., Townsley L.K., et al., 2001, ApJ, 549, L51
- Kauffmann et al. (2004) Kauffmann G., White S.D.M., Heckman T.M., et al., 2004, MNRAS, 352, 314
- Kochanek et al. (1999) Kochanek C.S., Falco E.E., Muñoz J.A., 1999, ApJ, 510, 590
- Komossa et al. (2003) Komossa S., Burwitz V., Hasinger G., et al., 2003, ApJ, 582, L15
- Kormendy et al. (1997) Kormendy J., Bender F., Magorrian J., et al., 1997, ApJ, 482, L139
- Laurikainen et al. (1994) Laurikainen E., Salo H., Teerikopi P., Petrov G., 1994, A&AS, 108, 491
- Magorrian et al. (1998) Magorrian J., Tremaine S., Richstone D., et al., AJ, 1998, 115, 2285
- Mortlock et al. (1999) Mortlock D.J., Webster R.L., Francis P.J., 1999, MNRAS, 836
- Muñoz et al. (1998) Muñoz J.A, Falco E.E., Kochanek C.S., et al., 1998, ApJ, 492, L9
- Polletta et al. (1996) Polletta M., Bassani L., Malaguti G., Palumbo G.C.C., Caroli E., 1996, ApJSS, 106, 399
- Protassov et al. (2002) Protassov R., van Dyk D.A., Connors A., Kashyap V.L., Siemiginowska A., 2002, ApJ, 571, 545
- Rafanelli et al. (1995) Rafanelli P., Violato M., Baruffolo A., 1995, AJ, 109, 1546
- Rees (1984) Rees M.J., 1984, ARA&A, 22, 471
- Risaliti (2002) Risaliti G., 2002, A&A, 386, 379
- Schmitt (2001) Schmitt H.R., 2001, AJ, 122, 2243
- Sekiguchi & Wolstencroft (1992) Sekiguchi K., Wolstencroft R.D., 1992, MNRAS, 255, 581
- Seljak (2002) Seljak U., 2002, MNRAS, 334, 797
- Silk & Rees (1998) Silk J., Rees M.J., 1998, A&A, 331, L1
- Strüder et al. (2001) Strüder L., Briel U., Dannerl K., et al., 2001, A&A 365, L18
- Taniguchi (1999) Taniguchi Y., 1999, ApJ, 522, 214
- Taniguchi & Wada (1996) Taniguchi Y., Wada K., 1996, ApJ, 469, 581
- Tecza et al. (2000) Tecza M., Genzel R., Tacconi L., et al., 2000, ApJ, 537, 178
- Terashima et al. (2002) Terashima Y., Iyomoto N., Ho L.C., Ptak A.F., 2002, ApJS, 139, 1
- Turner et al. (2001) Turner M.J.L., Abbey A., Arnaud M., et al., 2001, A&A 365, L27