Longitudinal Development of Extensive Air Showers:
Hybrid Code SENECA and Full Monte Carlo
Abstract
New experiments, exploring the ultra-high energy tail of the cosmic ray spectrum with unprecedented detail, are exerting a severe pressure on extensive air shower modeling. Detailed fast codes are in need in order to extract and understand the richness of information now available. Some hybrid simulation codes have been proposed recently to this effect (e.g., the combination of the traditional Monte Carlo scheme and system of cascade equations or pre-simulated air showers). In this context, we explore the potential of SENECA, an efficient hybrid tridimensional simulation code, as a valid practical alternative to full Monte Carlo simulations of extensive air showers generated by ultra-high energy cosmic rays. We extensively compare hybrid method with the traditional, but time consuming, full Monte Carlo code CORSIKA which is the de facto standard in the field. The hybrid scheme of the SENECA code is based on the simulation of each particle with the traditional Monte Carlo method at two steps of the shower development: the first step predicts the large fluctuations in the very first particle interactions at high energies while the second step provides a well detailed lateral distribution simulation of the final stages of the air shower. Both Monte Carlo simulation steps are connected by a cascade equation system which reproduces correctly the hadronic and electromagnetic longitudinal profile. We study the influence of this approach on the main longitudinal characteristics of proton-induced air showers and compare the predictions of the well known CORSIKA code using the QGSJET hadronic interaction model.
pacs:
96.40.Pq,96.40.-z,13.85.-tI Introduction
Since the very first observations, ultra-high energy cosmic rays (UHECR) have been an open question and a priority in astroparticle physics. Their origin, nature and possible acceleration mechanisms are still a mystery. In the last decades many experiments such as Volcano Ranch Linsley et al. (1961); Linsley (1963), Haverah Park Lawrence et al. (1991), Yakutsk Afanasiev et al. (1996), Fly’s Eye Baltrusaitis et al. (1988); Bird et al. (1995), HiRes Abu-Zayyad et al. (2000) and AGASA Chiba et al. (1992); Hayashida et al. (1994) have contributed for the study of UHECR’s, setting up the existence of such high energy particles. Shorty, the Pierre Auger Observatory will begin to explore them in unprecedented detail Blumer et al. (2003); Abraham et al. (2004).
Due to the very low flux of high energy cosmic rays, measuring extensive air showers (EAS) is the only possible technique to learn about the shape of the UHECR spectrum and their chemical composition. Two different ways have been historically applied to observe and analyze EAS’s: ground array of detectors and optical detectors. Surface detectors measure a lateral density sample and trigger in coincidence when charged particles pass through them. Optical detectors (i.e., fluorescence detectors) observe the longitudinal profile evolution by measuring the fluorescence light from atmospheric nitrogen excitation produced by the ionization of the secondary charged particles (essentially electrons and positrons). The combination of shower observables (such as lateral density, the depth of maximum shower development () and number of muons () at detector observation level) and simulation techniques is the current way to obtain information about the primary energy, composition and arrival direction. For this purpose the shower simulation should provide all possible, and ideally the necessary, information to interpret measurements of shower parameters. We suggest the reference Engel and Klages (2004) which is an interesting summary of experimental results from highest energy cosmic ray measurements, focused on data and analyzes that became available after 1999.
Many modern shower simulation packages have been developed over the years. Most of them are based on the Monte Carlo method and simulate complete high energy showers with well described fluctuations in the first particle interactions and realistic distributions of energy of shower particles. Unfortunately, the calculation of the gigantic showers induced by cosmic rays with energies above 1018 eV becomes a very difficult technical problem. This is due to the huge number of created secondary particles that have to be followed in the Monte Carlo method. As a consequence the direct simulation of the shower following each individual particle becomes practically impossible and the computation time takes too long.
Recently, different ways of calculating the air shower development have been proposed Bossard et al. (2001); Pierog et al. . Most of them combine the traditional Monte Carlo scheme with a system of electromagnetic and hadronic cascade equations. In a new one dimensional approach Alvarez-Muñiz et al. (2002) pre-simulated pion-induced showers are described with parametrizations and then are superimposed to pion and kaon particles after their first interaction points are simulated by the Monte Carlo method.
In the present work we analyze extensively the results obtained by the SENECA Drescher and Farrar (2003) code. The SENECA simulation approach is based on the Monte Carlo calculation of the first and final stages of the air shower development, and on a cascade equation system that connects both stages reproducing the longitudinal shower development. We explore mainly the fast air shower generation for different primary energies. As an application of this approach we investigate the main longitudinal shower characteristics of proton, iron nucleus and gamma initiated air showers up to ultra-high energy, as predicted by the QGSJET Kalmykov and Ostapchenko (1993); Kalmykov et al. (1997) hadronic interaction model. We compare SENECA results with the well tested CORSIKA (COsmic Ray SImulations for KAscade) simulation code Heck et al. (1998).
This paper is structured as follows. In Sec. II we briefly describe the hybrid approach and the air shower modelling. In Sec. III the method is applied to study the longitudinal development and the shower observables as well. Our main intention is to compare our predictions to calculations performed with the CORSIKA shower generator, in order to verify the stability of the hybrid code and the reliability of the its results, in the sense of being useful to several experimental applications. We have made several calculations for gamma, iron nucleus and proton initiated showers with different energy thresholds, using the thinning procedure for the Monte Carlo simulation scheme. Average and fluctuation values of and , their correlations and distributions are presented. The number of electrons () and muons () have been analyzed at different observation levels. Also, we show a comparison between CORSIKA and SENECA CPU time requirements for proton showers at different primary energies. Section IV summarizes our results.
II SENECA Approach and the air shower modelling
The main goal of this approach is the generation of EAS’s in a fast manner, obtaining the correct description of the fluctuations in showers and giving the average values for the shower characteristics. The detailed technical information about the SENECA package can be obtained in Drescher and Farrar (2003); Drescher . Even though the SENECA code describes both longitudinal and lateral air shower developments, the simulation scheme is used here to generate large statistics of longitudinal shower profiles applicable mainly to the present fluorescence detectors, such as Pierre Auger Observatory Cronin et al. (1995) and HiRes Abu-Zayyad et al. (2000, 2002), as well to the future telescope EUSO Catalano (2001).
For the present work we track explicitly every particle with energy above the fraction =, where is the primary shower energy, studying in detail the initial part of the shower. All secondary particles with energy below the mentioned fraction are taken as initial conditions to initialize a system of hadronic and electromagnetic cascade equations (see the suggested references). We use the cascade equations up to several minimum electromagnetic energy thresholds of 1, 3.16, 10, 31.6 and 100 GeV for the electromagnetic component () and = GeV for the hadronic component. Hadronic and electromagnetic particles with energies below the and are no longer treated by the cascade equations but traced again in the Monte Carlo scheme. The hadronic interactions at high energies are calculated with the QGSJET01 Kalmykov et al. (1997) model while the interactions at low energies with GHEISHA Fesefeldt (1985). The electromagnetic interactions are treated by the EGS4 Nelson et al. (1985) code. The adopted kinetic energy cutoffs for all simulations were 50 MeV (0.3 MeV) for hadrons and muons (electrons and positrons). The forementioned energy thresholds were chosen in order to verify qualitatively the dependence and performance of the cascade results, trying to minimize the CPU time without the introduction of significant errors. All SENECA simulations were performed with 1.2.2. version.
III Results and Comparisons
In this session we apply the SENECA simulation approach to generate gamma, iron nucleus and proton induced air showers at fixed primary energies and explore the longitudinal development. Although the simulation of showers at fixed energies is not a very realistic application we intend in the present work to compare quantitatively SENECA and CORSIKA results. One important reason for this comparison is to optimize the compromise between simulation time usage and accuracy in the description of fluctuations. In this particular case, such detailed study can be useful to many experiments which use the fluorescence technique.
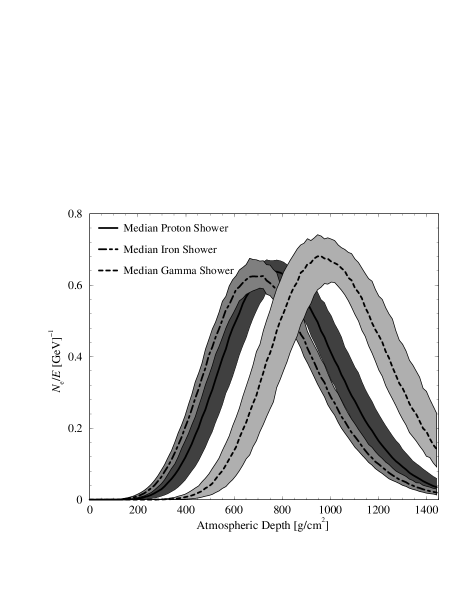
In Fig. 1 we illustrate individual longitudinal profiles generated by SENECA (hybrid approach) code. Displayed cases correspond to median longitudinal profile produced for 1,000 gamma (dashed), iron nucleus (dot-dashed) and proton (solid) induced showers at 1019 eV, at zenith angle = and free first interaction point. The shaded bands which follow each median line correspond to the upper limit of 68% of confidence level.
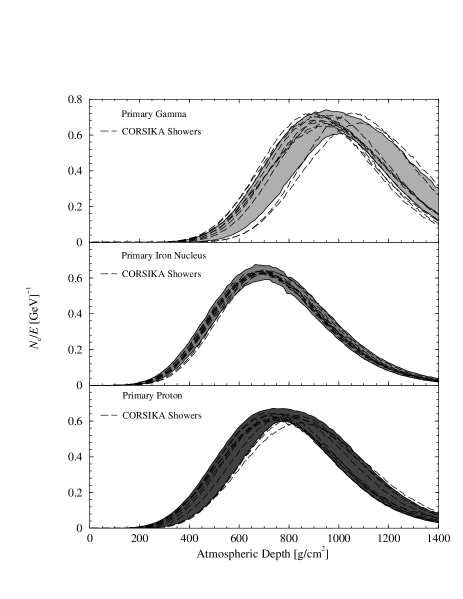
In order to make a simple comparison Fig. 2 illustrates the upper limit of 68% of confindence level for 1,000 SENECA profiles with 10 random showers simulated with CORSIKA. It is possible to see a very reasonable agreement among the several longitudinal profiles. In spite of that, we can verify that CORSIKA produces, apparently, more fluctuations related to individual proton and gamma air showers developments. All simulations performed by the CORSIKA code were obtained by using the thinning factor =10-6 and the same energy threshold of SENECA simulations, 0.3 MeV (50 MeV) for photons and electrons (hadrons and muons).
To analyze more carefully the longitudinal profiles produced with the hybrid approach, we illustrate in Fig. 3 the number of electrons-positrons generated by 1,000 proton initiated showers at energy of eV, with zenith angle 45∘, at arbitrary observation depths of (a) 200, (b) 400, (c) 600, (d) 800, (e) 1,000, and (f) 1,200 g/cm2. We compare the hybrid results (solid line) to the results obtained with CORSIKA (dashed line). The expected fluctuations due to very first proton interactions are reflected on panel (a) and (b), producing a difference of 4% and 3% between the distribution mean values. Panels (c) and (d) show discrepancies for the mean values of about 7% and 6%. In contrast to this, the discrepancies basically disapear at panels (e) and (f), both obtaining an agreement of about 99.5%. In all found discrepancies, SENECA produces more particles than CORSIKA. According to Drescher and Farrar (2003), some discrepancies are expected in the values produced for some shower quantities by the hybrid scheme and, apparently, are due to the combination of the used binning of discrete energy in the numerical solutions and the minimum energy threshold used for the electromagnetic cascade equations.
Such differences between the results of both codes at the first stages of the EAS development should not be crucial since depths around and after the shower maximum are the most important ones for all fluorescence experiments.

III.1 Analyses of influence of input parameters
on shower quantities
In order to verify the dependence of the SENECA results, as suggested by the SENECA authors, on the combination of used energy binning and minimum energy threshold () we have simulated air showers induced by gamma and proton primaries, with different initial conditions. Such primary particles have been chosen due to the different shower development in the atmosphere. The simulation development for gamma-induced showers deals mostly with the electromagnetic processes while the simulation development for proton (or any other hadron) showers deals with hadronic and electromagnetic processes. In other words, we are going to have different request of the cascade equation system for proton and gamma primary particles in the hybrid simulation.
III.1.1 Parameter
For the test with protons, 500 showers were generated of primary energy 1019 eV, with incident zenith angle of 45∘, calculated with the hybrid method using 30, 40 and 50 bins (10 bins) in the numerical solutions of electromagnetic (hadronic) cascades, and different minimum energy thresholds for the electromagnetic cascade equations = 1, 10 and 100 GeV. Following Drescher and Farrar (2003), we adopted = 104 GeV.

| 30 Bins | 40 Bins | 50 Bins | |||||
|---|---|---|---|---|---|---|---|
| () | () | () | |||||
| =1 GeV | 0.653 | (2.0810-2) | 0.655 | (2.7510-2) | 0.653 | (2.8510-2) | |
| =10 GeV | 0.651 | (2.7910-2) | 0.653 | (2.6110-2) | 0.654 | (2.5510-2) | |
| =100 GeV | 0.651 | (4.2710-2) | 0.654 | (4.0510-2) | 0.653 | (4.0910-2) | |
Fig. 4 shows the distribution of normalized by the primary energy in GeV, calculated with 500 primary protons by using 30 (panel a), 40 (panel b) and 50 (panel c) bins in the numerical solutions. The solid, dashed and dot-dashed lines correspond to = 1, 10 and 100 GeV, respectively, while the thick solid line refers to the distribution obtained with the CORSIKA code.
Although we have modified the inputs for the SENECA simulations, the average values of do not vary significantly and are in total agreement (99% on the average) with the average obtained with the CORSIKA shower generator. However, it is possible to verify in Fig. 4 that the distributions for the hybrid code are visibly wider for the minimum energy threshold values of 10 and 100 GeV, when compared to CORSIKA, showing a different behaviour for the fluctuations in both codes. Besides, such fluctuation description changes dramatically the characteristic asymmetrical shape of the distribution. The average (fluctuation) values of calculated with the hybrid scheme are presented in Table 1 and correspond to the distributions illustrated in Fig. 4. The average value obtained with the CORSIKA code is 0.646 while the width distribution is 2.0610-2.

Such fluctuation descriptions for the minimum electromagnetic energy threshold values of 10 and 100 GeV can clearly be seen as very strong dependence of shower quantities on initial parameters and are much larger when compared to the standard deviation value predicted by the CORSIKA code. One equally important aspect is that we have verified the dependence of quantities on higher values of , while Drescher and Farrar (2003) expects the dependences on lower values.
The same unsual fluctuation description for can also be visualized in Fig. 5, which shows the distribution calculated with primary gammas by using 30 bins as input value in the numerical solutions. The thick solid line refers to the distribution obtained with the CORSIKA code. The average (sigma) values obtained from SENECA are 0.7 (4.10-2), 0.698 (4.0210-2) and 0.694 (7.7910-2), for = 1, 10 and 100 GeV, respectively. The CORSIKA predicts the average distribution value of 0.694 and the width distribution of 4.7410-2.
Hence, these checks basically verify that, apparently, the minimum electromagnetic energy thresholds of 10 and 100 GeV may produce artificial fluctuations on . Moreover, such fluctuation description can introduce statistical errors on analyses of event-to-event and could be possible critics in pratical applications of SENECA in fluorescence event reconstruction.
The increase in fluctuations with increasing , is difficult to understand since the larger the , the greater the weighted of the Monte Carlo portion of the hybrid scheme.
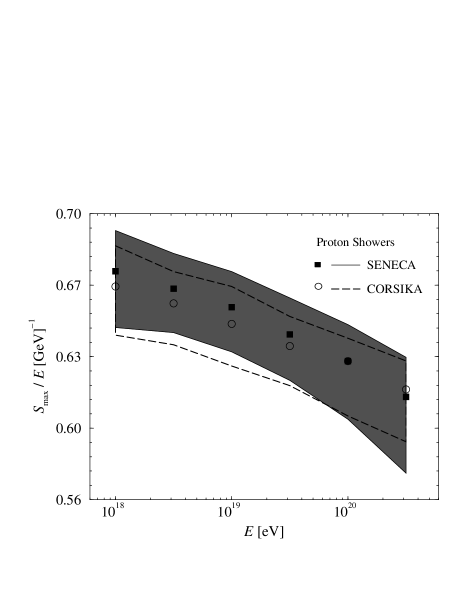
Fig. 6 shows the median shower size values, normalized by the primary energy in GeV, at the depth of shower maximum. Each band contains 68% of confidence level and is related to proton initiated showers as a function of primary energy (1018 eV). The solid (dashed) line illustrates the predictions of the SENECA technique (CORSIKA), using the QGSJET01 model. We have used = 1 GeV and 30 bins of discrete energy as the input SENECA parameters.
The values predicted by both codes have a visible agreement ( 99%). SENECA tends to produce systematically higher values of than CORSIKA, up to 1019.5 eV, and lower values for energies 1020 eV. Also, it seems that SENECA produces more fluctuations related to smaller shower sizes at energies around 1020 eV.
III.1.2 Parameter
As discussed in Sec. I, fluorescence detectors observe the longitudinal profile evolution by measuring the fluorescence light. The greatest advantage of this technique is that it allows the estimation of the number of charged particles as a function of depth in the atmosphere, from the measured

data Song et al. (2000); Baltrusaitis et al. (1985); Barbosa et al. (2003); Alvarez-Muñiz et al. (2004), which makes possible, in turn, the estimation of the depth of maximum development of the shower, .


In principle, obtaining the values of and/or , by the fluorescence technique, and their respective fluctuations, by Monte Carlo, one should be able to reconstruct the shower energy and infer the identity of the primary cosmic ray Alvarez-Muñiz et al. (2004); Cronin et al. (1995). Fig.7 illustrates the potential of the distribution, generated with the hybrid scheme, to distinguish possible primary signatures, as calculated using SENECA.
We have also checked the behaviour of average values for gamma, iron nucleus and proton induced air shower.
Fig. 8 shows the average depth (bottom panel) and fluctuation (top panel) values of shower maximum () for the energy range of 1018-1020.5 eV, with incident zenith angle of . All simulations performed in this plot were generated with the QGSJET01 hadronic interaction model. The long-dashed line represents 500 showers induced by gamma (diamond), iron nucleus (square) and proton (circle) primaries at each energy generated by SENECA. The CORSIKA predictions correspond to 100 simulated showers and are represented by solid lines and full symbols Heck (2004). Only in Fig. 8 the CORSIKA results obtained for gamma showers were generated by using the PRESHOWER code. All other CORSIKA simulations in the present work were calculated without the PRESHOWER code.

The values predicted by both codes are in very good agreement, showing almost identical values for and fluctuations, for all primary particles. One interesting aspect to be mentioned is the strong influence of the geomagnetic field on depth of maximum development in gamma showers, generated by CORSIKA code Heck (2004) implemented with the PRESHOWER program Homola et al. (2004a), at energies above 1020 eV. The gomagnetic field decelerates the air gamma shower development, modifying the depth in which occurs the maximum development. The average (fluctuation) value of decreases from 1,213 (314) g/cm2 at 1020 eV to 990 (35) g/cm2 at 1020.5 eV. Altough we have considered the geomagnetic field in our simulations, it seems that SENECA do not consider the interaction of ultra high energy photons with the Earth’s geomagnetic field before entering the Earth’s atmosphere. Such effect absence produces the discrepancy seen in gamma curves at energies above and around 1020 eV. References Homola et al. (2004b); Risse et al. (2004) discuss very high energy gamma showers.
Fig. 9 confirms the strength of the agreement by showing the distribution of values, produced by 500 proton showers, for the particular primary energy eV, with incident zenith angle of 45∘, calculated with SENECA and CORSIKA (thick solid line) codes and QGSJET01 hadronic interaction model. We used the same input parameters for SENECA as in Fig. 4. The mean (fluctuation) values calculated with the hybrid scheme are presented in Table 2. These values are in total agreement with CORSIKA values, =774 g/cm2 (=65 g/cm2), and show, apparently, that the influence of minimum energy threshold and binning of discrete energy on values is negligible in hadron initiated showers.
| 30 Bins | 40 Bins | 50 Bins | |||||
|---|---|---|---|---|---|---|---|
| () | () | () | |||||
| =1 GeV | 778 | (65) | 775 | (63) | 776 | (64) | |
| =10 GeV | 775 | (62) | 772 | (61) | 774 | (65) | |
| =100 GeV | 774 | (69) | 771 | (66) | 777 | (70) | |
We have made the same verification for gamma showers in Fig. 10 and we verify that CORSIKA and SENECA distributions are in good agreement. SENECA predicts the average (fluctuation) distribution values of 981 g/cm2 (81 g/cm2), 989 g/cm2 (85 g/cm2) and 985 g/cm2 (101 g/cm2), for minimum electromagnetic energy thresholds of 1, 10 and 100 GeV, respectively. CORSIKA code, without PRESHOWER, produces the average and width distribution values of 976 g/cm2 and 97 g/cm2, respectively. Due to the extreme fluctuations in shower development induced by primary gammas, which affect directly the position of shower maximum development, the average and fluctuation results obtained by SENECA seem to be reasonable, in spite of the fact that again the fluctuation values increase with the electromagnetic minimum energy thresholds of 10 and 100 GeV, over those of CORSIKA.
III.1.3 - Correlation
We also analyzed the correlation between and , which are important longitudinal shower quantities on event reconstruction. We compared SENECA results with CORSIKA predictions for gamma and proton induced air shower.
Fig. 11 shows the correlation between these parameters for both simulation schemes. We simulated 500 gamma showers for each code, of energy 1019 eV, incident zenith angle =45∘ and free first interaction point. Hybrid results are shown for minimum energy thresholds = 1 (crosses) and 100 GeV (squares), and 30 bins of discrete energy in the numerical solutions. The full circles denote the corresponding values for CORSIKA. It is possible to verify the existence of large fluctuations in gamma air showers at this particular primary energy.
The small box in the figure encloses, approximately, the highest density of correlation points for both codes: 61% and 59% of the total number of events simulated by SENECA, for = 1 and 100 GeV, respectively, and 64% of the total showers generated with CORSIKA.
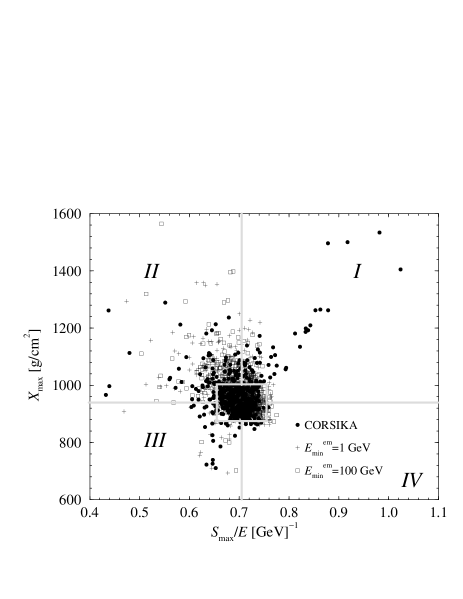


The number of gamma showers predicted by SENECA and CORSIKA vary considerably from one quadrant to another in Fig. 11, indicating qualitative and quantitative differences in the character of the fluctuations in both codes.
The fractions of events inside regions I, II, III and IV (see the figure) are, respectively, 10% (10%), 24% (27%), 3% (2%) and 2% (2%), for the minimum energy threshold of 1 (100) GeV. In the same regions, the corresponding CORSIKA fractions are 11%, 17%, 6% and 2%.
Notoriously, CORSIKA shows in region I a particular structure related to maximum depth development (940 g/cm2) of particularly large showers (/0.705). Such structure is absent in SENECA.
On the other hand, the hybrid scheme predicts a significantly number of ordinary and small showers in region II (118 and 137 showers for = 1 and 100 GeV, respectively), which achieve higher values for the depth of maximum development, a behavior that is not as strong in CORSIKA (84 showers).
The same kind of comparison is presented in Fig. 12 for proton showers. The same input parameters as in the previous figure were used to simulate the three sets of 500 proton showers each displayed in Fig. 11.
It is apparent from the figure that the hybrid approach generates a more scattered distribution of showers, with wider tales, than CORSIKA does.
This is confirmed by counting the number of events inside the small box shown in the figure. SENECA expectation amounts to 80% (69%) of the proton showers falling inside the box for = 1 and 100 GeV, while CORSIKA expectation is 85%.

We can verify in SENECA predictions that the input parameter =100 GeV produces larger fluctuations related to proton shower size (), describing a sort of symetrical distribution of events outside the box. The standard deviation of proton shower size, obtained for this particular input parameter in SENECA, is 3.6210-2 while the corresponding value for CORSIKA is 1.8910-2. Such symetrical statement is confirmed in Fig. 4.
Figs. 13 and 14 illustrate the dependence of the average values, and their fluctuation, of and on input parameters of electromagnetic cascade equations solved in SENECA scheme. We have generated 1,000 proton showers, at primary energy eV and zenith angle , using 30, 40 and 50 bins of possible discrete energy for each minimum energy threshold; total of 15,000 simulated events. As it has been noted in top panel of Fig. 13, the average values produced by SENECA are in perfect agreement (99% for both quantities) with the corresponding results obtained from CORSIKA (thick solid line).
However, Fig. 14 shows that the fluctuations related to (top panel) have large discrepancies for a minimum electromagnetic energy threshold of 100 GeV. In this case, there is more than a factor of 2 between SENECA and CORSIKA expected fluctuation levels (, averaged over number of bins, vs. in the case of CORSIKA).
On average, the discrepancies in between SENECA and CORSIKA decrease systematically at progressively lower values of .
Even if fluctuations in can be up to 8% larger in SENECA than in CORSIKA (for =100GeV) this discrepancy is of small practical relevance when translated into units of depth (i.e., in g/cm2).
III.1.4 - Number of muons
To ensure the consistency of other longitudinal shower components in SENECA, we have also compared the number of muons produced by both SENECA and CORSIKA codes.
Fig. 15 shows the muon component for 1,000 proton initiated showers at energy of eV and incident zenith angle of 45∘, at observation depths of (a) 200, (b) 400, (c) 600, (d) 800, (e) 1,000, and (f) 1,200 g/cm2. As we can seen, both distribution agree very well. The average number of muons are very similar ( 99% of coincidence) when related to the first stages of shower development, panels (a), (b) and (c). At the same time, discrepancies become greater with depths closer to the sea level, but are on average less than % (2% at 800 g/cm2, 3.6% at 1,000 g/cm2 and 3.3% at 1,200 g/cm2). Such small discrepancies can be considered negligible, because they are undetectable to any experiment which measures the correlated number of particles. Furthermore, the fluctuations (width distribution) corresponding to each panel agree well with those predicted in CORSIKA code. Consequently, the muon distributions seem to be well described in the hybrid scheme when compared to the CORSIKA ones.

III.1.5 Processing time consumption
As a final comparison, we show in Table 3 the impressive numbers related to the rate of time-consumption () between the CORSIKA and SENECA codes. All simulations generated with CORSIKA were obtained by using the thinning factor 10-6.
In order to compare the time-consuming of the hybrid method, by using the thinning procedure in the Monte Carlo calculation, we have generated air showers with thinning level of 10-6 for the Monte Carlo scheme.
In Table 3, Rate-1 refers to the hybrid simulations without the thinning procedure while Rate-2 considers the SENECA simulations by using the thinning procedure with thinning level of 10-6 in the Monte Carlo scheme.
| [eV] | Rate-1 | Rate-2 |
|---|---|---|
| 17.0 | 3 | 13 |
| 17.5 | 3 | 13 |
| 18.0 | 4 | 15 |
| 18.5 | 5 | 16 |
| 19.0 | 7 | 20 |
| 19.5 | 11 | 28 |
| 20.0 | 20 | 46 |
| 20.5 | 35 | 74 |
IV Discussion and conclusions
In the present work we analyzed the practical potential of SENECA, a very fast hybrid tri-dimensional code, for the simulation of the longitudinal development of extensive air showers at high energies. We take as reference the well known and extensively tested CORSIKA code, which is based on a much slower, but highly reliable, full Monte Carlo simulation. The QGSJET01 hadronic interaction model is used throughout the paper for both codes.
Although a careful analysis of many shower quantities discussed here is strongly model dependent, we are confident that the present study is able to show the potential and limitations of SENECA, in its present version, for a practical application to the analysis of fluorescence data on ultra-high energy cosmic rays.
The consistency of the SENECA scheme was tested and it proved to be very stable for energies above eV. The results obtained by both codes agree well with negligible discrepancies for most quantities analyzed.
Apparently, minimum electromagnetic energy threshold values of 10 and 100 GeV may produce artificial fluctuations on shower quantity. These could be responsible for the introduction of systematic errors on the analysis of isolated events and should be taken into account when applying SENECA to fluorescence reconstruction.
In any case, the undisputable bounty of SENECA is velocity. The rates of processing time-consumption between CORSIKA and SENECA are, to say the least, impressive over the wide range of primary shower energy tested here.
Finally, as a word of caution, special attention must be paid to the selection of the several input parameters of SENECA in practical applications, since they may affect the results in a non-trivial and somehow unpredictable way.
Acknowledgments The authors acknowledge Hans-Joachim Drescher and Glennys Farrar for making SENECA code available to the cosmic ray academic community. We are indebted to Dieter Heck for providing us with the values of for CORSIKA. J.A.Ortiz is supported by CNPq/Brazil, G.M.T. by FAPESP and CNPq and L.V. Souza by FAPESP. Most of the simulations presented here were carried on a Cluster Linux TDI (32 Dual Xeon 2.8 GHz, 2GBytes RAM nodes), supported by Laboratório de Computação Científica Avançada at Universidade de São Paulo.
References
- Linsley et al. (1961) J. Linsley, L. Scarsi, and B. Rossi, Phys. Rev. Lett. 6, 458 (1961).
- Linsley (1963) J. Linsley, Phys. Rev. Lett. 34, 146 (1963).
- Lawrence et al. (1991) M. A. Lawrence, R. J. O. Reid, and A. A. Watson, J. Phys. G 17, 733 (1991).
- Afanasiev et al. (1996) B. Afanasiev et al., in Proceedings of the the International Symposium on Extremely High Energy Cosmic Rays: Astrophysics and Future Observatories, edited by M. Nagano (Institute for Cosmic Ray Research, University of Tokyo, Tokyo, Japan, 1996), p. 32.
- Baltrusaitis et al. (1988) R. M. Baltrusaitis et al., Nucl. Instrum. Meth. Phys. Res. A 264, 87 (1988).
- Bird et al. (1995) D. J. Bird et al., Astrophys. J. 441, 144 (1995).
- Abu-Zayyad et al. (2000) HiRes Collaboration, T. Abu-Zayyad et al., Nucl. Instrum. Meth. Phys. Res. A 450, 253 (2000).
- Chiba et al. (1992) N. Chiba et al., Nucl. Instrum. Methods Phys. Res. A 311, 338 (1992).
- Hayashida et al. (1994) N. Hayashida et al., Phys. Rev. Lett. 73, 3491 (1994).
- Blumer et al. (2003) Pierre Auger Collaboration, J. Blumer et al., J. Phys. G: Nucl. Part. Phys. 29, 867 (2003).
- Abraham et al. (2004) Pierre Auger Collaboration, J. Abraham et al., Nucl. Instrum. Meth. Phys. Res. A 523, 50 (2004).
- Engel and Klages (2004) R. Engel and H. Klages, C. R. Physique 5, 505 (2004).
- Bossard et al. (2001) G. Bossard et al., Phys. Rev. D 63, 054030 (2001).
- (14) T. Pierog et al., astro-ph/0411260.
- Alvarez-Muñiz et al. (2002) J. Alvarez-Muñiz et al., Phys. Rev. D 66, 033011 (2002).
- Drescher and Farrar (2003) H. J. Drescher and G. R. Farrar, Phys. Rev. D 67, 116001 (2003).
- Kalmykov and Ostapchenko (1993) N. N. Kalmykov and S. S. Ostapchenko, Phys. At. Nucl. 56, 346 (1993).
- Kalmykov et al. (1997) N. N. Kalmykov, S. S. Ostapchenko, and A. I. Pavlov, Nucl. Phys. B (Proc. Suppl.) 52B, 17 (1997).
- Heck et al. (1998) D. Heck, J. Knapp, J. N. Capdevielle, G. Schatz, and T. Thouw, Report FZKA 6019 (1998).
- (20) H. J. Drescher, astro-ph/0411144.
- Cronin et al. (1995) J. Cronin et al., The Pierre Auger Project design report 2nd ed., available at Auger website www.auger.org (1995).
- Abu-Zayyad et al. (2002) HiRes Collaboration, T. Abu-Zayyad et al. astro-ph/0208301.
- Catalano (2001) O. Catalano, Nuovo Cim. 24C, 445 (2001).
- Fesefeldt (1985) H. Fesefeldt, PITHA 85/02, RWTH Aachen (1985).
- Nelson et al. (1985) W. Nelson et al., SLAC-265, Stanford Linear Accelerator Center (1985).
- Song et al. (2000) C. Song et al., Astropart. Phys. 14, 7 (2000).
- Baltrusaitis et al. (1985) R. M. Baltrusaitis et al., Nucl. Instrum. Meth. Phys. Res. A 240, 410 (1985).
- Alvarez-Muñiz et al. (2004) J. Alvarez-Muñiz et al., Phys. Rev. D 69, 103003 (2004).
- Barbosa et al. (2003) H. M. J. Barbosa, F. Catalani, J. A. Chinellato, and C. Dobrigkeit, astro-ph/0310234.
- Heck (2004) D. Heck, (private communication).
- Homola et al. (2004a) P. Homola et al., astro-ph/0311442.
- Homola et al. (2004b) P. Homola et al., Acta Phys. Polon. B 35, 1893 (2004b).
- Risse et al. (2004) M. Risse et al., Astropart.Phys. 21, 479 (2004).