Symmetry of the Neutron and Proton Superfluidity Effects in Cooling Neutron Stars
Abstract
We investigate the combined effect of neutron and proton superfluidities on the cooling of neutron stars whose cores consist of nucleons and electrons. We consider singlet-state pairing of protons and triplet-state pairing of neutrons in the cores of neutron stars. The critical superfluid temperatures are assumed to depend on the density of matter. We study two types of neutron pairing with different components of the total angular momentum of Cooper pairs along the quantization axis ( =0 or 2). Our calculations are compared with observations of thermal emission from isolated neutron stars. We show that the observations can be interpreted by using two classes of superfluidity models: (1) strong proton superfluidity with a maximum critical temperature in the stellar core K and weak neutron superfluidity of any type ( K); (2) strong neutron superfluidity (pairing with =0) and weak proton superfluidity. The two types of models reflect an approximate symmetry with respect to an interchange of the critical temperatures of neutron and proton pairing.
1 Introduction
At present, the properties of superdense matter in the cores of neutron stars are known poorly. For example, the fundamental problem of the equation of state for matter of supranuclear density has not yet been solved. The existing calculations are model dependent and yield a variety of equations of state in the cores of neutron stars (Lattimer and Prakash 2001; Haensel 2003) with different compositions of this matter (nucleons, hyperons, pion or kaon condensates, quarks). The properties of nucleon superfluidity in the inner layers of neutron stars are also unclear. Calculated critical temperatures of nucleon superfluidity strongly depend on the nucleon-nucleon interaction model used and on the method of allowance for many-body effects (see, e.g., Lombardo and Schulze 2001). However, they can be studied by comparing the cooling theory of neutron stars with observations of thermal emission from isolated neutron stars. Here, we continue to simulate the cooling of superfluid neutron stars whose cores contain neutrons, protons, and electrons, with critical temperatures of nucleon superfluidity depending on the density of matter.
We extend the class of cooling models that were proposed by Kaminker et al. (2001, 2002) and Yakovlev et al. (2001a, 2002) to interpret observations of thermal emission from isolated neutron stars. These authors paid special attention to the case of strong proton superfluidity and weak neutron superfluidity in the stellar core. Because superfluidity models have a large uncertainty, we consider a broader class of models without assuming from the outset that proton pairing is stronger than neutron pairing. In addition, attention is given to the model of nonstandard neutron triplet-state pairing with an anisotropic gap that vanishes along the quantization axis.
2 Observational data
The observational data on thermal emission from eleven isolated middle-aged ( yr) neutron stars are collected in Table. In what follows, is the stellar surface temperature as detected by a distant observer, and is the stellar age. The data differ from those presented previously (see, e.g., Yakovlev et al. 2002), because they include the results of new observations.
Two young objects, RX J0822–4300 and 1E 1207.4–5209 (=J1210–5226), are radio-quiet neutron stars in supernova remnants. Two of the three oldest objects ( yr), RX J1856.4–3754 and RX J0720.4–3125, are also radio-quiet neutron stars. The remaining seven sources — PSR J0205+6449, the Crab pulsar (PSR B0531+21), the Vela pulsar (PSR B0833–45), PSR B1706–44, PSR J0538+2817, Geminga (PSR B0633+1746), and PSR B1055–52 — are observed as radio pulsars.
PSR J0205+6449 and the Crab pulsar are located in the remnants of historical supernovae; their ages are known exactly.
The age of RX J0822–4300 was determined from the age of the remnant of the host supernova Puppis A and lies within the range yr (see, e.g., Arendt et al. 1991), with the most probable value yr (Winkler et al. 1988).
The age of 1E 1207.4–5209 is assumed to be equal to the age of the remnant of the host supernova G296.5+10. According to Roger et al. (1988), this age ranges from yr to yr.
The age of the Vela pulsar is assumed to lie within the range from the standard characteristic pulsar age of yr to the age of yr, obtained by Lyne et al. (1996) by analyzing the pulsar spindown with allowance for observed pulsar glitches.
Kramer et al. (2003) estimated the age of PSR J0538+2817, kyr, from the measured proper motion of the neutron star relative to the center of the remnant of the host supernova S147.
The age of RX J1856.4–3754 was estimated by Walter (2001) from kinematic considerations and revised by Walter and Lattimer (2002). Following the latter authors, we take a mean value of yr and choose an errorbar for that excludes the value of yr obtained by Walter (2001).
Zane et al. (2002) and Kaplan et al. (2002) estimated the characteristic age of RX J0720.4–3125 from X-ray measurements of the spindown rate of the star . We take a mean value of yr with an uncertainty by a factor of 2.
The ages of the three radio pulsars — PSR B1706–44, Geminga, and PSR B1055–52 — are set equal to their characteristic ages with the same uncertainty factor of 2.
| Source | t | Mo- | Confi- | References | |
|---|---|---|---|---|---|
| [ yr] | [ K] | del a) | dence | ||
| PSR J0205+6449 | 0.82 | 1.1 | bb | – | Slane et al. (2002) |
| Crab | 1 | 2.0 | bb | 99.7 | Weisskopf et al. (2004) |
| RX J0822–4300 | 2–5 | 1.6–1.9 | H | 90% | Zavlin et al. (1999) |
| 1E 1207.4–5209 | 3–20 | 1.4–1.9 | H | 90% | Zavlin et al. (2003) |
| Vela | 11–25 | 0.65–0.71 | H | 68% | Pavlov et al. (2001) |
| PSR B1706–44 | H | McGowan et al. (2004) | |||
| PSR J0538+2817 | H | – | Zavlin, Pavlov (2003) | ||
| Geminga | bb | 90% | Zavlin, Pavlov (2003) | ||
| RX J1856.4–3754 | 0.65 | bb | – | see text | |
| PSR B1055–52 | bb | – | Pavlov, Zavlin (2003) | ||
| RX J0720.4–3125 | H | – | Motch et al. (2003) |
| Observations interpreted in terms of either a hydrogen atmosphere model (H) |
| or the blackbody model (bb) |
For the two youngest objects (the Crab pulsar and PSR J0205+6449), only upper limits were placed on (Weisskopf et al. 2004; Slane et al. 2002). The surface temperatures of five sources — RX J0822–4300, 1E 1207.4–5209, Vela, PSR B1706–44, and PSR J0538+2817 — were determined by using neutron-star hydrogen atmosphere models (for references, see Table). These models give more realistic neutron star radii and hydrogen column densities (see, e.g., Pavlov et al. 2002) than the blackbody model.
The pulsar PSR B0656+14 that was considered previously (see, e.g., Yakovlev et al. 2002) is excluded from Table. A simultaneous analysis of new X-ray and optical observations of the source (with the improved distance to it obtained from the parallax measurements by Brisken et al. 2003) leads either to an overly small neutron-star radius (in the blackbody model) or to an overly small distance to the star (in the hydrogen atmosphere model); see Zavlin and Pavlov (2003). This makes the interpretation of thermal emission of the source too unreliable.
For Geminga and PSR B1055–52, the blackbody model is more self-consistent. Therefore, we take the values of obtained by interpreting the observed spectra using this model. For PSR B1055–52, we take from Pavlov and Zavlin (2003).
The surface temperature of RX J1856.4–3754 has not been determined accurately enough. The wide spread in obtained for different radiation models (see, e.g., Pons et al. 2002; Braje and Romani 2002; Burwitz et al. 2003; Pavlov and Zavlin 2003; Trümper et al. 2003) stems from the fact that optical and X-ray observations cannot be described by a single blackbody model. This may be attributed, for example, to the presence of hot spots on the stellar surface. Therefore, we fix only the upper limit of K that agrees with the value of obtained in the model of a Si-ash atmosphere (Pons et al. 2002) and in the model of condensed matter on the stellar surface (Burwitz et al. 2003). This limit is consistent also with the model of a nonuniform stellar surface temperature distribution proposed by Pavlov and Zavlin (2003). For the latter model, the mean stellar surface temperature is K and lies below the chosen upper limit.
Finally, we take the surface temperature of RX J0720.4–3125 from the paper by Motch et al. (2003). These authors interpreted the observed spectrum using an hydrogen atmosphere model of finite depth.
For PSR J0538–4300, PSR B1055–52, and RX J0720–3125, the errors in were not given by the authors (see Table). In all these cases, we assume them to be equal to 20.
3 Models for nucleon superfluidity and neutrino emission due to Cooper pairing of protons
Neutron or proton superfluidity can be characterized by the critical temperature as a function of density, . Microscopic theories predict (see, e.g., Lombardo and Schulze 2001; for references, see also the review by Yakovlev et al. 1999a) the existence of singlet-state () neutron pairing () in the inner crust and the outermost layers of the stellar core and singlet-state proton pairing () and triplet-state () neutron pairing () in the stellar core. One should bear in mind the possibility of different components of momentum of neutron-neutron pairs with respect to the quantization axis (=0, 1, 2) when triplet-state pairing is considered. A superposition of states with different can also be an energetically favored state of Cooper pairs (see, e.g., Amundsen and Ostgaard 1985; Baldo et al. 1992; Khodel et al. 1998, 2001). Only one type of triplet-state superfluidity with has commonly been assumed in calculations of neutron star cooling (except for the papers by Schaab et al. 1998, and Gusakov and Gnedin 2002). Below, we consider triplet-state pairing of neutrons with 0 and 2, because the effects of these two types of superfluidity on the heat capacity and the neutrino luminosity of neutron stars are qualitatively different. Following Yakovlev et al. (1999a), we denote the three types of superfluidity considered here – , (), and () — by the letters A, B, and C, respectively. The energy gap in the neutron energy spectrum, , is isotropic in case A and anisotropic in cases B and C (i.e., it depends on the angle between the particle momentum p and the quantization axis ). In case C, the energy gap vanishes in the directions parallel and antiparallel to the axis.
Nucleon superfluidity suppresses the neutrino processes involving nucleons, changes the nucleon heat capacity, and triggers an additional neutrino emission mechanism related to Cooper pairing of nucleons (Flowers et al. 1976). The effect of neutron superfluidity C on the heat capacity of the matter and the neutrino reactions differs qualitatively from the effect of superfluidity A or B. For example, the suppression of the neutrino processes and the heat capacity by superfluidity C and superfluidity B or A has power-law and exponential character, respectively (see, e.g., Yakovlev et al. 1999a).
Microscopic theories predict a variety of profiles (see, e.g., Lombardo and Schulze 2001). The peaks of can take on values from K to K. In many models, the peaks of are lower than the peaks of and , because of weaker nucleon-nucleon attraction in triplet-state channels.
We use four phenomenological model profiles of critical temperature (for both, neutrons and protons) in the core of a neutron star. In Fig. 1, these models are denoted by a, b, c, and d. The chosen profiles are similar and differ only in height (maximum value): , , , and K (models a, b, c, and d). Superfluidities a, b, c, and d will be called strong, moderately strong, moderate, and weak, respectively. The chosen models are consistent with theoretical calculations of . The curves have steep slopes at , where is the threshold density at which the direct Urca process is open (see below).

Below, we will denote combined nucleon superfluidity by , where is one of neutron triplet-state (type B or C) superfluidity models (a, b, c, or d), and is one of proton singlet-state superfluidity models (a, b, c, or d).
Note a large uncertainty in the neutrino emissivity due to Cooper pairing of protons. In the non-relativistic approximation (Yakovlev et al. 1999b), , where , and is the vector constant of neutral current of protons; the latter constant is numerically small and leads to unreasonably low values of . For comparison, the neutrino emissivity due to triplet-state pairing of neutrons is proportional to , where and are the vector and axial vector constants of neutral neutron current, respectively. According to Kaminker et al. (1999), the inclusion of the relativistic correction that contains the axial vector constant of neutron current of protons can greatly (by a factor of 10 to 50) increase the constant (and the emissivity ) compared to the non-relativistic value of .
We used this value of , enhanced by relativistic effects, in our previous simulations of neutron star cooling. On the other hand, while studying the cooling of stars with density dependent critical temperatures of protons (see, e.g., Kaminker et al. 2002), we restricted ourselves to the models for strong proton superfluidity (similar to model a). Such a superfluidity arises at early cooling stages. At these stages, the neutrino emission due to proton pairing cannot compete with other neutrino processes and plays no special role. In a cooler star, this neutrino emission is generated only in a small volume and weakly affects the cooling. Thus, in the cooling scenarios with strong proton superfluidity, considered previously, the emission due to Cooper pairing of protons was unimportant (as well as the exact value of ).
In this paper, we consider (among others) models of moderate proton superfluidity in which the emission due to proton pairing can appreciably affect the cooling, so that the value of is important. As noted, for instance, by Yakovlev et al. (1999b) and Kaminker et al. (1999), the constant can be affected not only by relativistic effects, but also by renormalization due to many-body effects in nucleon matter. This renormalization for the process in question has not yet been performed. Carter and Prakash (2002) gave an example of a similar renormalization of the constant of the axial vector current. For the sake of definiteness, we perform calculations by choosing the renormalized value of . The sensitivity of our calculations to the value of is described in Section 5.3 (also see Fig. 7).
4 Cooling of stars with strong proton superfluidity
Let us compare the observational data with our calculated cooling curves ( profiles). The calculations were performed using a code described by Gnedin et al. (2001). As in previous papers (mentioned in the introduction), we consider the models of neutron stars whose cores are composed of neutrons n, protons p, and electrons e. We use a moderately stiff equation of state in the stellar core proposed by Prakash et al. (1988) (model I with the compression modulus of symmetric nucleon matter at saturation = 240 MeV). The maximum mass of a stable neutron star, for the chosen equation of state, is (at a radius of km and a central density of g cm-3). This equation of state opens the intense direct Urca process of neutrino emission (Lattimer et al. 1991) at densities above the threshold density g cm-3, i.e., in stars with masses . The radius of a star with the threshold mass is km.
The thermal evolution of a neutron star consists of three stages:
(1) the stage of thermal relaxation of the inner stellar layers ( yr);
(2) the subsequent stage of neutrino cooling ( yr) of a star with an isothermal core via neutrino emission from the inner layers (mainly from the core);
(3) the final stage of photon cooling ( yr) via photon emission from the stellar surface.
The cooling theory for non-superfluid stars cannot explain the entire set of observational data (see, e.g., Kaminker et al. 2002). However, the theory can be reconciled with the observations by taking into account nucleon superfluidity. According to Kaminker et al. (2001), it is sufficient to assume the presence of strong proton superfluidity and weak neutron superfluidity in stellar cores.
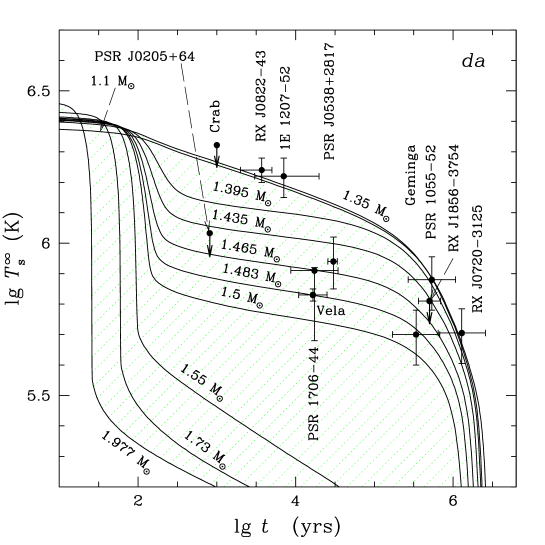
Figure 2 shows cooling curves for neutron stars of different masses with weak neutron superfluidity d and strong proton superfluidity a. Such weak neutron superfluidity switches on only at the photon cooling stage. Therefore, the type of weak neutron superfluidity (B or C) does not affect the cooling of middle-aged stars. The family of cooling curves for stars with masses fill in the hatched region. All of the observed sources fall within this region; i.e., they can be interpreted in terms of the assumed superfluidity model.
As shown Kaminker et al. (2002), strong proton superfluidity (with weak neutron superfluidity or with normal neutrons) gives rise to three types of cooling neutron stars.
Low-mass stars cool down very slowly (more slowly than low-mass non-superfluid stars). Cooling curves for such stars weakly depend on their mass, the equation of state in their cores, and proton superfluidity model (on the specific form of the profile as long as superfluidity in the stellar core is strong enough, K). The upper boundary of the hatched region in Fig. 2 is the cooling curve for a star with a mass of ; it is almost indistinguishable from the cooling curve for a star with and agrees with the observations of four sources, RX J0822–4300, 1E 1207.4–5209, PSR B1055–52, and RX J0720.4–3125, the hottest ones for their ages. These sources will be considered as low-mass neutron stars.
High-mass neutron stars cool down very rapidly via intense neutrino emission generated by the direct Urca process in the inner stellar core. At high densities ( g cm-3), proton superfluidity weakens (Fig. 1) and ceases to suppress the neutrino emission. The cooling curves for such stars weakly depend on their mass, the equation of state, and the proton superfluidity model. They almost coincide with the cooling curves for high-mass non-superfluid stars. All of the observed isolated neutron stars are much hotter than the stars of this type.
Finally, medium-mass stars cool down moderately rapidly. Their cooling strongly depends on the mass, the equation of state, and proton superfluidity model. By varying the stellar mass, we can obtain a family of cooling curves that fill the space between the cooling curves for low-mass and high-mass stars. We consider the sources PSR J0205+64, Vela, PSR B1706–44, PSR J05438+2817, Geminga, and RX J1856.4–3754 as medium-mass neutron stars.
5 Cooling of neutron stars with combined nucleon superfluidity
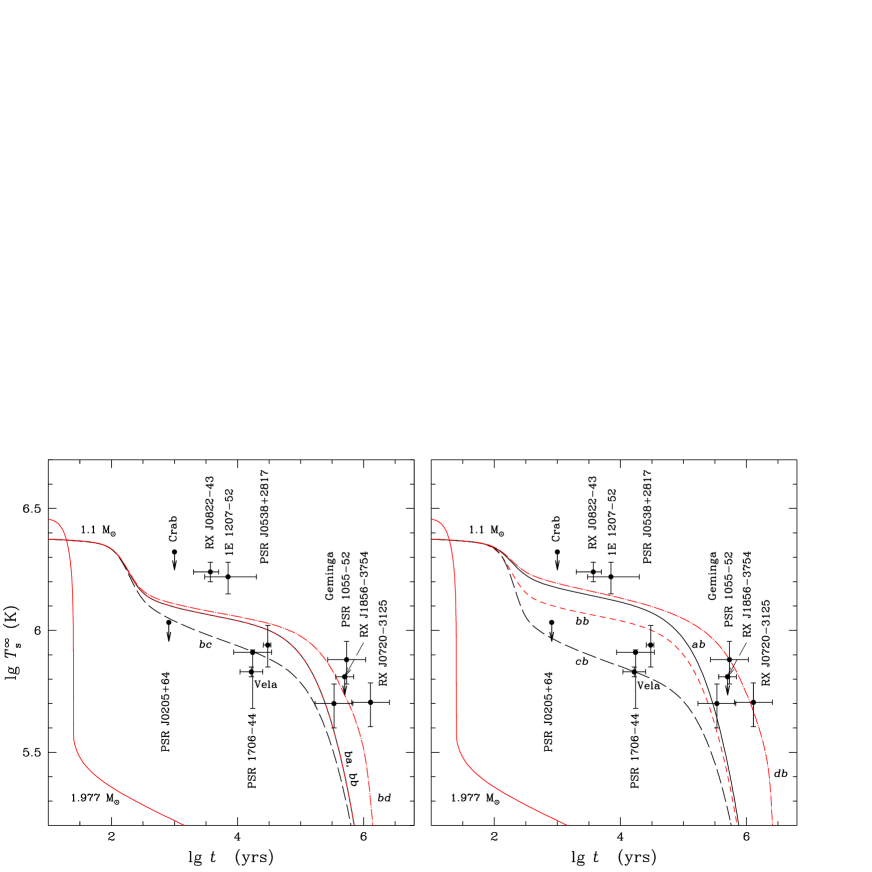
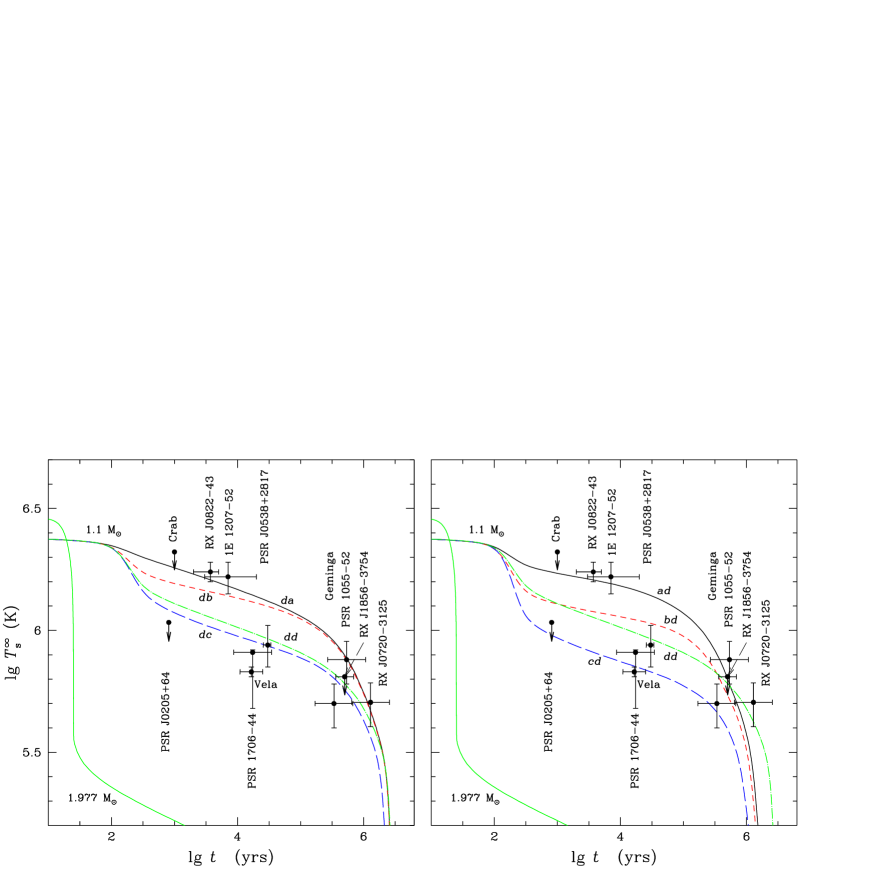
Figures 3–6 show cooling curves for neutron stars with different superfluidities of neutrons and protons (, = a, b, c, or d). Neutron superfluidity is of type B. We consider all the possible combinations of neutron and proton superfluidities. For each combination , we show the upper cooling curve of a low-mass star (, with the central density g cm) and the lower cooling curve of a high-mass star (). The lower curve is virtually independent of the models of superfluidity (see the previous section). The region between the upper and lower curves (similar to the hatched region in Fig. 2) can be filled by cooling curves of medium-mass stars and is accessible by an assumed model of superfluidity . As in Fig. 2, we show also the observational data. Nucleon superfluidity models can be constrained by comparing accessible regions with the observational data.
Each of Figs. 3–6 consists of two panels: In panel (a) neutron superfluidity is fixed, and cooling curves are given for all four proton superfluidity models; in panel (b) proton superfluidity is fixed, and cooling curves are given for all four neutron superfluidity models. By comparing panels (a) and (b), we can trace the change in cooling when proton superfluidity is replaced by neutron superfluidity (and vice versa).
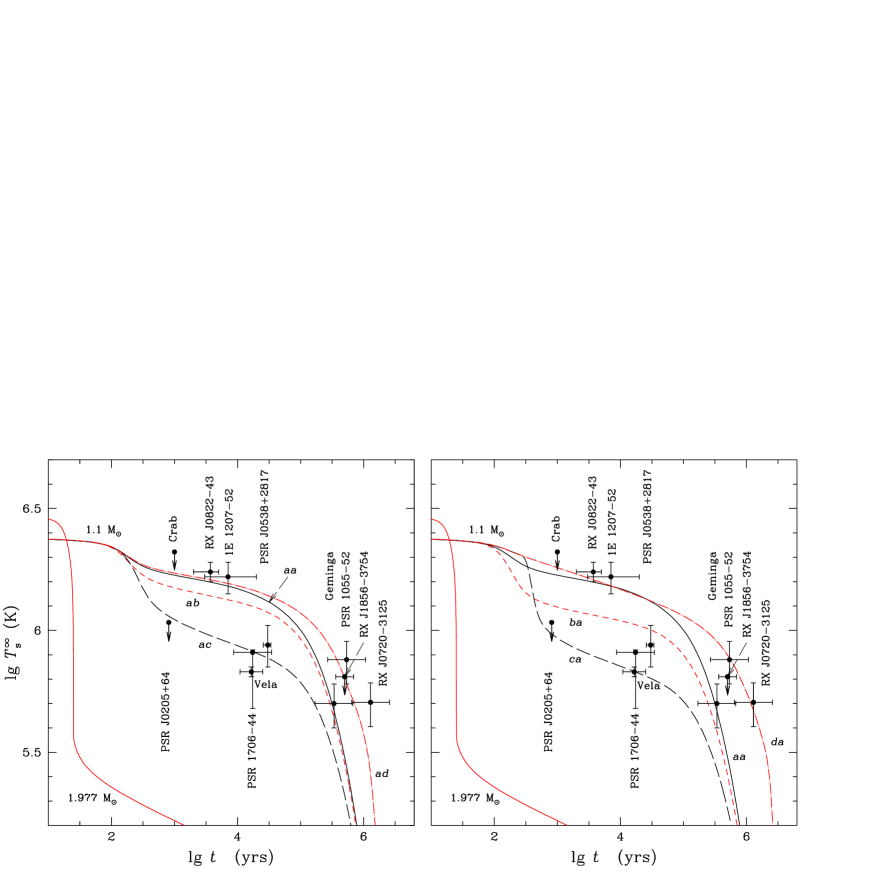
5.1 Fixed proton superfluidity
Let us choose a proton superfluidity model ( = a, b, c, or d) and consider the dependence of the upper cooling curves on the models of neutron superfluidity in Figs. 3–6.
The cooling curves run below the curves because of the neutrino emission due to Cooper pairing of neutrons. This emission is significantly suppressed in the models with strong neutron superfluidity a (see, e.g., Yakovlev et al. 1999a, 1999b, 2001b). All other neutrino reactions involving neutrons and the neutron heat capacity are fully suppressed by neutron superfluidity a or b. The difference between the cooling curves and depends on the model for proton superfluidity . Thus, for example, as we go from the model to and then to the model of moderate proton superfluidity , the contribution of the neutrino emission due to Cooper pairing of protons to the neutrino luminosity of the star increases (and becomes dominant for ). Indeed, the neutrino emission due to Cooper pairing affects most strongly the cooling at moderate critical temperatures of nucleons, K (see, e.g., Yakovlev et al. 1999b, 2001b). As a result, the difference between the cooling curves and in Figs. 3–5 steadily decreases as we go from the model to and . At the same time, the accessible theoretical cooling regions disagree with the observations more and more.
For weak superfluidity (Fig. 6), protons remain normal as long as yr, until the onset of the photon cooling stage. In this case, the main neutrino process involving protons is the bremsstrahlung in proton-proton collisions. Since the contribution of this process to the neutrino emission is much smaller than the contribution of Cooper pairing of protons in model c, the difference between the curves ad and bd again increases. As in Fig. 3 (curves aa and ba), it is mainly determined by the more intense neutrino generation due to Cooper pairing of neutrons in model b than in model a. As a result, the accessible region of stellar surface temperatures for combined superfluidity ad (as for superfluidity da, cf. Fig. 6 with Figs. 2 and 3) agrees with the observations.
The curves and approach one another at the photon cooling stage ( yr). In this case, the influence of neutron superfluidity a or b on the cooling of the star manifests itself mainly in strong suppression of the neutron heat capacity. As a result, the heat capacity of the star is determined by the heat capacity of protons (also suppressed by superfluidity ) and electrons.
For superfluidity models , the neutrino emission due to Cooper pairing of neutrons is especially efficient. Accordingly, the cooling curves in Figs. 3–6 run well below the curves and and do not differ too much from one another. In particular, all of the curves describe the sharp speedup in cooling at yr associated with the switch-on of the neutrino emission due to neutron pairing. We can see that the accessible surface temperatures obtained for the superfluidity models lie well below most of the observational data points.
For the model of weak neutron superfluidity d, the curves almost coincide with the cooling curves for normal neutrons. Differences arise only at the photon cooling stage ( yr) from the partial suppression of the neutron heat capacity. However, at the neutrino cooling stage, neutron superfluidity d has not yet set in. Therefore, all of the cooling curves lie above the curves. At yr, the cooling curves for any run above the curves and due to the strong suppression of the neutron heat capacity by superfluidities a and b. Finally, the cooling curve for the model of combined superfluidity dd is close to the standard cooling curve for non-superfluid low-mass () neutron stars. This cooling curve disagrees with the observations of many neutron stars (both the hottest and coolest ones for their ages).
5.2 Fixed Neutron Superfluidity
Let us choose a neutron superfluidity model ( or d) and consider the dependence of the upper cooling curves on proton superfluidity models . A comparison of panels (a) and (b) in Figs. 3–6 reveals a qualitative similarity between cooling curves of low-mass () stars where neutron and proton superfluidities are inverted (i.e., for models and ).
The quantitative differences between cooling curves and are attributable to different neutron and proton number densities in the cores of neutron stars and to different types of neutron (triplet-state) and proton (singlet-state) pairing. This results in a slightly asymmetric effect of neutrons and protons on the neutrino luminosity and the heat capacity (see, e.g., Yakovlev et al. 1999a). Thus, for example, at temperatures slightly below , the neutrino emissivity due to neutron pairing is approximately an order of magnitude higher than that due to proton pairing (even for the chosen constant ). Therefore, the cooling curves and (panel (a) in Figs. 4 and 5) lie below the “inverted” cooling curves and (panel (b) in the same figures). On the other hand, the curve ad (Fig. 3a) at the photon cooling stage ( yr) runs below the curve da (Fig. 3b). This is because the heat capacity of the neutron star core is stronger suppressed by neutron superfluidity than by proton superfluidity . In other cases, the inversion of neutron and proton superfluidities leads to qualitatively similar (roughly symmetric) cooling curves in Figs. 3–6. For high-mass neutron stars (), this symmetry was found by Levenfish et al. (1999) in their simplified cooling calculations for stars with constant critical temperatures of neutrons and protons over the stellar core.
A comparison of the upper cooling curves with the observations in Figs. 3–6 shows that there are only two models of combined nucleon superfluidity that are consistent with the set of observational data. They include the model da discussed in Section 4 and the “inverted” model ad (Figs. 3 and 6). In other words, one (neutron or proton) superfluidity must be weak, while the other must be strong. Other models are unable to simultaneously explain the observational data, primarily for four neutron stars (RX J0822–4300, 1E 1207.4–5209, PSR B1055–52, and RX J0720.4–3125), the hottest ones for their ages.
Varying nucleon superfluidity models, we can constrain critical temperatures of nucleons at which the theory agrees with the observations. In general, the following conditions must be satisfied simultaneously: either K and K, or K and K.
The models of moderate neutron and/or proton superfluidity in the cores of neutron stars with peak temperatures and/or in the range K are inconsistent with the observations of neutron stars hottest for their ages. We can show that this conclusion is valid for a much broader class of nucleon superfluidity models than those used here. Nevertheless, there is a narrow region of nucleon superfluidity parameters at which the combination of strong nucleon superfluidity of one type and moderate nucleon superfluidity of another type can be reconciled with the observations (for details, see Gusakov et al. 2004).
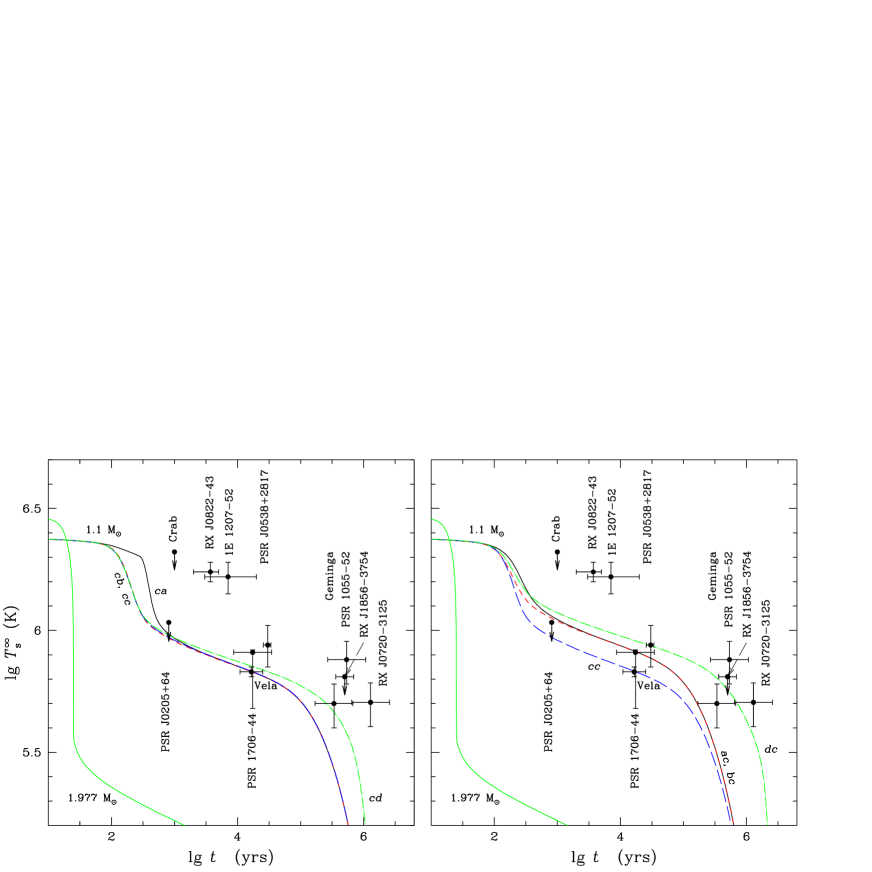
5.3 On the constant in the expression for the neutrino emissivity due to Cooper pairing of protons
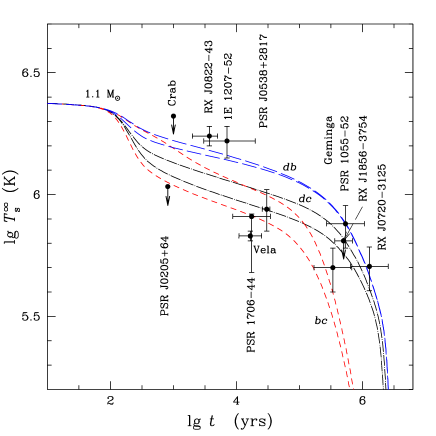
Let us briefly discuss the sensitivity of cooling curves to the constant in the expression for the neutrino emissivity due to proton pairing. Recall that the value of that includes many-body effects is known poorly. In our calculations, we used the (renormalized) value .
For example, Fig. 7 shows cooling curves of a low-mass neutron star for three models of neutron and proton superfluidity (db, dc, and bc). As shown above, the neutrino emission due to Cooper pairing is especially important in low-mass stars. As everywhere in this section, we consider neutron superfluidity of type B. The lower of two curves for each superfluidity model is calculated with the renormalized constant , while the upper curve is calculated with the non-renormalized constant (but taking into account relativistic effects; see Kaminker et al. 1999).
In model db, proton superfluidity b is moderately strong and appears at an early cooling stage. The neutrino emission due to proton pairing plays a relatively minor role, and the exact value of weakly affects the cooling.
In model dc and, especially, in model bc, moderate proton pairing results in intense neutrino emission and appreciably speeds up the cooling. In these cases, the cooling curves are most sensitive to . However, as seen from Fig. 7, the employed variations of cannot lead to agreement of cooling curves dc and bc with the observations and, hence, do not affect our conclusions. We believe the renormalized value to be more realistic than the non-renormalized value. The existing uncertainty in introduces an uncertainty in the cooling theory. In particular, for the non-renormalized value of , the approximate symmetry of cooling curves relative to the inversion of nucleon superfluidity models () noted above is much less pronounced than for the renormalized value (see also Yakovlev et al. 1999a). It is possible that the choice of may be important in the future for reconciling theory with observations.
6 Two types of triplet-state pairing of neutrons
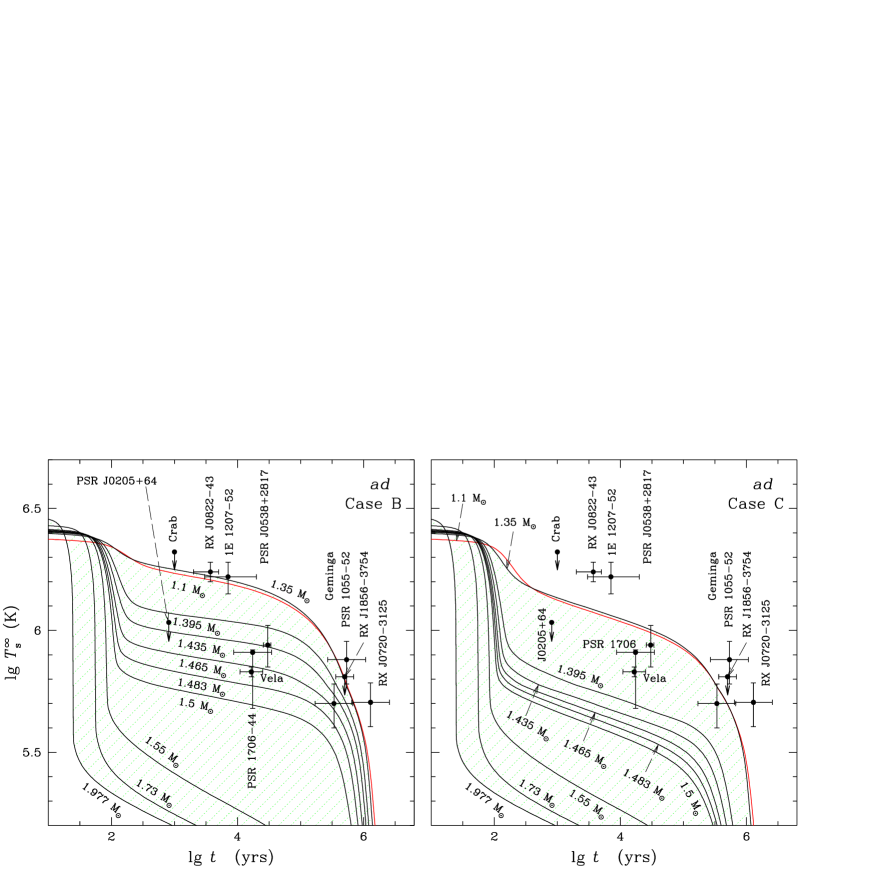
Let us compare the effect of the two types of neutron triplet-state superfluidity (B and C) on cooling of neutron stars. Clearly, significant differences might be expected for strong neutron superfluidity. As follows from the results of the previous section, strong neutron superfluidity of type B (model a) and weak proton superfluidity (model d) can ensure agreement between the theory and the observations. Let us consider this case in more detail. Figure 8 shows the cooling curves for neutron stars of different masses with superfluidity ad: In panels (a) and (b), we take neutron pairing of type B and C, respectively.
According to Fig. 8a (as for model da in Fig. 2), we can identify the same three types of cooling neutron stars: low-mass, slowly cooling stars; high-mass, rapidly cooling stars; and medium-mass stars with a moderate cooling rate.
The cooling of neutron stars with neutron superfluidity of type C was first calculated by Schaab et al. (1998). However, these authors used an oversimplified description of the effects of superfluidity on neutrino reactions. More accurate calculations were performed by Gusakov and Gnedin (2002), who compared the results obtained for superfluidities of types B and C. The authors used the approximation of critical temperatures and constant over the stellar core. Calculations indicate that, in many cases, cooling curves do not change if the actual and profiles are replaced by effective constant critical temperatures close to and at the stellar center (). This approximation is valid if is a smooth function of near the stellar center (e.g., in low-mass stars).
Gusakov and Gnedin (2002) showed that neutron superfluidity of type C speeds up the neutron star cooling (compared to superfluidity of type B). This is caused by the power-law suppression of the neutrino emissivity by superfluidity C (in contrast to the exponential suppression in case B; see, e.g., Yakovlev et al. 1999a; Gusakov 2002). Our calculations (Fig. 8) indicate that the above conclusion remains valid in a more realistic approach, taking into account variations of the critical temperatures and over the stellar core.
Cooling curves for low- and medium-mass stars in Fig. 8b lie well below cooling curves for stars of the same masses in Fig. 8a. On the other hand, cooling curves for high-mass stars () in both panels of the figure almost coincide for the obvious reason: the critical temperatures are low in the central regions of these stars ( K, see Fig. 1), so that superfluidity ceases to affect the cooling.
Thus, according to Fig. 8, strong neutron superfluidity of type C disagrees with the observations of the neutron stars hottest for their ages. This superfluidity is still too weak to completely suppress the modified Urca process in a low-mass star, thereby making the star hotter. Of course, the theory can be reconciled with the observations by choosing the model of stronger superfluidity C. Our calculations indicate that this requires a profile with the maximum K. However, such a strong triplet-state pairing seems unrealistic. Khodel et al. (1998, 2001) gave theoretical arguments against the appearance of superfluidity of type C in neutron stars.
7 Conclusions
We have analyzed the cooling of neutron stars with triplet-state pairing of neutrons and singlet-state pairing of protons in stellar cores. Our results are summarized below.
(1) Cooling curves are qualitatively symmetric relative to the inversion of neutron and proton superfluidity models. For low-mass stars (), this symmetry is largely determined by the dimensionless constant in the expression for the neutrino emissivity due to Cooper pairing of protons. At , obtained without the renormalization of with account for many-body effects, the symmetry is much less pronounced than at expected after the renormalization.
(2) Two types of neutron and proton superfluidity models are consistent with the observations of thermal emission from isolated neutron stars. First, they are the models of strong (type A) proton superfluidity and weak (or absent) (type B or C) neutron superfluidity with maximum (over the stellar core) critical temperatures K and K. Second, they are the models of strong (type B) neutron superfluidity and weak (or absent) proton superfluidity with K and K. The models of the first type seem more realistic. Note, in particular, a recent paper by Schwenk and Friman (2004) who predicted a weakening of triplet-state pairing of neutrons by many-body effects.
(3) Models of moderate (type B or C) neutron superfluidity and/or moderate (type A) proton superfluidity with maximum critical temperatures and in the range from to K are inconsistent with the observations of primarily the hottest young neutron stars RX J0822–4300 and 1E 1207.4–5209. However, the agreement between the cooling theory and the observations is also possible for a narrow range of parameters of moderate neutron superfluidity ( K). This possibility was considered by Gusakov et al. (2004).
(4) Strong triplet-state neutron pairing of type C can appreciably speed up the cooling of middle-aged ( yr) neutron stars compared to pairing of type B for the same profiles. For strong neutron pairing of type C ( K) and weak proton pairing ( K), the theory cannot be reconciled with the observations of RX J0822–4300, 1E 1207.4–5209, PSR B1055–52, and RX J0720.4–3125, the hottest sources for their ages. For any models of strong or moderate neutron pairing, the transition from pairing of type B to pairing of type C just enhances the difference between the theory and the observations.
Our analysis is simplified, because we have considered only the cores of neutron stars composed of neutrons, protons, and electrons (disregarding the possible existence of hyperons, pion and kaon condensates, or quark matter). Moreover, we have chosen only one equation of state in the cores of neutron stars and similar profiles of the critical temperatures of neutrons and protons in the stellar cores. Varying the equation of state (for the matter composed of neutrons, protons and electrons) leads to shifting the threshold of the direct Urca process (to changing and ). Varying profiles (but retaining their general shape) at high K leads to shifting the characteristic values of at which superfluidity weakens and ceases to suppress the intense neutrino emission. Both effects shift boundary masses that separate the three types of cooling neutron stars (Kaminker et al. 2002), but do not alter our main conclusions. It is significant that the simplest model of neutron stars with strong proton superfluidity (even without neutron superfluidity) is capable of explaining the available observations.
It should be noted that the cooling of neutron stars also depends on (singlet-state) neutron pairing in the inner stellar crust, on the magnetic field in the outermost stellar layers, and on the presence or absence of a surface layer of light elements (see, e.g., Potekhin et al. 2003). In general, however, these factors have a weaker effect on the cooling than nucleon superfluidity in the cores of neutron stars considered here. We have disregarded them by restricting our analysis to superfluidity effects in the stellar cores. Our cooling code allows us to include these factors, and it can be necessary for interpreting individual sources, primarily the objects hottest for their ages (see, e.g., Potekhin et al. 2003). The cooling of neutron stars can also depend on internal reheating mechanisms related, for example, to the viscous dissipation of differential rotation (see, e.g., Page 1998a, 1998b). We emphasize that these reheating mechanisms are model dependent. On the other hand, the available observations can be interpreted without invoking them.
Note that the surface temperatures of neutron stars are difficult to determine from observational data (see, e.g., Pavlov et al. 2002). For this purpose, one needs reliable observational data and theoretical models of neutron star atmospheres. The existing values of can change appreciably, which can strongly affect the interpretation of the observations, especially, of RX J0822–4300, 1E 1207.4–5209, PSR B1055–52, and RX J0720.4–3125. Future observations of thermal emission from isolated neutron stars will be crucial for understanding superfluid properties of dense matter in stellar cores.
Acknowledgments
This work was supported by the Russian Foundation for Basic Research (project nos. 02-02-17668 and 03-07-90200), the Russian Leading Scientific Schools Program (project no. 1115.2003.2), and the INTAS YSF (grant no. 03-55-2397).
References
-
L. Amundsen, E. Østgaard, Nucl. Phys. A 442, 163 (1985).
-
R.G. Arendt, E. Dwek, R. Petre, Astrophys. J. 368, 474 (1991).
-
M. Baldo, J. Cugnon, A. Lejeune, U. Lombardo, Nucl. Phys. A 536, 349 (1992).
-
T.M. Braje, R.W. Romani, Astrophys. J. 580, 1043 (2002).
-
W.F. Brisken, S.E. Thorsett, A. Golden, W.M. Goss, Astrophys. J. Lett. 593, L89 (2003).
-
V. Burwitz, F. Haberl, R. Neuhäuser, P. Predehl, J. Trümper, V.E. Zavlin, Astron. Astrophys. 399, 1109 (2003).
-
G.W. Carter, M. Prakash, Phys. Lett. B525, 249 (2002).
-
E.G. Flowers, M. Ruderman, P.G. Sutherland, Astrophys. J. 205, 541 (1976).
-
O.Y. Gnedin, D.G. Yakovlev, A.Y. Potekhin, MNRAS 324, 725 (2001).
-
M.E. Gusakov, Astron. Astrophys. 389, 702 (2002).
-
M.E. Gusakov and O.Yu. Gnedin, Astron. Lett. 28, 669 (2002).
-
M.E. Gusakov, A.D. Kaminker, D.G. Yakovlev, O.Yu. Gnedin, Astron. Astrophys. 421, 1143 (2004).
-
P. Haensel, in: Final Stages of Stellar Evolution (Ed. J.-M. Hameury, C. Motch, EAS Publications Series, EDP Sciences, 2003), p. 249.
-
A.D. Kaminker, P. Haensel, D.G. Yakovlev, Astron. Astrophys. 345, L14 (1999).
-
A.D. Kaminker, P. Haensel, D.G. Yakovlev, Astron. Astrophys. 373, L17 (2001).
-
A.D. Kaminker, D.G. Yakovlev, O.Y. Gnedin, Astron. Astrophys. 383, 1076 (2002).
-
D.L. Kaplan, S.R. Kulkarni, M.H. van Kerkwijk, H.L. Marshall, Astrophys. J. 570, L79 (2002).
-
V.A. Khodel, V.V. Khodel, J.W. Clark, Phys. Rev. Lett. 81, 3828 (1998).
-
V.A. Khodel, J.W. Clark, M.V. Zverev, Phys. Rev. Lett. 88, 031103 (2001).
-
M. Kramer, A.G. Lyne, G. Hobbs, O. Löhmer, P. Carr, C. Jordan, A. Wolszczan, Astrophys. J. Lett. 593, L31 (2003).
-
J.M. Lattimer, M. Prakash, Astrophys. J. 550, 426 (2001).
-
J.M. Lattimer, C.J. Pethick, M. Prakash, P. Haensel, Phys. Rev. Lett. 66, 2701 (1991).
-
K.P. Levenfish, Yu.A. Shibanov, D.G. Yakovlev, Astron. Lett. 25, 417 (1999).
-
U. Lombardo, H.-J. Schulze, in: Physics of Neutron Star Interiors (Ed. D. Blaschke, N.K. Glendenning, A. Sedrakian; Springer, Berlin, 2001) p. 30.
-
A.G. Lyne, R.S. Pritchard, F. Graham-Smith, F. Camilo, Nature 381, 497 (1996).
-
K.E. McGowan, S. Zane, M. Cropper, J.A. Kennea, F.A. Cordova, C. Ho, T. Sasseen, W.T. Vestrand, Astrophys. J. 600, 343 (2004).
-
C. Motch, V.E. Zavlin, F. Haberl, Astron. Astrophys. 408, 323 (2003).
-
D. Page, in: The Many Faces of Neutron Stars, NATO ASI Ser. C, v. 515, (Ed. R. Buccheri, J. van Paradijs, M.A. Alpar; Kluwer, Dordrecht, 1998a) p. 539.
-
D. Page, in: Neutron Stars and Pulsars (Ed. N. Shibazaki, N. Kawai, S. Shibata, T. Kifune; Univ. Acad. Press, Tokyo, 1998b) p. 183.
-
G.G. Pavlov, V.E. Zavlin, in: the Proceedings of the XXI Texas Symposium on Relativistic Astrophysics, (Ed. R. Bandiera, R. Maiolino, F. Mannucci; World Scientific Publishing: Singapore, 2003) p. 319.
-
G.G. Pavlov, V.E. Zavlin, D. Sanwal, V. Burwitz, G.P. Garmire, Astrophys. J. Lett. 552, L129 (2001).
-
G.G. Pavlov, V.E. Zavlin, D. Sanwal, in: WE-Heraeus Seminar on Neutron Stars, Pulsars and Supernova Remnants No.270 (Ed. W. Becker, H. Lesch, J. Trümper; Garching: MPE-Report 278, 2002), p. 273.
-
J.A. Pons, F. Walter, J. Lattimer, M. Prakash, R. Neuhäuser, P. An, Astrophys. J. 564, 981 (2002).
-
A.Y. Potekhin, D.G. Yakovlev, G. Chabrier, O.Y. Gnedin, Astrophys. J. 594, 404 (2003).
-
M. Prakash, T.L. Ainsworth, J.M. Lattimer, Phys. Rev. Lett. 61, 2518 (1988).
-
R.S. Roger, D.K. Milne, M.J. Kesteven, K.J. Wellington, R.F. Haynes, Astrophys. J. 332, 940 (1988).
-
Ch. Schaab, F. Weber, M.K. Weigel, Astron. Astrophys. 335, 596 (1998).
-
A. Schwenk, B. Friman, Phys. Rev. Lett. 92, 082501 (2004).
-
P.O. Slane, D.J. Helfand, S.S. Murray, Astrophys. J. Lett. 571, L45 (2002).
-
J.E. Trümper, V. Burwitz, F. Haberl, V.E. Zavlin, astro-ph/0312600 (2003).
-
F.M. Walter, Astrophys. J. 549, 433 (2001).
-
F.M. Walter, J.M. Lattimer, Astrophys. J. Lett. 576, L145 (2002).
-
M.C. Weisskopf, S.L. O’Dell, F. Paerels, R.F. Elsner, W. Becker, A.F. Tennant, D.A. Swartz, Astrophys. J. 601, 1050 (2004).
-
P.F. Winkler, J.H. Tuttle, R.P. Kirshner, M.J. Irwin, in: Supernova Remnants and the Interstellar Medium (Ed. R.S. Roger, T.L. Landecker; Cambridge: Cambridge University Press, 1988), p. 65.
-
D.G. Yakovlev, K.P. Levenfish , Yu.A. Shibanov, Usp. Fiz. Nauk 169, 825 (1999a).
-
D.G. Yakovlev, A.D. Kaminker, K.P. Levenfish, Astron. Astrophys. 343, 650 (1999b).
-
D.G. Yakovlev, A.D. Kaminker, O.Y. Gnedin, Astron. Astrophys. 379, L5 (2001a).
-
D.G. Yakovlev, A.D. Kaminker, O.Y. Gnedin, P. Haensel, Phys. Rep. 354, 1 (2001b).
-
D.G. Yakovlev, O.Y. Gnedin, A.D. Kaminker, A.Y. Potekhin, in: WE-Heraeus Seminar on Neutron Stars, Pulsars and Supernova Remnants No. 270 (Ed. W. Becker, H. Lesch, J. Trümper; Garching: MPE-Report 278, 2002), p. 287.
-
S. Zane, F. Haberl, M. Cropper, V.E. Zavlin, D. Lumb, S. Sembay, C. Motch, MNRAS 334, 345 (2002).
-
V.E. Zavlin, G.G. Pavlov, Memorie della Societa’ Astronomica Italiana, the Proceedings of the EPIC Consortium (held on Oct. 14–16, 2003 in Palermo) to be published [astro-ph/0312326].
-
V.E. Zavlin, J. Trümper, G.G. Pavlov, Astrophys. J. 525, 959 (1999).
-
V.E. Zavlin, G.G. Pavlov, D. Sanwal, Astrophys. J. 606, 444 (2004).