New Constraints on the Star Formation Histories and Dust Attenuation
of Galaxies in the Local Universe from GALEX
Abstract
We derive a variety of physical parameters including star formation rates (SFRs), dust attenuation and burst mass fractions for 6472 galaxies observed by the Galaxy Evolution Explorer (GALEX) and present in the SDSS DR1 main spectroscopic sample. Parameters are estimated in a statistical way by comparing each observed broad-band SED (two GALEX and five SDSS bands) with an extensive library of model galaxy SEDs, which cover a wide range of star formation histories and include stochastic starbursts. We compare the constraints derived using SDSS bands only with those derived using the combination of SDSS and GALEX photometry. We find that the addition of the GALEX bands leads to significant improvement in the estimation of both the dust optical depth and the star formation rate over timescales of 100 Myr to 1 Gyr in a galaxy. We are sensitive to SFRs as low as , and we find that low levels of star formation (SF) are mostly associated with early-type, red galaxies. The least massive galaxies have ratios of current to past-averaged SF rates (-parameter) consistent with constant SF over a Hubble time. For late-type galaxies, this ratio on average decreases with mass. We find that correlates tightly with color, implying that the SF history of a galaxy can be constrained on the basis of the color alone. The fraction of galaxies that have undergone a significant starburst episode within the last 1 Gyr steeply declines with mass—from for galaxies with to for galaxies.
Subject headings:
galaxies: evolution– galaxies: fundamental parameters— galaxies: starburst—ultraviolet: galaxies1. Introduction
Modern large-scale galaxy surveys are allowing new constraints to be placed on the history of star formation (SF) in galaxies. High-quality optical spectra collected by the Sloan Digital Sky Survey (SDSS) have been used to study the recent star formation histories, dust content and metallicities of over nearby galaxies (e.g., Kauffmann et al. 2003a, b; Brinchmann et al. 2004; Tremonti et al. 2004). These analyses make use of specific absorption and emission lines in the galaxy spectra and employ new models of the spectral evolution of galaxies, which include a physically consistent treatment of the production of starlight and its transfer through the interstellar medium (ISM) in galaxies (Charlot & Fall 2000; Charlot & Longhetti 2001; Bruzual & Charlot 2003). In addition, the modeling accounts for the stochastic nature of SF when interpreting galaxy spectra by using large Monte Carlo libraries of different SF histories to estimate physical parameters such as stellar mass, age, and SF rates in a statistical fashion.
In this Letter, we use a similar approach to interpret the combined ultraviolet (UV) and optical colors of 6472 SDSS galaxies observed by the Galaxy Evolution Explorer (GALEX) (Martin et al., 2004). We show that the addition of UV information to the optical SEDs of galaxies leads to significant improvements in the estimates of the star formation rates (SFRs), starburst histories and dust attenuations.
2. Data and Sample
2.1. GALEX and SDSS data
We consider galaxies with combined GALEX and SDSS photometry, for which spectroscopic redshifts are available from the SDSS. GALEX images the sky at far-UV (; 1530 Å) and near-UV (; 2310 Å) bands in two modes: All-sky Imaging Survey (AIS, ) and Medium-deep Imaging Survey (MIS, ). Each circular field covers 1.1 sq. deg. Here we use the internal release of the catalog (IR0.2) that consists of 649 AIS and 94 MIS fields, of which 117 and 91 overlap (at least in part) with the SDSS Data Release One (DR1, Abazajian et al. 2003). We use and fluxes and errors derived in elliptical apertures. For GALEX sources with counterparts in the SDSS DR1 spectroscopic sample we extract SDSS model colors normalized to the Petrosian magnitude, 90% and 50% Petrosian -band radii, and the likelihoods of exponential and de Vaucouleurs -band light profiles.
| Parameter name | RMS aaRMS change in the parameter value when changing the frequency of bursts from 50% to 10% in the last 2 Gyr in the model libraries. | GainbbImprovement in by adding the GALEX fluxes to SDSS constraints. | |||
|---|---|---|---|---|---|
| 6.50 | 0.53 | 1.91 | 2.16 | ||
| 0.40 | 0.06 | 0.21 | 0.22 | ||
| 1.00 | 0.14 | 0.36 | 0.42 | ||
| 1.24 | 0.17 | 0.60 | 0.86 | ||
| 0.36 | 0.03 | 0.14 | 0.15 | ||
| 2.03 | 0.23 | 0.62 | 1.05 | ||
| 1.46 | 0.18 | 0.46 | 0.78 | ||
| 10.42 | 0.02 | 0.08 | 0.09 | ||
| log SFR(100 Myr) | 0.00 | 0.07 | 0.27 | 0.54 | |
| log SFR(1 Gyr) | 0.18 | 0.12 | 0.30 | 0.55 | |
| 2.31 | 0.90 | 1.62 | 1.65 | ||
| (100 Myr) | 0.00 | 0.06ccOnly for galaxies for which is . | 0.01 | 0.01 | |
| (1 Gyr) | 0.02 | 0.08ccOnly for galaxies for which is . | 0.04 | 0.06 |
Note. — , and are in Gyr, SFR in , in , and and in magnitudes.
2.2. Sample
We construct our sample from GALEX objects matched to SDSS DR1 objects in a radius (Seibert et al., 2004). We then restrict the sample to objects spectroscopically classified as galaxies and with redshifts . To avoid mismatches or matching an unresolved GALEX object with resolved SDSS objects, we additionally impose astrometric criteria which remove of the galaxies, leaving 6826. About 70% of the remaining galaxies have redshifts in a narrow range between 0.05 and 0.15 (the number of SDSS galaxies with spectra drops steeply when ). GALEX MIS and AIS recover on average and of the SDSS main galaxy spectroscopic sample (). MIS galaxies constitute 60% of our sample. The addition of UV selection leads to incompleteness for galaxies redder than in the MIS and in the AIS. However, brighter red galaxies are still present in our sample.
3. Model Galaxy Parameters
3.1. Libraries of galaxy models
We use the Bruzual & Charlot (2003) population synthesis code to generate libraries of stochastic realizations of model SF histories at five redshifts equally spaced between 0.05 and 0.25. Each library contains models. For simplicity, we follow Kauffmann et al. (2003a) and parameterize each SF history in terms of two components: an underlying continuous model with an exponentially declining SF law (SFR) and random bursts superimposed on this continuous model.111Specifically, we take the galaxy age to be distributed uniformly over the interval from zero to the age of the universe at a given redshift, and the SF timescale parameter over the interval Gyr-1. Random bursts occur with equal probability at all times until . They are parameterized in terms of the ratio between the mass of stars formed in the burst and the total mass of stars formed by the continuous model over the time . The ratio is taken to be distributed logarithmically from 0.03 to 4.0. During a burst, stars form at a constant rate for a time distributed uniformly in the range 30–300 Myr. The burst probability is set so that 50% of the galaxies in the library have experienced a burst in the past 2 Gyr. Attenuation by dust is described by means of two main parameters (see Charlot & Fall 2000): the effective -band absorption optical depth affecting stars younger than 10 Myr (that arises from giant molecular clouds and the diffuse ISM) and the fraction of it contributed by the diffuse ISM, that also affects older stars. Based on previous analyses of SDSS galaxies (Kauffmann et al. 2003a, Brinchmann et al. 2004), we take to be distributed from 0 to 6 with a broad peak around 1 and to be distributed from 0.1 to 1 with a broad peak around 0.3. Our model galaxies have metallicities uniformly distributed between 0.1 and 2 .

3.2. Deriving physical parameters
We derive statistical estimates of various physical parameters by comparing the observed SED of each galaxy in the sample to the model SEDs as follows. First, we convert SDSS magnitudes into fluxes, correcting for the offsets between the SDSS- and AB-magnitude zeropoints (Abazajian et al., 2004) and applying small zeropoint offsets to GALEX fluxes. To SDSS flux errors we add calibration errors in quadrature. After accounting for Galactic reddening, we compare the SED of the observed galaxy to all SEDs in the closest-redshift model library. The goodness of fit of each model determines the weight () to be assigned to the physical parameters of that model when building the probability distributions of the parameters of the given galaxy. The probability density function (PDF) of a given physical parameter is thus obtained from the distribution of the weights of all models in the library. We characterize the PDF using the median and the 2.3–97.7 percentile range (equivalent to range for Gaussian distributions), and also record the of the best-fitting model. We perform this analysis for all galaxies in our sample. The distribution of values of the best-fitting models is generally very good, implying that our libraries do reproduce the observed SEDs. However, there is a tail of large values–usually identifiable as objects with suspect SDSS magnitudes, or as “shredded” objects. We remove galaxies with poorest fits. In the end, we obtain estimates of physical parameters for 6472 galaxies.
3.3. Parameters and their errors
We estimate physical parameters in two ways: using the GALEX and fluxes combined with the SDSS fluxes; and using only the SDSS fluxes. This allows us to quantify the effect of adding ultraviolet constraints.
Table 1 summarizes our results. For each physical parameter, we list the sample-averaged parameter value () derived using GALEX + SDSS constraints, “” estimate of the average parameter error with (G+S) and without (S) including the GALEX constraints, and the increase in accuracy (gain) achieved with GALEX . We also investigate the effect of changing the fraction (from 50% to 10%) of galaxies in the model libraries that had bursts over the past 2 Gyr. In Table 1, we report the resulting RMS change in parameter value. It is usually much smaller than the “fitting” error, except for the time since the last burst of SF.
The physical parameters for which the estimates are most significantly improved with GALEX are the 100 Myr- and 1 Gyr-averaged SF rates, (SFR(100 Myr) and SFR(1 Gyr)), FUV and NUV dust attenuations ( and ), and estimates of the fraction of a galaxy’s stellar mass formed in bursts ((100 Myr) and (1 Gyr)) over the last 0.1 and 1 Gyr (although it is sensitive to the assumed frequency of bursts in the model libraries).
4. Analysis of Physical Properties, Star Formation and Starburst Histories
In Figure 1 we compare the stellar masses derived from our analysis of GALEX + SDSS colors with those derived by Kauffmann et al. (2003a). These authors used the strengths of the absorption-line index and 4000 Å break in the SDSS spectra (that trace the recent and past-averaged SF histories) to improve the constraints on the stellar mass-to-light ratios relative to estimates based on a single optical color. The scatter in the difference between the two types of mass estimates (0.11 dex without outliers) is very well matched by the uncertainties in the two studies (0.08 dex). Kauffmann et al. (2003a) also compute the fraction of a galaxy’s stellar mass formed in bursts over the last 2 Gyr. In our study, bursts over 2 Gyr are poorly constrained. This is because the UV light is less sensitive to stars older than 1 Gyr than the index. We have checked that galaxies for which we find have 4000 Å breaks and strengths typical of galaxies for which Kauffmann et al. (2003a) find (2 Gyr).
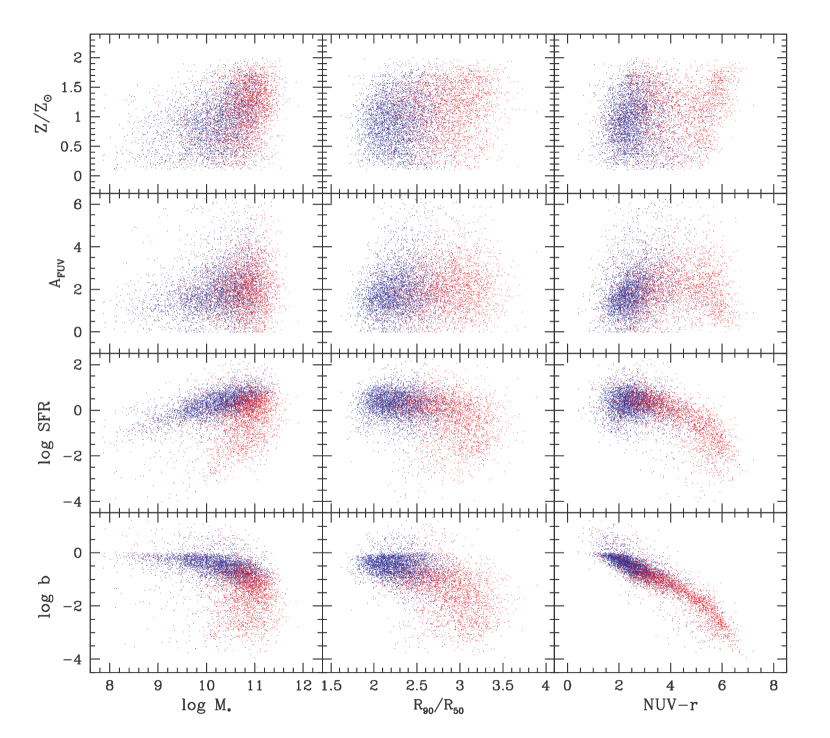
We present our main results in Figure 2, where we show the dependence of selected physical parameters on three fundamental galaxy properties: stellar mass, galaxy type, and color. We use the concentration parameter as a proxy for galaxy type. Values of larger than 2.5 correspond mostly to early-type galaxies, but late-type galaxies can also have large (Fukugita et al., 2004). We choose the color as it provides a broad baseline and is not subject to large k-corrections. Objects are color-coded to indicate whether an exponential profile (blue) or a de Vaucouleurs profile (red) has higher probability. This serves as an additional rough indicator of galaxy type.
The first row of panels in Figure 2 presents the derived stellar metallicities. It was recently demonstrated that star-forming galaxies in SDSS exhibit a tight metallicity (of ISM) vs. mass correlation (Tremonti et al., 2004). Although metallicity is not strongly constrained using our method (see Table 1), we do find that low-mass galaxies do not reach metallicities as high as high-mass galaxies. (Note that galaxies with are preferentially disk galaxies, and mostly have .) Massive galaxies span a wide range in , with blue and red dots occupying the same space.
The second row of panels shows that low-mass galaxies on average suffer less attenuation than massive ones, implying that the dust content is smaller, but the range of attenuation in more massive galaxies is larger. We also find that the dust attenuation in late-type galaxies increases as their colors become redder, but early-type galaxies behave in the opposite fashion. This probably indicates that the reddest early-type galaxies have little gas, ongoing SF and dust.
Next we examine the total current SFR (averaged over the last 100 Myr). We find that GALEX is sensitive to very low SF levels, . Not surprisingly, galaxies with the lowest SFRs are primarily of early type. However, there is an interesting concentration of red dots at . This “population” has lower concentration index and bluer color than low-SF early-type galaxies. Inspection of the images of a subset of these galaxies with high metallicities reveals that about half of them are spirals (often disrupted), while most others show (low surface-brightness) disks. Some 10% appear to be true ellipticals. This emphasizes the crudeness of classification based on profile fitting. Finally, we note that we compared our SFRs with those derived from aperture-corrected nebular emission (Brinchmann et al., 2004) and found excellent overall agreement. A more detailed comparison of SF metrics will be presented elsewhere.
The last row shows the ratio of current (last 100 Myr) to past-averaged SF (the “-parameter”). Galaxies with constant SFR will have , while those undergoing a burst can have . We find that is close to unity for low-mass galaxies but extends to 0.1 for massive, late-types galaxies, in agreement with the results of Brinchmann et al. (2004). Early-types reach values as low as . The tight correlation between and color is most remarkable. It implies that the SF history of a galaxy can be constrained on the basis of the color alone.

We have also examined the relation between SFR and FUV attenuation for the galaxies in our sample. We find that increasing SFRs are always associated with larger attenuations. At a fixed attenuation, however, early-type galaxies can have SFRs several orders of magnitude smaller than late-type galaxies. This suggests a different dependence between dust content and SF in the two types of galaxies. Buat et al. (2004) also find that the dust attenuation increases with the amount of recent SF as estimated by the dust-corrected NUV flux.
One might worry that because our sample has UV selection, the results shown in Figure 2 may not apply to the galaxy population as a whole. We have analyzed the relations between the same galaxy properties as in Figure 2 for the MIS fields, where the UV coverage of galaxies in the SDSS spectroscopic sample is substantially more complete. We found exactly the same relations between SFR, , and mass, concentration and color. The most notable difference is that the MIS data (by virtue of going deeper) contain a larger fraction of massive, concentrated red galaxies. Therefore, while the above results are useful for identifying various trends, they cannot be used to study the relative proportions of galaxies with different properties.
Finally we perform a time-resolved analysis of starbursts. We select galaxies that have experienced starburst in which more than 5% of stellar mass () was formed over the last 100 Myr and 1 Gyr. Figure 3 gives the fraction of galaxies of a given mass that have undergone a recent starburst. The dashed histogram corresponds to bursts within the last 100 Myr. For , the fraction is , but it declines to zero for the most massive galaxies. Over the last 1 Gyr (solid histogram) some 20% of low-mass galaxies having experienced bursts. This fraction falls to 5% for larger masses. Qualitatively consistent results are obtained if we restrict the analysis to the MIS fields. Similar results were obtained by Kauffmann et al. (2003b), who analyzed starbursts over a 2 Gyr timescale.
In this preliminary study of SF history using the UV photometry from GALEX , we demonstrate the promise and point to possible limitations of this dataset when interpreted with galaxy models. As we gather more data we should be able to better explore the trends suggested here, and to get better statistics on low-mass galaxies.
References
- Abazajian et al. (2003) Abazajian, K., et al. 2003, AJ, 126, 2081
- Abazajian et al. (2004) Abazajian, K., et al. 2004, submitted to AJ, astro-ph/0403325
- Brinchmann et al. (2004) Brinchmann, J., et al. 2004, MNRAS, 351, 1151
- Bruzual & Charlot (2003) Bruzual, G. & Charlot, S. 2003, MNRAS, 344, 1000
- Buat et al. (2004) Buat, V. 2004, ApJ, in press [this volume]
- Charlot & Fall (2000) Charlot, S. & Fall, S. M. 2000, ApJ, 539, 718
- Charlot & Longhetti (2001) Charlot, S. & Longhetti, M. 2001, MNRAS, 323, 887
- Fukugita et al. (2004) Fukugita, M., Nakamura, O., Turner, E. L., Helmboldt, J., & Nichol, R. C. 2004, ApJ, 601, L127
- Kauffmann et al. (2003a) Kauffmann, G., et al. 2003a, MNRAS, 341, 33
- Kauffmann et al. (2003b) Kauffmann, G., et al. 2003b, MNRAS, 341, 54
- Martin et al. (2004) Martin, C. L., et al. 2004, ApJ, in press [this volume]
- Seibert et al. (2004) Seibert, M., et al. 2004, ApJ, in press [this volume]
- Tremonti et al. (2004) Tremonti, C. A., et al. 2004, ApJ, in press, astro-ph/0405537