A comparative study of the spatial distribution of ultraviolet and far-infrared fluxes from M 101
Abstract
The total ultraviolet (UV) flux (from 1412 to 2718 Å) of M 101 is compared on a pixel-to-pixel basis with the total far-infrared (FIR) flux (from 60 to 170 m), using the maps of the galaxy taken by GALEX in the near-UV and far-UV and by ISOPHOT at 60, 100 and 170 m. The main result of this investigation is the discovery of a tight dependence of the FIR/UV ratio on radius, with values monotonically decreasing from in the nuclear region to nearly zero towards the edge of the optical disk. Although the tightness of this dependence is in part attributable to resolution effects, the result is consistent with the presence of a large-scale distribution of diffuse dust having a face-on optical depth which decreases with radius and which dominates over the more localized variations in opacity between the arm and interarm regions. We also find a trend for the FIR/UV ratio to take on higher values in the regions of diffuse interarm emission than in the spiral-arm regions, at a given radius. This is interpreted quantitatively in terms of the escape probability of UV photons from spiral arms and their subsequent scattering in the interarm regions, and in terms of the larger relative contribution of optical photons to the heating of the dust in the interarm regions.
1 Introduction
It is not known to which extent the appearance of ultraviolet (UV) images of gas-rich star-forming galaxies differs from the intrinsic distribution of UV sources, due to the effects of absorption and scattering by dust grains. These effects can be quantified by a direct comparison of UV maps with maps of Far-Infrared (FIR) emission from the grains, since most of the absorbed UV light is re-radiated in the FIR. Late-type face-on spiral galaxies are ideal for such studies because a higher proportion of their bolometric output originates from the young stellar population emitting in the UV, and because the analysis is not complicated by inclination effects.
The nearly face-on Sc galaxy M 101 was observed by GALEX (Galaxy Evolution Explorer; Martin et al. 2004, this volume) as part of the GALEX Nearby Galaxies Survey (NGS). The GALEX UV photometry of all discrete sources in M 101 is presented by Bianchi et al. (2004, this volume). Here we compare the GALEX images of M 101 with maps of this galaxy made using the ISOPHOT instrument (Lemke et al. 1996) on board the Infrared Space Observatory (ISO). An alternative study of another galaxy from the NGS, M83, is presented by Boissier et al. (2004, this volume), who derive extinction radial profiles of that galaxy from GALEX UV imaging. Extinction radial profiles of a few spiral galaxies were also presented by Boissier et al. (2004) using FOCA and IRAS data. For statistical samples, Buat et al. (2004, this volume) has presented a complementary study of extinction based on GALEX and IRAS data. Studies of the stellar populations in the inner and outer disks of NGS galaxies are also presented by Thilker et al. (2004a,b, this volume).
2 Comparison between the GALEX and ISOPHOT images
GALEX observed M 101 in its far-UV (FUV; 1530 Å) and near-UV (NUV; 2310 Å) bands (Morrissey et al. 2004, this volume). Using the GALEX pipeline (Martin et al. 2001), which final images were produced with a spatial scale of 1.5 ′′ pixel-1. The PSF FWHM of the images were 4 and 5 ′′ for the FUV and NUV bands, respectively. The ISOPHOT images were made in bands centered at 60, 100 and 170 m, covering an overall spectral range from 40 to 240 m. The FWHM of Gaussian beams having the same area as the ISOPHOT beams are 50.5, 54.5 and at 60, 100 and 170 m, respectively. Details of the data analysis for the ISOPHOT observations of M 101 are given in Tuffs & Gabriel (2003).
To compare the GALEX maps with the ISOPHOT maps we converted the UV maps to the orientation, resolution and sampling of the FIR maps. The UV images were convolved with the ISO beams and resampled every for comparison with the 60 and 100 m images, and every for comparison with the 170 m image. The resulting images were corrected for Galactic extinction and then combined by means of a linear interpolation and integrated over wavelength to produce images of the UV flux integrated from 1412 Å to 2718 Å, calibrated in W/m2. We refer to these combined images as “total UV” images, even though they do not contain the emission between 912 Å and 1412 Å and between 2718 Å and the U band. For a steady-state star-formation and a Salpeter IMF, we estimate that the factor by which one must multiply the emission in the range Å to obtain the true total UV emission is 1.95. This factor depends only to second order on the effects of reddening.
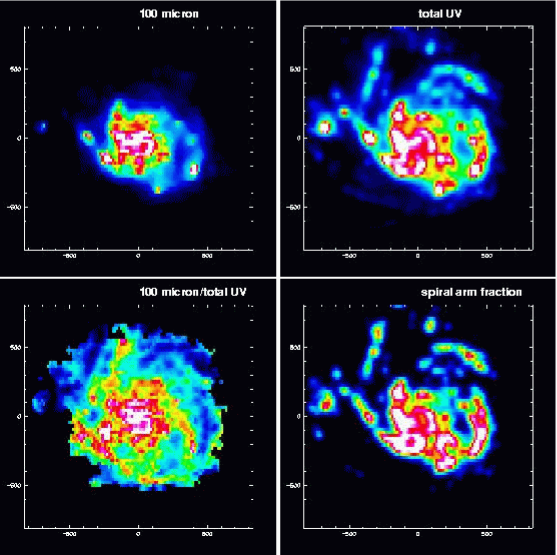
To facilitate a quantitative comparison between the “total UV” and FIR images, the ISOPHOT images were converted into units of W/m2 by multiplying them by the corresponding filter widths. In the top panels of Fig. 1 we display as an example the filter-integrated 100 m ISOPHOT image (left) together with the corresponding “total UV” image (right). The 100 m image appears smaller than the UV image, mainly because the FIR counterparts to the upper spiral arms prominent in the UV image are very faint at 100 m. This effect is further quantified by the ratio image (100 m/UV) displayed in the bottom left panel of Fig. 1, where the region of the upper spiral arms coincides with low values of this ratio. At high surface brightness levels however, the 100 m image and the UV image appear to trace similar structures. The prominent HII regions are seen in both direct UV light and in the dust re-emission, albeit with varying ratios. The same is true for the general spiral structure. Also, in both the 100 m image and the UV image a diffuse emission underlies the spiral structure. In order to compare the 100 m/UV color from the spiral structure with that from the underlying diffuse emission we produced an image of the “spiral arm fraction”, whose values give the fraction of the beam area occupied by spiral arm structure. This was generated from the high resolution UV image and is displayed in the bottom right panel of Fig. 1. Comparison between the ratio image and the “spiral arm fraction” image shows that the high values of the 100 m/UV ratio trace the interarm regions. In other words the “spiral features” in the ratio image are in reality regions of diffuse emission which are interspaced with the real spiral features, as seen in the “spiral arm fraction” image.
3 The radial dependence of the FIR/UV ratio
A fundamental property of galaxies is the fraction of light from young stars which is re-radiated by dust. With the advent of GALEX and FIR facilities like ISO, one can not only investigate this property for the spatially integrated emission (Xu & Buat 1995, Popescu & Tuffs 2002) but also as a function of position in the galaxy. To obtain a “total FIR” image we combined the ISOPHOT 60, 100 and 170 m images (at the resolution of the 170 m image) by linearly interpolating between the bands and integrating over wavelength (between 60 and 170 m), analogous to the procedure adopted to obtain the “total UV” image. As shown by Bothun & Rogers (1992), the dust in the inner regions of M 101 is warmer than the dust in the outer regions and there is considerable variation in the 60/100 m ratio throughout the face of the galaxy indicating a wide range of heating conditions. However, the FIR luminosity derived here is little influenced by dust temperature (or emissivity) variations, since the peak of all emission components from the warm and cold dust should lie within the broad spectral range of our filters (40-240 m). The 170 m band is particularly important in measuring the cold dust which accounts for most of the dust mass as well as bulk of the dust luminosity (Tuffs & Popescu 2003). The derived “total FIR” image still does not contain grain emission in the submm and MIR spectral ranges. Correcting for this spectral incompleteness in the same way as done by Popescu et al. (2002) for the late-type Virgo Cluster galaxies observed by ISOPHOT (Tuffs et al. 2002a,b) in the same filters as M 101, we obtain a correction factor of about 2. This is comparable to the corresponding correction factor to convert fluxes in the “total UV” GALEX band into the true total UV fluxes. Thus the ratio between the “total FIR” and “total UV” fluxes should be comparable to the ratio between the total flux from grains and the UV flux which would have been observed from 912 Å to the U band.
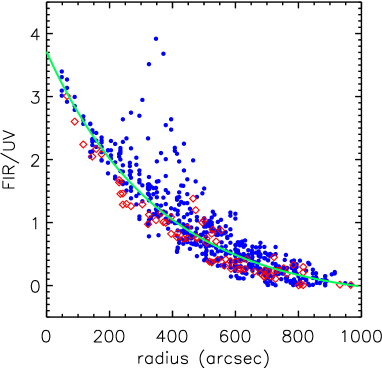
By dividing the “total FIR” image with the “total UV” image we obtained a ratio FIR/UV map with a radial dependence as depicted in Fig. 2. In the derivation of the radial distance we neglected the small inclination (; Sofue et al. 1997), since the value of the position angle is not well constrained and the effect on the result is very small. Fig. 2 shows a remarkably tight dependence of the FIR/UV ratio on radius, with a monotonic decrease from values approaching 4 in the nuclear region to values approaching zero in the outermost regions. The tightness of the dependence is presumably, at least in part, an effect of the large beam which averages the emission from sources of different FIR/UV colours. Nevertheless, some points of high FIR/UV values emerge above the general trend between radii of 200′′ and 500′′. These points originate from an interarm region to the SE of the nucleus. If these exceptional points are neglected, the radial variation of the FIR/UV ratio is well fitted by an offset exponential with , and .
Clearly the major factor determining the FIR/UV ratio is radial position. To statistically investigate the extent to which the ratio also varies when moving from the spiral arms into the interarm region at fixed radius, we divided the points into radial bins of width 100′′ and, within each radial bin, we identified the 10 of points (plotted in red) with the highest spiral arm fraction. The latter was calculated by creating an image of the “spiral arm fraction” at the resolution of the 170 m image, using an analogous procedure to that described in the previous section. Over the entire radial range the red points tend to be clustered at the low values of the FIR/UV ratio, meaning that this ratio takes systematically higher values for the diffuse interarm emission than for the spiral arm emission at a given radius.
4 Discussion
To explain our results we must consider the sources and the propagation of the UV photons within the galaxy and the connection of these to the heating and distribution of the dust grains. Here we consider an approximate analytical treatment of these effects in order to indentify the primary reasons for the observed trends. For a more detailed investigation fully self-consistent radiative transfer techniques would need to be applied, such as those by Bianchi et al. (1996), Ferrara et al. (1999), Baes & Dejonghe (2001), Tuffs et al. (2004).
In the spiral arm regions the UV photons originate from young stars embedded in the HII regions. A fraction of the UV luminosity can be considered to be locally absorbed and re-radiated by dust in the vicinity of the HII region and a fraction escapes the HII region. Thus we can treat the HII regions as sources in the spiral arms emitting both UV and FIR, with luminosities and , respectively. The factor F is simply a geometrical blocking factor which provides a “grey” attenuation, independent of wavelength. A detailed physical description of the factor F is given in Tuffs et al. (2004).
Having escaped from the HII regions, the UV light emitted in the direction of the observer (perpendicular to the disk for a face-on system like M 101) further passes through a layer of diffuse dust which also attenuates the UV and augments the FIR. So the FIR and UV luminosity observed along each line of sight will be: and , where is the probability of absorption in the layer of diffuse dust for a UV photon traveling perpendicular to the disk. The resulting FIR/UV ratio seen towards the spiral arm regions is then given by:
| (1) |
The interarm regions are pervaded by diffuse UV light, with relatively few stellar sources (see Bianchi et al. 2004, this volume; Thilker et al. 2004a,b this volume). Because of the smooth appearance of the diffuse interarm emission, we will work under the hypothesis that this diffuse interarm UV emission is radiation escaping from the spiral arms, traveling in the plane of the disk and subsequently being scattered by grains into the observer’s line of sight perpendicular to the disk. Thus we can treat the dust grains scattering the UV light as “sources” in the interarm regions emitting both UV and FIR, with luminosities proportional to , and , respectively. Here is the local energy density of the UV radiation field, is the extinction cross-section of the grain, is the angle-averaged albedo of the grain, and is the albedo multiplied by the phase function for light scattered at . The UV scattered light traveling towards the observer must then pass perpendicularly through the layer of diffuse dust which attenuates the UV and augments the FIR. If we also consider that in general some fraction () of the FIR emission will be powered by optical photons, the FIR and UV luminosity observed along each line of sight towards the interarm regions will be: and . The resulting FIR/UV ratio seen towards the interarm regions is then given by:
| (2) |
For simplicity we first make the approximation that , in which case Eq. (1) has the same functional form with respect to G as Eq. (2). Since there is no reason why or should depend on radial position, the strong radial dependence seen in Fig. 2 can only be attributable to the radial dependence of the factor , the absorption probability for UV photons travelling through the diffuse dust. In other words our results imply the presence of a large scale distribution of diffuse dust having a face-on optical depth that decreases with radius and which dominates local variation in opacity between the arm and interarm regions.
For the case , Eqs. (1) and (2) also indicate that the observed systematic difference between the FIR/UV ratio in the arm and interarm regions is attributable to the difference between the factors: (for the arms) and (for the interarm regions), with the amplitude of the difference also depending on the value of . Using the values of the albedo given by the model of Laor & Draine (1993) and the phase function from Henyey & Greenstein (1941) we obtain . Values of typically 0.25 for the factor have been derived from self-consistent modeling of the UV/FIR/submm SEDs of normal galaxies (Popescu et al. 2000, Misiriotis et al. 2001), yielding a value of 0.33 for . These values for and are consistent with the observed FIR/UV ratio being smaller in the arm than in the interarm region.
For the case the FIR/UV ratio in the interarm region will be further boosted, due to the expected increase in the fraction of FIR emission powered by optical photons at larger distances from the HII regions in the spiral arms. The combined effect of the optical heating and the scattering of the UV emission means that the FIR/UV ratio will not be a good indicator of extinction in the interarm region. One should also bear in mind that the observed difference in the FIR/UV ratio between arm and interarm region from Fig. 2 is in fact reduced from the prediction of Eqs. (1) and (2) (for any plausible value of ) due to beam smearing. Furthermore, even in the most extreme interarm regions it is apparent from the full resolution GALEX image that some sources of UV emission are present (see Bianchi et al. 2004, this volume).
References
- (1) Baes, M., & Dejonghe, H. 2001, MNRAS, 326, 733
- (2) Bianchi, S., Ferrara, A. & Giovanardi, C. 1996, ApJ, 465, 127
- (3) Bianchi, L., et al. 2004, ApJ Letters, in press
- (4) Bothun, G. D. & Rogers, C. 1992, AJ, 103, 1484
- (5) Boissier, S., Boselli, A., Buat, V., Donas, J., & Milliard, B. 2004, A&A 424, 465
- (6) Boissier, S., et al. 2004, ApJ Letters, in press
- (7) Buat, V. et al., 2004, ApJ Letters, in press
- (8) Ferrara, A., Bianchi, S., Cimatti, A., & Giovanardi, C. 1999, ApJS, 123, 437
- (9) Henyey L. G., & Greenstein J. L., 1941, ApJ, 93, 70
- (10) Laor, A., & Draine, B.T., 1993, ApJ, 402, 441
- (11) Lemke, D., et al. 1996, A&A, 315, L64
- (12) Martin, C. et al. 2001
- (13) Martin, C. et al. 2004, ApJ Letters, in press
- (14) Misiriotis A., Popescu, C. C., Tuffs, R. J., & Kylafis, N. D. 2001, A&A, 372, 775
- (15) Morrissey, P., et al. 2004, ApJ Letters, in press
- (16) Popescu, C.C., Tuffs, R.J., Völk, H.J., Pierini, D., Madore, B.F. 2002, ApJ, 567, 221
- (17) Popescu, C. C., Misiriotis A., Kylafis, N. D., Tuffs, R. J., & Fischera, J., 2000, A&A, 362, 138
- (18) Popescu, C.C., & Tuffs, R.J. 2002, MNRAS, 335, L41
- (19) Sofue, Y., Tutui, Y., Honma, M., & Tomita, A. 1997, AJ, 114, 2428
- (20) Thilker, D.A., et al. 2004a, ApJ Letters, in press
- (21) Thilker, D.A., et al. 2004b, ApJ Letters, in press
- (22) Tuffs, R.J. & Gabriel, C. 2003, A&A, 410, 1075
- (23) Tuffs, R. J. & Popescu, C. C. 2003, in “Exploiting the ISO Data Archive. Infrared Astronomy in the Internet Age”, Siguenza, 24-27 June, 2002. Eds. C. Gry, et al. ESA SP-511, p. 239.
- (24) Tuffs, R. J., et al. 2002a, ApJS, 139, 37
- (25) Tuffs, R. J., et al. 2002b, ApJS, 140, 609
- (26) Tuffs, R. J., Popescu, C. C., Völk, H. J., Kylafis, N. D., & Dopita, M. A. 2004, A&A, 419, 821
- (27) Xu, C. & Buat, V. 1995, A&A, 293, L65