Discovery of Two Gravitationally Lensed Quasars with Image
Separations
of 3 Arcseconds from the Sloan Digital Sky Survey
Abstract
We report the discovery of two doubly-imaged quasars, SDSS J100128.61+502756.9 and SDSS J120629.65+433217.6, at redshifts of and and with image separations of and , respectively. The objects were selected as lens candidates from the Sloan Digital Sky Survey (SDSS). Based on the identical nature of the spectra of the two quasars in each pair and the identification of the lens galaxies, we conclude that the objects are gravitational lenses. The lenses are complicated; in both systems there are several galaxies in the fields very close to the quasars, in addition to the lens galaxies themselves. The lens modeling implies that these nearby galaxies contribute significantly to the lens potentials. On larger scales, we have detected an enhancement in the galaxy density near SDSS J100128.61+502756.9. The number of lenses with image separation of in the SDSS already exceeds the prediction of simple theoretical models based on the standard Lambda-dominated cosmology and observed velocity function of galaxies.
1 Introduction
In strong gravitational lensing of quasars, the separations between multiple images, , is the most important observable linking observations to theory. Since the image separation is determined by the potential depth of the lens, the image separation distribution of lensed quasars offers a direct probe of the hierarchical structure of the universe. For instance, normal galaxies can produce strongly lensed quasars with image separations of , while lenses with image separation can only be caused by clusters of galaxies. About 70 of lenses are known to date111A summary of known lensed quasar systems is available on the CASTLES homepage (Kochanek, C. S., Falco, E. E., Impey, C., Lehar, J., McLeod, B., & Rix, H.-W., http://cfa-www.harvard.edu/castles/), and there is one example of a lensed quasar system in which the lens potential is dominated by that of dark matter (Inada et al., 2003b; Oguri et al., 2004a).
Among gravitationally lensed quasars, those with intermediate image separations ( ) are of great interest because they represent a link between small- and large-separation lenses. In the standard modeling procedure used to predict the distribution of image separations, assuming isothermal profiles and an a priori velocity function of galaxies, lenses with image separations are very rare, because even the largest early type galaxies do not have Einstein radii this large. Thus the probability for lensing is almost negligible. However, while Q0957+561 (; Walsh, Carswell, & Weymann, 1979) is primarily lensed by a galaxy, the image separation is boosted by the cluster in which the lensing galaxy resides. This example implies that the environment of the lens galaxy may significantly affect the distribution of image separations in the range (Keeton, Christlein, & Zabludoff, 2000; Martel, Premadi, & Matzner, 2002). In addition, a secondary mass along the line of sight could affect strong lensing (Wambsganss, Bode, & Ostriker, 2005), and this also may enhance the lensing probabilities in this image separation range. Finally, there is a predicted contribution in this range from clusters; simple theoretical models that include transition of the property of lenses at (e.g., Oguri, 2002) predict that large-separation lenses due to clusters begin to dominate the total lensing probability. Therefore, the overall lensing probability distribution for is predicted to depend on the interplay of these two effects; the environmental effects and the emergence of cluster lenses. However, the overall lensing probability at is quite small, thus a large number of quasars is needed to investigate the lensing probability distribution. Indeed, even the current largest homogeneous sample of lensed quasars (Myers et al., 2003; Browne et al., 2003) contains only one lens in this image separation range.
In this paper, we present the discovery of two gravitationally lensed quasars, SDSS J100128.61+502756.9 (hereafter SDSS J1001+5027) and SDSS SDSS J120629.65+433217.6 (hereafter SDSS J1206+4332). These gravitational lenses were identified from an ongoing lens search using the data of the Sloan Digital Sky Survey (SDSS; York et al., 2000; Stoughton et al., 2002; Abazajian et al., 2003, 2004, 2005). Currently the SDSS contains more than 50,000 spectroscopically classified quasars; thus the SDSS provides the opportunity to construct the largest homogeneous lens catalog in existence. Indeed, new gravitationally lensed quasars have been found by using the SDSS (e.g., Inada et al., 2003a). In this paper, we describe photometric and spectroscopic observations of two new lens candidates and show that they are gravitational lenses. We model the lens systems and discuss the environments of the lens galaxies. We also compare the image separation distributions of lensed quasars in the SDSS (though still very preliminary because of the limited statistics) with a simple theoretical model.
This paper is organized as follows. In §2, we briefly describe our method of searching for lens candidates from the SDSS data. Section 3 presents the results of both photometric and spectroscopic follow-up observations, and §4 shows the result of lens modeling. Section 5 is devoted to a discussion of the environments of the lens galaxies. We also discuss the lensing probability distribution, which is shown in §6. We summarize our results in §7.
2 Selecting Candidates from the SDSS data
All gravitational lenses presented in this paper were selected as lens candidates from the SDSS, which is a survey to image of the sky. The SDSS also conducts spectroscopy of galaxies and quasars that are selected from the imaging data (Eisenstein et al., 2001; Strauss et al., 2002; Richards et al., 2002; Blanton et al., 2003). A dedicated 2.5-meter telescope at Apache Point Observatory (APO) is equipped with a multi-CCD camera (Gunn et al., 1998) with five optical broad bands centered at , , , , and Å (Fukugita et al., 1996; Stoughton et al., 2002). The imaging data are automatically reduced by the photometric pipeline (Lupton et al., 2001). The astrometric positions are accurate to about for sources brighter than (Pier et al., 2003), and the photometric errors are typically less than 0.03 magnitude (Hogg et al., 2001; Smith et al., 2002; Ivezić et al., 2004). The spectra cover – Å at a resolution of –.
We use spectroscopically classified quasars with to search for gravitational lens candidates. SDSS J1001+5027 and SDSS J1206+4332 are identified as lens candidates by our standard candidate selection algorithm (N. Inada et al., in preparation). This algorithm is based on the idea that the image of a quasar pair with a small separation appears to be more extended than that of single quasar, and characterizes the extent by the following SDSS image parameters: dev_L (the likelihood that the image of the object is fit by a de Vaucouleurs profile), exp_L (the likelihood by an exponential disk), and star_L (the likelihood by the point spread function). This algorithm has already found six new SDSS lenses (Inada et al., 2003a, 2005a, 2005b; Pindor et al., 2004, 2005; Oguri et al., 2004b) as well as all previously known gravitational lenses in the SDSS footprint. However, the possible second lensed components of the candidates we study in this paper were also recognized as separate astronomical objects in the SDSS imaging data because of the relatively large image separations (Pindor et al., 2003).
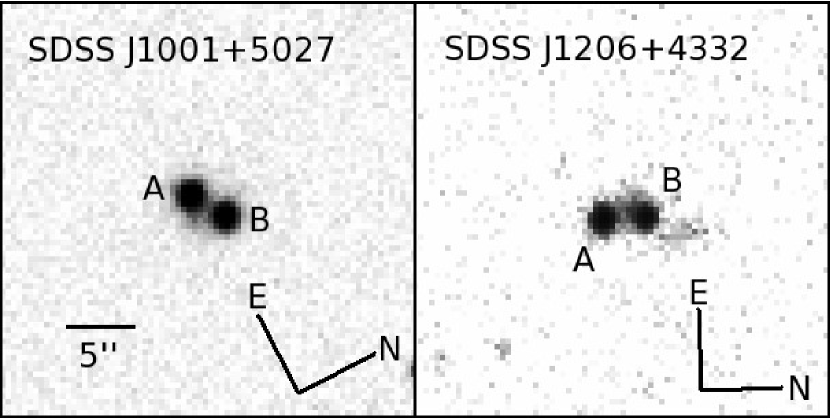
Figure 1 shows the SDSS -band images of the candidates. In both images, the seeing was , better than the typical seeing of SDSS images, (Abazajian et al., 2003). The Figure clearly shows two stellar components in each case; we designate the brighter ones as component A and the fainter ones as component B. Table 1 summarizes the result of the SDSS photometry of the components. In each system the components have colors similar to each other and the colors are consistent with that expected from quasars; this makes them excellent lens candidates.
3 Follow-up Observations
Follow-up spectroscopic observations were conducted on 2003 November 20 and 2004 June 21 with the Double Imaging Spectrograph (DIS) on the Astrophysical Research Consortium (ARC) 3.5-m telescope at APO. We used a slit in low (blue) or medium (red) resolution mode. The resolution is about . The final spectra cover the wavelength range of 3900 Å to 9400 Å. We aligned the slit along the direction joining the two images; since the separations between the images are large compared with the seeing size, extraction of the spectrum of each component was straightforward. The data were reduced using standard IRAF222IRAF is distributed by the National Optical Astronomy Observatories, which are operated by the Association of Universities for Research in Astronomy, Inc., under cooperative agreement with the National Science Foundation. reduction procedures.
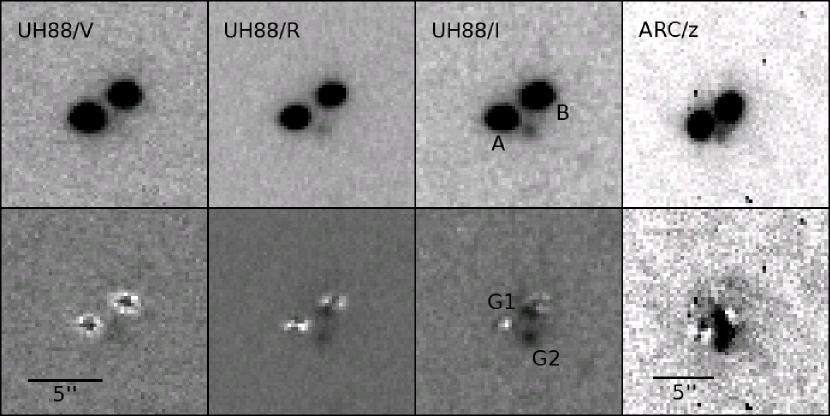
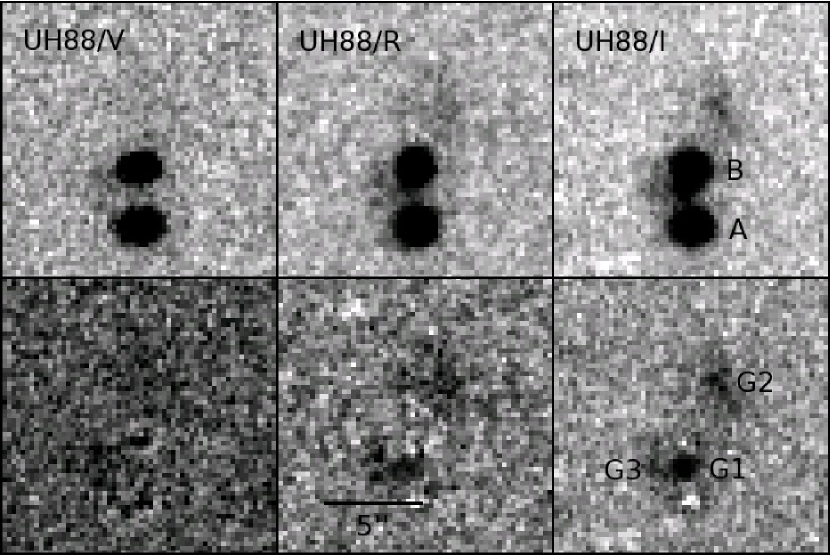
We also obtained deep images of the systems with the 8k mosaic CCD camera of the University of Hawaii 2.2-meter telescope (UH88) at Mauna Kea and with the Seaver Prototype Imaging Camera (SPIcam) of the ARC 3.5-m telescope. The UH88 imaging was conducted on 2004 May 23 and 25. We obtained -band images in the photometric nights; the exposure times were 360 seconds for each candidate and each band. The image scale was . We estimated the seeing as , better than the SDSS seeing size of . The ARC -band imaging was conducted on 2004 January 13. The exposure was 300 seconds, the seeing was , and the image scale was . Each frame was bias-subtracted and flat-field corrected. The magnitudes in the UH88 images were calibrated by the standard star PG 1528+062 (Landolt, 1992). Astrometry and photometry of the UH88 images are summarized in Table 2.
3.1 SDSS J1001+5027
Spectra and images of this object are shown in Figures 2 and 3, respectively. In Figure 2, both components show C IV, C III], and Mg II emission lines redshifted by . It is worth noting that the flux ratios (B/A) of the emission lines, particularly the C IV emission lines, are larger than that of the continuum; the equivalent widths of C IV emission lines are 56 Å and 76 Å for A and B, respectively. Such difference can be caused by the difference of the emission regions of continuum and broad emission lines combined with microlensing by stars. We find two extended objects near the quasar images (see Figure 3; the image separation is ). When subtracting a quasar component, we used a nearby star as a point-spread function (PSF) template. The objects, denoted by G1 and G2, have colors consistent with those of early-type galaxies at (Fukugita, Shimasaku, & Ichikawa, 1995). Since galaxy G1 is nearly colinear with the two quasar components, it is likely that G1 is the main contributor to the lens potential. However, galaxy G2 is also quite close to the lens system, and could affect the lens potential significantly. We note that component B could be reddened by the lens galaxy G1.
3.2 SDSS J1206+4332
The spectra of the two components shown in Figure 4 show Si IV, C IV, C III], and Mg II emission lines at the same wavelengths, which supports the idea that this is a gravitationally lensed quasar at . However, the flux ratios (B/A) of the emission lines are slightly smaller than that of the continuum; the equivalent widths of C IV emission lines are 69 Å and 53 Å for A and B, respectively. The images in Figure 5 clearly reveal the lensing galaxy G1 as well as two quasar components separated by , further supporting the lensing hypothesis. We also found other galaxies G2 and G3 near component B. These galaxies, particularly G2, may contribute to the lens potential to some extent. Indeed, both G1 and G2 are quite red (see Table 2) and are consistent with being high-redshift () early-type galaxies (Fukugita et al., 1995), while G3 is blue and thus may be a chance superposition of a local galaxy. There is strong Mg II absorption (equivalent width Å) at Å in the spectrum of component B. The redshift of the absorber is , consistent with the color of G1. Therefore the absorber may be associated with the lensing galaxy G1.
4 Lens Modeling
Although the lens systems appear quite complex, we will first attempt to model the lens systems with simple models. Specifically, we try models that describe G1 by a Singular Isothermal Ellipsoid (SIE), or Singular Isothermal Sphere (SIS) plus external shear. Even these simple models, however, have eight parameters (the galaxy position and , the Einstein ring radius , the ellipticity or shear , the position angle or , the source position and , and the flux of the quasar ) that is equal to the number of observational constraints from the UH88 imaging data (the image positions, the galaxy position, and fluxes of the images; see Table 2). Thus there are no degrees of freedom and in usual cases we will be able to find models that perfectly reproduce the observables. To fit the models, we use standard lens modeling techniques as implemented in the lensmodel software (Keeton, 2001).
SDSS J1001+5027 is well fitted by both the SIS plus shear and SIE models. The resulting fitting parameters are shown in Table 3. The ellipticity in the SIE model is similar to that of the light, though the position angle (measured East of North) is quite different from that of the light () measured from the UH88 image. In general the position angles of the light and lens models are aligned (Keeton, Kochanek, & Falco, 1998); therefore this result suggests that the external field, rather than the galaxy G1, is responsible for the quadrupole moment of the lens potential. The position angles in the models are rather close to the direction to G2. Since in general the position angle of external shear gives an idea of the direction to a main perturber, it seems that G2 significantly affects the lens models. We also predict the time delay as (A leads B), assuming a lens redshift of .
Fitting SDSS J1206+4332 by either SIS plus shear or SIE failed; the models yielded large chi-squares with no degrees of freedom, and the models required unnaturally large or . We also tried a SIE plus shear model, but the resulting fit was similarly poor. This implies that the lens system is too complicated to be described by such simple models. Thus we add G2, which is modeled by a SIS, as well as galaxy G1 modeled by SIE, in order to make the model more realistic. We derive best-fit models by changing the value of the Einstein radius of G2, (G2). We find that this “SIEG2” model fits the data well when , although the maximum value is slightly smaller than that inferred from the Faber-Jackson relation ( from the -band flux ratio, assuming G1 and G2 are at the same redshift). As a specific example, we show the best fit parameters for in Table 3. The position angle of galaxy G1 in the model () is in good agreement with that observed. The time delay is derived to be (A leads B), assuming the strong Mg II absorption system at is associated with the lens galaxy. Even if we decrease the value of (G2) up to , the time delay is affected only moderately; the time delay is predicted to be when .
In summary, lens modeling has revealed that neither system is simple. In particular, the secondary galaxies may play an important role in both lenses.
5 Lens Galaxy Environments
Lens galaxies of lensed quasars, particularly in systems with relatively large image separations (), commonly lie in groups or clusters (Keeton et al., 2000; Faure et al., 2004). Such “compound” lens systems include Q 0957+561 (Walsh et al., 1979), PG 1115+080 (Weymann et al., 1980), MG 2016+112 (Lawrence et al., 1984), RX J0911+0551 (Bade et al., 1997), MG 0751+2716 (Tonry & Kochanek, 1999), SDSS J0903+5028 (Johnston et al., 2003), CLASS B1608+656 (Fassnacht et al., 2004), B2108+213 (McKean et al., 2005), and HE 0435-1223 (Morgan et al., 2005). If dense environments of the lens galaxies are common, then they could affect strong lens studies in several ways (Keeton & Zabludoff, 2004). On the theoretical side, estimation of environmental effects remains controversial: While Keeton et al. (2000) and Holder & Schechter (2003) argued that the large fraction of lens systems should lie in dense environments and thus the environmental effects are significant, Dalal & Watson (2005) estimated using a halo occupation distribution that the typical values for the external convergence and shear are quite small. Although we have already seen in §3 and §4 that SDSS J1001+5027 and SDSS J1206+4332 have additional galaxies that likely affect the lens potential, it is important to check the larger field for hints of groups or clusters.
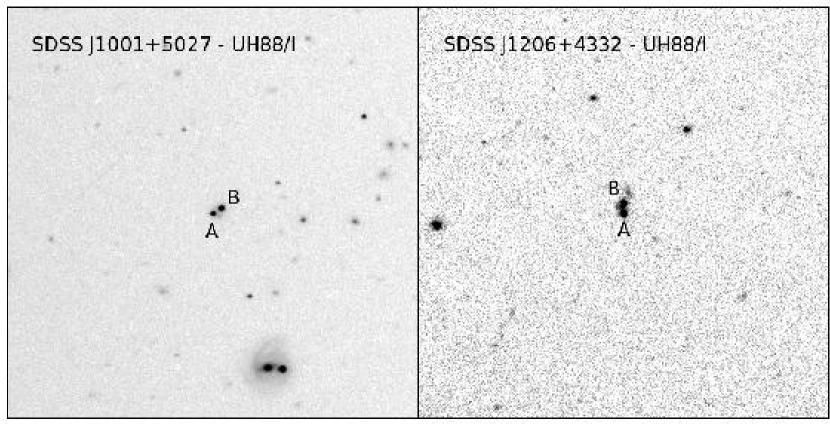
Figure 6 shows the fields around the lens systems obtained at UH88. We find many galaxies around SDSS J1001+5027, indicating that there may be a group or cluster along the line of sight. For SDSS J1206+4332, we cannot see any noticeable enhancement of the number of galaxies around the lens system, though there are several faint galaxies near the lens system.
To explore the environments further, we derived the number densities of galaxies around each lens system using the UH88 images. We perform object identifications using the Source Extractor algorithm (SExtractor; Bertin & Arnouts, 1996). We define galaxies as objects with SExtractor parameter CLASS_STAR smaller than 0.6 in the band image. Note that this star/galaxy separation criterion is successful only for objects with . We derive the number densities of galaxies as a function of -band magnitudes of the galaxies, which are shown in Figure 7. In the Figure, we compare the galaxy number densities within of each lens system with those of the background, estimated from galaxies more than away in each image after excluding the region near bright stars. The total areas of the backgrounds are thus 87.0 and 79.8 for SDSS J1001+5027 and SDSS J1206+4332, respectively. We find an enhancement of galaxy number densities for SDSS J1001+5027; the number densities of three magnitude bins show excesses by more than . On the other hand, the galaxy number count around SDSS J1226+4332 is consistent with that of the background.
Figure 8 shows a color-magnitude diagram of galaxies near SDSS J1001+5027 to study the origin of the enhancement of galaxy number densities. We find a weak ridge line at , suggesting the existence of a group or a cluster at , which is consistent with that of lens galaxies G1 and G2 estimated from their colors. We also plot the distribution of galaxies at , by making color cuts; , , and . We find that the galaxies are clustered North and West of the lens system, rather than distributed homogeneously (see also Figure 6). Thus the lens galaxy may lie in a group or a cluster that is located to the north-west of the lens; spectroscopic identifications of these galaxies as well as the lens galaxy should be undertaken.
6 Is the number of 3” lenses consistent with theory?
Thus far, 13 gravitationally lensed quasars have been discovered using the SDSS. In addition, we have recovered several previously known lensed quasar systems. Table Discovery of Two Gravitationally Lensed Quasars with Image Separations of 3 Arcseconds from the Sloan Digital Sky Survey summarizes the current status of our lens search in the SDSS. Note that limitations of follow-up time have forced us to focus on the SDSS spectroscopic sample of quasars333The photometric quasar sample (Richards et al., 2004) has an order of magnitude more quasars than the spectroscopic sample, and thus is expected to contain many more lenses.. Thus the list does not contain lenses that do not have SDSS spectra (e.g., APM 08279+5255; see Pindor et al., 2003). The Table does not contain SDSS J1402+6321 (Bolton et al., 2005) either, since the redshift () is below our criterion for the quasar sample (see discussion below). Among gravitational lenses in the Table, SDSS J1004+4112 and Q 0957+561 were selected by searching around each quasar for stellar objects that have similar colors as the quasar itself (Oguri et al., 2004a; Hennawi, 2004), and the rest were successfully selected by our standard candidate selection algorithm (see §2) though the first identifications of some of the candidates were made by different algorithms. An exception is SDSS J0903+5028 (Johnston et al., 2003) which was targeted as a luminous red galaxy (Eisenstein et al., 2001) because of the bright lens galaxy; however, we include this system in the statistical analysis below, since the quasar would have been targeted as a high-redshift quasar if it had not been obscured by the foreground lens galaxy (Richards et al., 2002). The Table shows that we have discovered a relatively large number of lenses. We note that our current lens sample shown in Table Discovery of Two Gravitationally Lensed Quasars with Image Separations of 3 Arcseconds from the Sloan Digital Sky Survey is quite incomplete444We note that our follow-up observations are biased against discovering lensed quasars with separations because of poor seeing in many follow-up observations. This mostly explains the large discrepancy between theory and observation at the image separation range., and that future follow-up observations would increase the number of lenses even in the current quasar sample. Therefore we now calculate the expected lensing probability in the SDSS quasar sample and compare it with the number of lenses in the sample. In particular, we neglect the contribution of lens galaxy environments, as has normally been done, to see whether the assumption is still valid or not. In computing the lensing probability, we assume a spatially flat universe ().
We compute the lensing probability distribution along the lines described by Turner, Ostriker, & Gott (1984). The lens galaxies are modeled by SIS , where is the velocity dispersion of the lens galaxy. We adopt the velocity function of early-type galaxies determined from SDSS galaxies at (Sheth et al., 2003; Bernardi et al., 2005; Mitchell et al., 2005), and neglect the redshift evolution (i.e., we assume that the velocity function is constant in comoving units). The use of the velocity function of early-type galaxies is sufficient for our calculation because at lensing by early-type galaxies is dominant (Turner et al., 1984). We need also to incorporate the selection function of the SDSS lens search; which we do in a preliminary way by making the following assumptions. First, we use the magnification factor of the brighter image, , where is the Einstein radius and is the position of the source relative to the lens galaxy, to compute the magnification bias, because at two lensed components are well separated in the SDSS data. Although we may have an alternative choice of using the magnification factor of the fainter image, we adopt to calculate the upper limit of the lensing probability; thus the actual lensing rate at might be smaller than our calculation555Note that at smaller separation () our computation is expected to underestimate the lensing probability because at such small separations lensed components are not decomposed and thus the magnification factor of the two images is more appropriate.. Next, for the limiting bright-to-faint flux ratio we assume ; this is justified because all lenses in Table Discovery of Two Gravitationally Lensed Quasars with Image Separations of 3 Arcseconds from the Sloan Digital Sky Survey satisfy this condition. Lensing probabilities calculated with this selection function represent an upper limit at relatively large image separation .
To calculate the expected number of lensed quasars in the current SDSS quasar sample, we need the luminosity function of quasars as well as the redshift and magnitude distributions of the quasar sample. We adopt a sample of quasars at . The sample is constructed in the same way as in Oguri et al. (2004a). We did not search for lensed quasars at as low-redshift quasars are intrinsically extended, and we do not use high-redshift quasar () sample because it contains a significant fraction of objects whose spectra were misidentified by the SDSS spectroscopic pipeline (c.f., discussion in Schneider et al., 2003). The redshift distribution is similar to that shown in Oguri et al. (2004a). For the luminosity function of quasars, we use what is called LF1 in Oguri et al. (2004a), which has a faint end slope of and a bright end slope of () or ().
The result is shown in Figure 9. As seen, the number of lenses already exceeds the theoretical expectations, when we adopt the standard value of the cosmological constant, . The situation is similar if we increase to . In terms of the constraint on the cosmological constant, the excess in the bin centered at is described as (68% confidence limit) assuming a Poisson distribution, which is highly inconsistent with recent measurements of the cosmological constant with errors of less than 10% (e.g., Tegmark et al., 2004). We emphasis that our current lens sample is quite incomplete; indeed, currently we have several quasar pairs with the same redshifts which could also be gravitational lenses (Hennawi, 2004), which need deep imaging to find the putative lens galaxies. Thus observations of these quasar pairs as well as lens candidates should be conducted, which might make the discrepancy even larger. Such an excess may indicate that our simple treatment of lensing statistics is inaccurate and that we need to include other effects.
7 Summary
We report the discovery of two gravitationally lensed quasars, SDSS J1001+5027 and SDSS J1206+4332. The systems were identified as new lens candidates in the SDSS, and confirmed as lenses by spectroscopic and imaging observations at the ARC 3.5m and the UH88 telescope. SDSS J1001+5027 is a lensed quasar at , and consists of two lensed images separated by . SDSS J1206+4332 is a lensed quasar at , and consists of two lensed images separated by . In each system we have identified the galaxy responsible for the lensing.
We have found that the lens systems are complicated. The imaging data clearly show other galaxies that are very close to the main lens galaxies. The lens modeling has shown that these galaxies affect the lens potentials significantly. We have examined the wide field images, which show an enhancement of the galaxy number density within of SDSS J1001+5027. Spectroscopic follow-up observations are needed to see if the group/cluster () is actually associated with the lens galaxy.
Although the SDSS lens survey is ongoing, we have made a preliminary comparison of theoretical lensing probability distributions with the observed distribution. We have found that the number of lenses with already exceeds the theoretical expectations. We still have many lens candidates with that remain to be observed (Hennawi, 2004); if some of them turn out to be true gravitational lenses, the conflict will become even stronger. This excess may be caused by external convergence and shear fields which we have not taken into account in our calculation. Basically, external shear broadens the distribution of image separations for a given mass of a lens object (e.g., Huterer, Keeton, & Ma, 2005). This broadening is enough to enhance the lensing probability at because the lensing probability at the image separation region is a strong function of image separations. More significant enhancement may be achieved by external convergence, since it increases both image separation and lensing probability. Indeed, among five intermediate-separation lenses in Table Discovery of Two Gravitationally Lensed Quasars with Image Separations of 3 Arcseconds from the Sloan Digital Sky Survey, two lens systems (RX J0911+0551 and Q 0957+561) lie in clusters, and two other lens systems (SDSS J0903+5028 and SDSS J1001+5027) also appear to lie in dense environments. In addition, the two lens systems reported in this paper are complex in the sense that galaxies very close to the main lens galaxies affect the lens potentials. Other possible systematic effects include triaxiality of lenses (Oguri & Keeton, 2004) and massive substructures (Cohn & Kochanek, 2004). In either case, lens statistics at this image separation should be done with caution; simple models that consider only isolated single lens objects can be misleading.
References
- Abazajian et al. (2003) Abazajian, K., et al. 2003, AJ, 126, 2081
- Abazajian et al. (2004) Abazajian, K., et al. 2004, AJ, 128, 502
- Abazajian et al. (2005) Abazajian, K., et al. 2005, AJ, in press (astro-ph/0410239)
- Bade et al. (1997) Bade, N., Siebert, J., Lopez, S., Voges, W., & Reimers, D. 1997, A&A, 317, L13
- Bernardi et al. (2005) Bernardi, M., et al. 2005, in preparation
- Bertin & Arnouts (1996) Bertin, E., & Arnouts, S. 1996, A&AS, 117, 393
- Blanton et al. (2003) Blanton, M. R., Lin, H., Lupton, R. H., Maley, F. M., Young, N., Zehavi, I., & Loveday, J. 2003, AJ, 125, 2276
- Bolton et al. (2005) Bolton, A. S., Burles, S., Koopmans, L. V. E., Treu, T., & Moustakas, L. A. 2005, ApJ, submitted (astro-ph/0410425)
- Browne et al. (2003) Browne, I. W. A., et al. 2003, MNRAS, 341, 13
- Burles et al. (2005) Burles, S., et al. 2005, in preparation
- Cohn & Kochanek (2004) Cohn, J. D., & Kochanek, C. S. 2004, ApJ, 608, 25
- Dalal & Watson (2005) Dalal, N., & Watson, C. R. 2005, ApJ, submitted (astro-ph/0409483)
- Eisenstein et al. (2001) Eisenstein, D. J., et al. 2001, AJ, 122, 2267
- Fassnacht et al. (2004) Fassnacht, C., et al. 2004, in Proceedings of IAU Symposium 225 “Impact of Gravitational Lensing on Cosmology”, eds. Y. Mellier and G. Meylan, in press (astro-ph/0409086)
- Faure et al. (2004) Faure, C., Alloin, D., Kneib, J.-P., & Courbin, F. 2004, astro-ph/0405521
- Fukugita et al. (1996) Fukugita, M., Ichikawa, T., Gunn, J. E., Doi, M., Shimasaku, K., & Schneider, D. P. 1996, AJ, 111, 1748
- Fukugita et al. (1995) Fukugita, M., Shimasaku, K., & Ichikawa, T. 1995, PASP, 107, 945
- Gunn et al. (1998) Gunn, J. E., et al. 1998, AJ, 116, 3040
- Hennawi (2004) Hennawi, J. F., 2004, PhD thesis, Princeton University
- Hogg et al. (2001) Hogg, D. W., Finkbeiner, D. P., Schlegel, D. J., & Gunn, J. E. 2001, AJ, 122, 2129
- Holder & Schechter (2003) Holder, G. P., & Schechter, P. L. 2003, ApJ, 589, 688
- Huterer, Keeton, & Ma (2005) Huterer, D., Keeton, C., & Ma, C. 2005, ApJ, submitted (astro-ph/0405040)
- Inada et al. (2003a) Inada, N., et al. 2003a, AJ, 126, 666
- Inada et al. (2003b) Inada, N., et al. 2003b, Nature, 426, 810
- Inada et al. (2005a) Inada, N., et al. 2005a, AJ, submitted
- Inada et al. (2005b) Inada, N., et al. 2005b, AJ, submitted
- Ivezić et al. (2004) Ivezić, Ž., et al. 2004, AN, 325, 583
- Johnston et al. (2003) Johnston, D. E., et al. 2003, AJ, 126, 2281
- Keeton (2001) Keeton, C. R. 2001, preprint (astro-ph/0102340)
- Keeton et al. (2000) Keeton, C. R., Christlein, D., & Zabludoff, A. I. 2000, ApJ, 545, 129
- Keeton et al. (1998) Keeton, C. R., Kochanek, C. S., & Falco, E. E. 1998, ApJ, 509, 561
- Keeton & Zabludoff (2004) Keeton, C. R., & Zabludoff, A. I. 2004, ApJ, 612, 660
- Landolt (1992) Landolt, A. U. 1992, AJ, 104, 340
- Lawrence et al. (1984) Lawrence, C. R., Schneider, D. P., Schmidt, M., Bennett, C. L., Hewitt, J. N., Burke, B. F., Turner, E. L., & Gunn, J. E. 1984, Science, 223, 46
- Lupton et al. (2001) Lupton, R., Gunn, J. E., Ivezić, Z., Knapp, G. R., Kent, S., & Yasuda, N. 2001, in ASP Conf. Ser. 238, Astronomical Data Analysis Software and Systems X, ed. F. R. Harnden, Jr., F. A. Primini, and H. E. Payne (San Francisco: Astr. Soc. Pac.), p. 269 (astro-ph/0101420)
- Martel et al. (2002) Martel, H., Premadi, P., & Matzner, R. 2002, ApJ, 570, 17
- McKean et al. (2005) McKean, J. P., et al. 2005, MNRAS, in press (astro-ph/0410554)
- Mitchell et al. (2005) Mitchell, J. L., Keeton, C. R., Frieman, J. A, & Sheth, R. K. 2005, ApJ, in press (astro-ph/0401138)
- Morgan et al. (2003) Morgan, N. D., Snyder, J. A., & Reens, L. H. 2003, AJ, 126, 2145
- Morgan et al. (2005) Morgan, N. D., Kochanek, C. S., Pevunova, O., & Schechter, P. L. 2005, AJ, submitted (astro-ph/0410614)
- Myers et al. (2003) Myers, S. T., et al. 2003, MNRAS, 341, 1
- Oguri (2002) Oguri, M. 2002, ApJ, 580, 2
- Oguri et al. (2004a) Oguri, M., et al. 2004a, ApJ, 605, 78
- Oguri et al. (2004b) Oguri, M., et al. 2004b, PASJ, 56, 399
- Oguri & Keeton (2004) Oguri, M., & Keeton, C. R. 2004, ApJ, 610, 663
- Oscoz et al. (1997) Oscoz, A., Serra-Ricart, M., Mediavilla, E., Buitrago, J., & Goicoechea, L. J. 1997, ApJ, 491, L7
- Pier et al. (2003) Pier, J. R., Munn, J. A., Hindsley, R. B., Hennessy, G. S., Kent, S. M., Lupton, R. H., & Ivezić, Ž. 2003, AJ, 125, 1559
- Pindor et al. (2003) Pindor, B., Turner, E. L., Lupton, R. H., & Brinkmann, J. 2003, AJ, 125, 2325
- Pindor et al. (2004) Pindor, B., et al. 2004, AJ, 127, 1318
- Pindor et al. (2005) Pindor, B., et al. 2005, in preparation
- Richards et al. (2002) Richards, G. T., et al. 2002, AJ, 123, 2945
- Richards et al. (2004) Richards, G. T., et al. 2004, ApJS, 155, 257
- Schneider et al. (2003) Schneider, D. P., et al. 2003, AJ, 126, 2579
- Sheth et al. (2003) Sheth, R. K., et al. 2003, ApJ, 594, 225
- Smith et al. (2002) Smith, J. A., et al. 2002, AJ, 123, 2121
- Stoughton et al. (2002) Stoughton, C., et al. 2002, AJ, 123, 485
- Strauss et al. (2002) Strauss, M. A., et al. 2002, AJ, 124, 1810
- Surdej et al. (1987) Surdej, J., Swings, J.-P., Magain, P., Courvoisier, T. J.-L., & Borgeest, U. 1987, Nature, 695, 696
- Tegmark et al. (2004) Tegmark, M., et al. 2004, Phys. Rev. D, 69, 103501
- Tonry & Kochanek (1999) Tonry, J. L., & Kochanek, C. S. 1999, AJ, 117, 2034
- Turner et al. (1984) Turner, E. L., Ostriker, J. P., & Gott, J. R. 1984, ApJ, 284, 1
- Walsh et al. (1979) Walsh, D., Carswell, R. F., & Weymann, R. J. 1979, Nature, 279, 381
- Weymann et al. (1980) Weymann, R. J., et al. 1980, Nature, 285, 641
- York et al. (2000) York, D. G., et al. 2000, AJ, 120, 1579
- Wambsganss et al. (2005) Wambsganss, J., Bode, P., & Ostriker, J. P. 2005, ApJ, submitted (astro-ph/0405147)
| Object | R.A. (J2000.0) | Dec. (J2000.0) | |||||
|---|---|---|---|---|---|---|---|
| SDSS J1001+5027 | |||||||
| A | 10 01 28.61 | +50 27 56.9 | |||||
| B | 10 01 28.35 | +50 27 58.5 | |||||
| SDSS J1206+4332 | |||||||
| A | 12 06 29.65 | 43 32 17.6 | |||||
| B | 12 06 29.65 | 43 32 20.6 | |||||
Note. — PSF magnitudes returned by the SDSS photometric pipeline are shown. Reddening corrections are not applied.
| Object | [arcsec]aaPositions relative to the brighter quasar components are presented. The positive directions of and are defined by West and North, respectively. Error bars do not include the error of the image scale. | [arcsec]aaPositions relative to the brighter quasar components are presented. The positive directions of and are defined by West and North, respectively. Error bars do not include the error of the image scale. | bbError bars do not include the zero-point error of mag. | bbError bars do not include the zero-point error of mag. | bbError bars do not include the zero-point error of mag. |
|---|---|---|---|---|---|
| SDSS J1001+5027 | |||||
| A | |||||
| B | |||||
| G1 | |||||
| G2 | |||||
| G1+G2ccIn the -band image it was difficult to decompose G1 and G2 because of the faintness if the image, thus we show the total magnitude of these two galaxies. | |||||
| SDSS J1206+4332 | |||||
| A | |||||
| B | |||||
| G1 | |||||
| G2 | |||||
| G3 | |||||
| Model | [arcsec] | or | or [deg]aaEach position angle is measured East of North. | [day]bbFor the redshifts of lens galaxies, we assumed a lens redshift of for SDSS J1001+5027, and the redshift of strong Mg II absorption, , for SDSS J1206+4332. We also assumed and , but the values are quite insensitive to these cosmological parameters. |
|---|---|---|---|---|
| SDSS J1001+5027 | ||||
| SISshear | ||||
| SIE | ||||
| SDSS J1206+4332 | ||||
| SIE+G2ccThe Einstein radius of G2, (G2), is fixed to . | ||||
Note. — See §4 for details of the lens models adopted here.
| Name | aaThe maximum separation between multiple images. | Comments | Ref. | ||
|---|---|---|---|---|---|
| Q 0142100 | previously known lens | 1 | |||
| SDSS J02460825 | 2 | ||||
| SDSS J0903+5028 | targeted as a galaxy | 3 | |||
| RX J0911+0551 | previously known lens | 4 | |||
| SBS 0909+523 | previously known lens | 5 | |||
| SDSS J0924+0219 | 6 | ||||
| Q 0957+561 | previously known lens | 7 | |||
| SDSS J1001+5027 | 8 | ||||
| SDSS J1004+4112 | large-separation lens | 9 | |||
| SDSS J1021+4913 | 10 | ||||
| PG 1115+080 | previously known lens | 11 | |||
| SDSS J1138+0314 | 12 | ||||
| SDSS J1155+6346 | 13 | ||||
| SDSS J1206+4332 | 8 | ||||
| SDSS J12260006 | 14 | ||||
| SDSS J1335+0118 | 15 | ||||
| SDSS J1650+4251 | 16 |
Note. — The SDSS strongly lensed quasar survey is still ongoing, and we have many other candidates requiring follow-up observations. Therefore, this list is far from complete. This list includes only lenses that have SDSS spectra.
References. — (1) Surdej et al. 1987; (2) Inada et al. 2005b; (3) Johnston et al. 2003; (4) Bade et al. 1997; (5) Oscoz et al. 1997; (6) Inada et al. 2003a; (7) Walsh et al. 1979; (8) this paper; (9) Inada et al. 2003b; (10) Pindor et al. 2005; (11) Weymann et al. 1980; (12) Burles et al. 2005; (13) Pindor et al. 2004; (14) Inada et al. 2005a; (15) Oguri et al. 2004b; (16) Morgan, Snyder, & Reens 2003