Abstract
This review discusses the current status of supermassive black hole research, as seen from a purely observational standpoint. Since the early ’90s, rapid technological advances, most notably the launch of the Hubble Space Telescope, the commissioning of the VLBA and improvements in near-infrared speckle imaging techniques, have not only given us incontrovertible proof of the existence of supermassive black holes, but have unveiled fundamental connections between the mass of the central singularity and the global properties of the host galaxy. It is thanks to these observations that we are now, for the first time, in a position to understand the origin, evolution and cosmic relevance of these fascinating objects.
Section 1 INTRODUCTION
The menagerie of Active Galactic Nuclei (AGNs) is as eclectic as could be imagined. Quasars, radio galaxies, Seyfert nuclei, Blazars, LINERS, BL-Lac objects, to name a few, are set apart from each other both by the detailed character of the activity which takes place in the nuclei, and by the traits of the galaxies which host them. Underneath this apparent diversity, however, lie three revealing common properties. First, AGNs are extremely compact. Flux variability – a staple of all AGNs – confines AGNs to within the distance light can travel in a typical variability timescale. In many cases, X-ray variability is observed on time scales of less than a day, and flares on time scales of minutes (e.g. MCG 6-30-15, McHardy 1988). Second, the spectral energy distribution is decisively non-stellar: roughly speaking, AGNs’ power per unit logarithmic frequency interval is constant over seven decades in frequency, while stars emit nearly all of their power in a frequency range a mere factor three wide. Third, AGNs must be very massive, a conclusion supported by two independent arguments. AGNs’ bolometric luminosities are astoundingly large: at least comparable, and often several orders of magnitude larger than the luminosity of the entire surrounding galaxy. Masses in excess of are needed for an AGN not to become unbound by its own outpouring of energy. Furthermore, according to our best estimates, AGNs remain active for upward of years: during this period, an enormous amount of material, well over a million solar masses, must be consumed to sustain their luminosity, even assuming a very high efficiency of energy production.
Taken together, these considerations lead to the inescapable conclusion that the source of the nuclear activity is accretion onto a central, supermassive black hole (SBH; Rees 1984). Indeed, evidence of a relativistic regime is betrayed, at least in some AGNs, by superluminal motions of the radio jets, and by the broadening of low excitation X-ray emission lines (see § 8.2). In our standard picture, the accreted matter is thought to be confined in an accretion disk, or more generally optically thick plasma, glowing brightly at ultraviolet (UV) and perhaps soft X-ray wavelengths. Medium and hard X-ray emission is produced by inverse Compton scattering in a corona of optically thin plasma which might surround or “sandwich” the disk. Clouds of line-emitting gas move at high velocity around this complex core and are in turn surrounded by an obscuring torus or warped disk of gas and dust, with a sea of electrons permeating the volume within and above the torus. What is commonly referred to as the ‘AGN paradigm’ states that the detailed character of the nuclear activity can always be reproduced by finely tweaking, rather than completely revising, this basic picture. Changes in the angle at which the AGN is observed, in the spin and/or mass of the black hole, in the accretion rate, and in the modalities with which the surrounding interstellar medium interacts with the emerging AGN flux, account for the varied types found in the AGN zoo.
Although the black hole paradigm originated and evolved exclusively within the AGN context, modern SBH searches have targeted almost exclusively quiescent or weakly active nearby galaxies - and it’s on these galaxies that this review will mainly focus. There are two good reasons for this. First, “dormant” SBHs are expected to be found in the nuclei of quiescent galaxies. The cumulative SBH mass density needed to explain the energetics of high redshift powerful quasars falls short, by at least two orders of magnitudes, to the one required to power local AGNs (Padovani, Burg & Edelson 1990; Ferrarese 2002a). The unaccounted SBHs must therefore reside in local, quiescent galaxies. Second, the telltale Keplerian dynamical signature imprinted by a central compact object on the motion of the surrounding gas and stars can only be resolved in the most nearby galactic centers and, unfortunately, most nearby galaxies are not powerful AGNs. In passing, it must be mentioned that although it is now accepted that SBH are present in the nuclei of quiescent galaxies, we still do not completely understand how the two coexist; in view of the abundant supply of gas and dust in galactic centers, preventing a SBH from accreting and immediately producing an AGN is not a simple task (Fabian & Canizares 1988). Indeed, a definitive answer to this dilemma has yet to be found (Rees et al. 1982; Narayan & Yi 1994; Blandford & Begelman 1999; di Matteo et al. 1999).
The most recent review on SBHs was published in 1995 (Kormendy & Richstone 1995). Since then, progress in this field has been so rapid that any attempt to summarize it was destined to be outdated by publication time. The number of local SBH detections has gone from a few in 1995 to almost three dozens in 2004. Strong connections between SBHs and their host galaxies have emerged. Formation and evolutionary scenarios have become more tightly constrained. After such feverish activity, we are now at a turning point, when progress is once again slowing down as observational facilities are been exploited to their limit.
This review will be concerned exclusively with supermassive black holes. There is controversial evidence that “intermediate” mass black holes (IBHs), bridging the gap between the stellar mass (a few to a few tens of solar masses) and supermassive (over a million solar masses) varieties, might exist in the off-nuclear regions of some star-forming galaxies and perhaps at the centers of globular clusters. An excellent review of intermediate mass black holes is given by Miller & Colbert (2004), and we will not discuss the issue any further. Some useful formalism will be introduced in § 2. We will then present a brief historical overview of the subject (§ 3). Although most reviews dispense with it, the history of SBHs is a fascinating example of the long trail of tentative steps, missed clues, and heterogeneous research areas which ultimately need to congeal for seemingly unforeseen and revolutionary ideas to emerge. Readers who are familiar with this history are invited to skip to § 4; readers desiring a comprehensive history of the theoretical developments should refer to Thorne’s book Black Holes and Time Warps, Einstein’s Outrageous Legacy (1994). We will then move on to discuss the several methods which can be used to measure SBH masses (§ 4- 8), with particular emphasis on resolved stellar and gas dynamical studies carried out with the Hubble Space Telescope. Scaling relation, linking SBH masses to the overall properties of the host galaxies, are discussed in § 10. SBH demographics, from high redshift quasars to local galaxies, is discussed in § 10. Finally, in § 11 we will discuss the most pressing open questions and the issues on which future progress is most likely to be made.
Section 2 SOME USEFUL FORMALISM
For convenience, we present in this section some terminology and equations which will recur in the remainder of this review.
An important measure of the accretion rate onto a BH of mass is provided by the Eddington luminosity, i.e. the luminosity at which radiation pressure on free electrons balances the force of gravity. Because the force due to radiation ,ure has exactly the same inverse square dependence on distance as gravity, but does not depend on mass, is independent of distance but depends on :
| (1) |
where is the proton rest mass and is the Thomson cross section. Above the Eddington luminosity, the source is unable to maintain steady spherical accretion (although the presence of magnetic fields can considerably complicate the picture, Begelman 2001).
Related to the Eddington luminosity is the Salpeter time
| (2) |
can be interpreted in two, equivalent ways. It would take a black hole radiating at the Eddington luminosity a time to dissipate its entire rest mass. Also, the luminosity (and mass) of a black hole accreting at the Eddington rate with constant will increase exponentially, with e-folding time . is the efficiency of conversion of mass into energy, and depends on the spin of the black hole, varying between 6% if the black hole is not spinning, and 42% if the black hole is maximally spinning.
The “boundary” of a (non-rotating) black hole of mass is a spherical surface called the event horizon, the radius of which is given by the Schwarzschild (or gravitational) radius:
| (3) |
At the Schwarzschild radius the gravitational time dilation goes to infinity and lengths are contracted to zero.
The radius of the last stable orbit, inside which material plunges into the black hole, depends on the black hole angular momentum, being smaller for spinning Kerr black holes. For a non rotating Schwarzschild black hole:
| (4) |
The photon sphere, of radius , is defined as the surface at which gravity bends the path of photons to such an extent that light orbits the hole circularly.
For a Kerr (rotating) black hole there are two relevant surfaces, the event horizon, and the static surface, which completely encloses it. At the static surface, space-time is flowing at the speed of light, meaning that a particle would need to move at the speed of light in a direction opposite to the rotation of the hole in order to be stationary. In the region of space within the static surface and the event horizon, called the ergosphere, the rotating black hole drags space around with it (frame dragging) in such a way that all objects must corrotate with the black hole. For a maximally rotating black hole, the radius of the last stable orbit is
| (5) |
Because of the dependence of on the black hole spin, the latter can be inferred provided a measure of the former, and an estimate of the black hole mass, are available, for instance from rapid flux variability (see also § 8.3).
In the case of supermassive black holes inhabiting galactic nuclei, the “sphere of influence” is defined as the region of space within which the gravitational potential of the SBH dominates over that of the surrounding stars. Its radius is given by:
| (6) |
where is the velocity dispersion of the surrounding stellar population. Beyond a few thousand Schwarzschild radii from the central SBH, but within the sphere of influence, the motion of stars and gas is predominantly Keplerian (relativistic effects are minimal), with a component due to the combined gravitational potential of stars, dust, gas, dark matter, and anything else contributing mass to within that region. Beyond the sphere of influence, the gravitational dominance of the SBH quickly vanishes.
Section 3 A BRIEF HISTORICAL OVERVIEW
There is perhaps no better way to describe the long chain of events that culminated, in the mid 1960s, in postulating the existence of black holes than the famous quote from Albert Szent-Gyorgyi: “Research is to see what everybody else has seen, and to think what nobody else has thought.”
Although Newton theorized that gravity acts on light, it was the British natural philosopher Reverend John Mitchell who pursued the implications of this idea. In a paper delivered to the Royal Society in London in 1783, Mitchell envisioned the existence of “dark stars”. He realized that the escape velocity would become larger if the star radius were to be increased while maintaining its density constant. Eventually, the escape velocity would exceed the velocity of light: such star would become invisible to a distant observer, since the “corpuscles” of light, after librating some distance above the star’s surface in their attempt to escape, would inevitably be pulled back. Thirteen years later, and with no mention of Mitchell’s work, Pierre Laplace published a very similar argument in Exposition du Systeme du Monde, only to drop it in the 3rd edition of the book. The reason for the omission is not clear, but it might have been prompted by the gaining popularity of Christian Huygen’s ondulatory theory of light – in view of Young and Fresnel’s experiments – and the lack of a physical understanding of how gravity and waves intermingle.
Such understanding had to wait until the day, in 1915, when Albert Einstein delivered a lecture on his theory of general relativity to the German Academy of Science in Berlin. Within a month of the publication of Einstein’s work, Karl Schwarzschild, while serving in the German Army on the Russian front, solved Einstein’s field equations for a non-rotating spherical star. His solution (1916a,b) for the spacetime geometry, now known as the Schwarzschild metric, enabled him to calculate, for a star of a given mass, the critical radius at which light emitted from the surface would have an infinite gravitational redshift, and thereby infinite time dilation. Such star, Schwarzschild concluded, would be undetectable by an external observer at any distance from the star – a proposition received with considerable skepticism by most theorist of the time, including Einstein himself.
Whether a real star could ever reach this critical radius was addressed quite serendipitously in the 1930s. During the voyage from Madras, India, to England to begin graduate study at Cambridge University, nineteen year old Subrahmanyan Chandrasekhar set himself the task of deriving the structure of white dwarfs, whose existence had been known since the very early days of the Hertzprung-Russell diagram. By using the theory of stellar polytropes (Eddington, 1930) in combination with Fowler’s (1926) recently published equation of state for a non-relativistic degenerate electron gas, Chandrasekhar demonstrated that the density (or radius) of a white dwarf is a very simple function of its mass. After calculating the central density for Sirius B, however, Chandrasekhar realized that white dwarfs of mass 1 reach high enough densities in their cores for the electron gas to becomes fully relativistic, invalidating Fowler’s equation of state (cf Thorne 1994 for a thorough discussion). By allowing for the relativistic increase in the electrons’ momentum, Chandrasekhar was able to deduce, though not prove, that the dependence of pressure on electron density softens from Fowler’s to . This change has drastic consequences – so bizarre, in fact, to be publicly ridiculed by the most influential physicist of the time, sir Arthur Eddington. A fully relativistic polytropic gas can only be in equilibrium for a mass of precisely .91 111Subsequent improved calculations have shown this mass to be 1.4 , e.g. Harwit (1998).– no matter what its radius or density.
In his 1931 paper, Chandrasekhar interpreted this value – now known as the “Chandrasekhar limit” – as the maximum mass attainable by a white dwarf as it approaches fully relativistic degenerate conditions. In 1932, the russian physicist Lev Davidovich Landau – who had reached a conclusion analogous to Chandrasekhar’s in the context of degenerate neutron stars – went a step further. He clearly stated that addition of matter over the critical limit would lead to unavoidable collapse: the star would shrink in free fall to a point. This remarkable result has a simple physical explanation. For a star of small enough mass – whether it is composed of a degenerate gas of electrons or neutrons – the quantum pressure due to Pauli’s exclusion principle can always be brought into balance with gravity by increasing the density via contraction (according to Fowler’s equation). As the star becomes more massive, however, further contractions will eventually lead to high enough core densities to bring the kinetic energy at the top of the Fermi sea to levels comparable to the rest energy of the particles; the gas then becomes relativistic. Because of the softening in the equation of state that follows the transition into the relativistic regime, the increase in quantum pressure which derives from further contraction always fall short of balancing gravity: the contraction cannot be halted.
Following these pioneering works, a detailed study of the equilibrium configuration was published by Chandrasekhar (1935) for white dwarfs, and Oppenheimer & Volkoff (1938) for neutron stars. In 1939, Oppenheimer & Snyder wrote what was destined to become the foundation for the new field of physics concerned with gravitational singularities. In “On Continued Gravitational Contraction”, they provided a fully analytical solution for the collapse of a cloud of gas, and drew attention to how collapsed objects are a unique testbed for a fully relativistic theory of gravitation. By applying the general relativistic field equations to a sphere of cold neutrons, Oppenheimer & Snyder concluded that “when all thermonuclear sources of energy are exhausted a sufficiently heavy star will collapse. Unless fission due to rotation, the radiation of mass, or the blowing off of mass by radiation, reduce the star’s mass to the order of that of the Sun, this contraction will continue indefinitely […] The total time of collapse for an object comoving with the stellar matter is finite [..] The star thus tends to close itself off from any communication with a distant observer; only its gravitational field persists”. Black holes – a term coined by Princeton theorist John Wheeler only in 1960 – were effectively born.
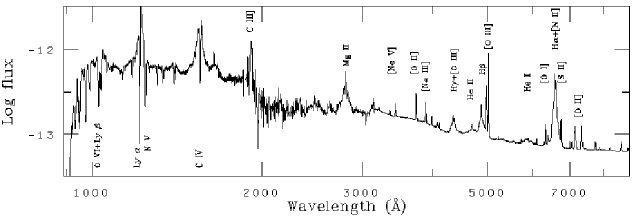
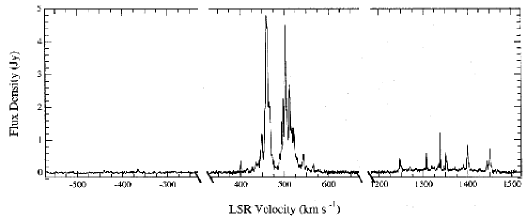
Meanwhile, observational work on black holes was lagging behind the theory by at least a decade. Although unrealized at the time, the very first data supporting the existence of black holes – not a few, but millions of solar masses – had been accumulating since the early ’40s. In a 1943 paper titled “Nuclear Emission in Spiral Nebulae”, Carl Seyfert identified 12 galaxies with highly unusual nuclei. Unlike the centers of normal galaxies which contain only old stars, these nuclei had “high excitation nuclear emission lines superposed on a normal G-type spectrum” (Figure 1). Seyfert remarked that “profiles of the emission lines show that the lines are broadened, presumably by Doppler motion, by amounts up to 8500 km s-1 for the total widths of the hydrogen line in NGC 3516 and NGC 7469 […] The lines of the other ions show no evidence of wide wings.” In our galaxy, only supernovae explosions were known to generate mass motions of this magnitude. Finally, Seyfert noted that these unusual galaxies have “bright nuclei, scarcely distinguishable from stars.” For instance, the nucleus of NGC 4151 in the near ultraviolet is as bright as 70% of the entire ultraviolet luminosity of M 31. Later observations of variability timescales showed that many Seyfert nuclei were smaller than a few light minutes in size.
The significance of Seyfert’s work was not fully appreciated until the 1950s, when studies of the newly discovered radio sources made it abundantly clear that new and extraordinary physical processes were at play in the nuclei of galaxies. The most unequivocal evidence came from M87, the dominant galaxy in the Virgo cluster (Figure 2). In 1954, Baade & Minkowski associated the bright radio source Vir A with the seemingly unremarkable giant elliptical galaxy. Two facts suggested that M87 was the source of the radio emitting plasma, and specifically that the radio source had originated in the nucleus. First, a bright narrow optical jet 1 kpc long emanated from the nucleus (Curtis 1918). Second, spectra showed that the nucleus contains ionized gas with unusual line ratios and line widths of several hundred km s-1. Interestingly, forty years later, M87 was the first galaxy for which the presence of a supermassive black hole was firmly established using the Hubble Space Telescope (see § 7; Ford et al. 1994; Harms et al. 1994).
THIS FIGURE IS INCLUDED IN THE FULL VERSION OF THE
MANUSCRIPT AVAILABLE AT http://www.physics.rutgers.edu/ lff/publications.html.
It soon became clear that M87 was far from being an isolated case. In 1953, Jennison & Das Gupta showed that the radio source Cygnus A was double (Figure 3). The following year Baade and Minkowski (1954) identified the radio source with a galaxy at the center of a rich cluster at z=0.057 (D 250 Mpc for km s-1Mpc-1), implying that Cyg A was one of the brightest radio sources in the sky. The radio emission originated from two lobes on either side of the visible object, suggesting that it might be due to relativistic particles ejected in opposite direction from the nucleus. Like M87, the nucleus of the visible galaxy associated with Cyg A showed strong extended emission with unusual line strengths. The case for galaxy nuclei being the sites of violent activity tightened even further when interferometric observations showed that at least some of the radio sources could not be resolved even at 1 arcsec resolution (Allen et al. 1962).
THIS FIGURE IS INCLUDED IN THE FULL VERSION OF THE
MANUSCRIPT AVAILABLE AT http://www.physics.rutgers.edu/ lff/publications.html.
By 1955 astronomers had made a connection between the optical and radio emission from the Crab Nebula (the remnant of a supernova observed on July 4 1054 by Chinese astronomers) and M87’s polarized optical and radio emission from the jet (Baade 1955). The theory of synchrotron radiation from a relativistic plasma newly developed by Shklovski (1954) allowed estimates of the total energy required to power up a radio source. Using the observed power law spectrum, luminosity, and volume of Cyg A, the minimum energy associated with the relativistic electrons and magnetic field was calculated to be , equivalent to the rest mass energy of 11,000 M⊙. If the contribution of the relativistic protons is accounted for, these estimates can be plausibly multiplied by factors of 100. Such requirements are clearly difficult to reconcile with any classical power source, once the small physical size of the nuclei is folded in.
With the discovery of quasi stellar objects (QSOs) in the early ’60s, this energy crisis could no longer be ignored. Lunar occultations carried out with the 250 ft telescope at Jodrell Bank showed that the radio source 3C273 consisted of two components, one of which had a small angular size and flat spectrum (Hazard, MacKay & Shimmins 1965). Inspection of photographic plates taken at the Palomar 200 inch Hale telescope showed that the second source coincided with a 13 mag star, while the more extended radio source matched a faint optical nebulosity which seemed to protrude from the star (Figure 4). When the same year Caltech’s astronomer Martin Schmidt identified the broad lines from the “star” as Balmer emission at a redshift , he opened the door to a field of astronomy that has led to observations of the most energetic phenomena and the most distant objects in the Universe.
THIS FIGURE IS INCLUDED IN THE FULL VERSION OF THE
MANUSCRIPT AVAILABLE AT http://www.physics.rutgers.edu/ lff/publications.html.
Within two years, it was recognized that almost a third of high latitude radio sources were QSOs at large redshifts, the most luminous of which were found to be 1000 times brighter than the Andromeda galaxy. The discovery that some QSOs showed variability on timescales of the order of 1 year (Smith & Hoffleit 1963; Sandage 1964; Greenstein & Schmidt 1964) proved that the light was emitted from a region less than 1 pc in size. Orbiting X-ray telescopes launched in the 1970s set even tighter constraints on the sizes of the energy sources by establishing that active galactic nuclei (AGNs) are luminous in X-rays, and that the luminosity can change by factors 2 with timescales of days, hours, and even minutes, setting a corresponding upper limit to the size of the central engine (Figure 5). If the engines are massive black holes, the relationship between the Schwarzschild radius and the black hole mass opens the possibility of setting an upper limit to the latter from the variation timescale.
Since the early 1960s there was much speculation about how the observed luminosities could be produced within such a small region. Thermonuclear reactions, which have efficiencies of 0.7% at best (in the case of fusion of H into He), were quickly eliminated. Speculations concentrated on runaway explosions triggered by supernovae outbursts in a cluster of tightly packed stars (Burbridge 1962), the collapse and disintegration of a star (Hoyle and Fowler 1963; the authors note that “The concept of stellar-type objects with masses up to is of course strange, but the very nature of the case demands an unusual physical situation”), rapid star formation in a newly born galaxy (Field 1964), and energy generated in galaxy collisions (Harrower 1960). By the 1963 Texas symposium (Robinson et al. 1965), much pondering was given to the idea that the energy source was gravitational. For example, Wheeler envisioned a gravitational singularity at the center of a galaxy, converting into energy much of the matter falling onto it. Zel’dovich & Novikov (1964) and Salpeter (1964) further described the growth of a massive object at the center of a galaxy through accretion, and the accompanying release of energy. Lynden-Bell (1969) made an attempt to explain the phenomenology observed in QSOs and Seyfert galaxies directly in terms of a black hole formalism.
In spite of these promising developments, it is fair to say that the single most influential event contributing to the acceptance of black holes was the 1967 discovery of pulsars by graduate student Jocelyn Bell. The clear evidence of the existence of neutron stars – which had been viewed with much skepticism until then – combined with the presence of a critical mass above which stability cannot be achieved, made the existence of stellar-mass back holes inescapable. The first detection of a solar mass black hole came when the mass of the rapidly variable X-ray source Cygnus X-1 was proven to be above the maximum allowed for a neutron star (Brucato & Kristian 1972; Bolton 1972; Mauder 1973; Rhoades & Ruffini 1974). The first secure detection of a supermassive black hole in a galactic nucleus trailed twenty years behind. How it came about, and what SBHs tell us about galaxy formation and evolution, will be the subject of the remainder of this review.
Section 4 CURRENT STATUS OF SUPERMASSIVE BLACK HOLE SEARCHES: AN OVERVIEW
A SBH which forms or grows in a galactic nucleus will produce a cusp in the stellar density (Peebles 1972; Young 1980; Quinlan, Hernquist, & Sigurdsson 1995; van der Marel 1999). Unfortunately, as demonstrated very effectively by Kormendy & Richstone (1995), the growth, or even the presence of a SBH is not a necessary condition for a “light cusps” to form. Moreover, even when originally present, central density cusps can be destroyed during galaxy mergers, as a consequence of the hardening of the SBH binary which forms at the center of the merger product (Milosavljevic & Merritt 2001).
The dynamical signature imprinted by a SBH on the motion of surrounding matter is, however, unique. Within the sphere of influence, a Keplerian rotation or velocity dispersion of stars or gas is unambiguous proof of the existence of a central mass concentration. The ultimate test as to its nature (a singularity or a dense star cluster?) can only reside in the detection of relativistic velocities within a few Schwarzschild radii. Only observations of the Fe K emission line in Type 1 AGNs might give us a change of peering within the relativistic regime of a SBH (Table I and § 8.2), although this is still considered to be a controversial issue.
| Method & | Scale | No. of SBH | Range | Typical Densities |
|---|---|---|---|---|
| Telescope | () | Detections | (M⊙) | (M⊙ pc-3) |
| Fe K line | 3-10 | 0 | N/A | N/A |
| (XEUS, ConX) | ||||
| Reverberation Mapping | 600 | 36 | ||
| (Ground based optical) | ||||
| Stellar Proper Motion | 1000 | 1 | ||
| (Keck, NTT, VLT) | ||||
| H2O Megamasers | 1 | |||
| (VLBI) | ||||
| Gas Dynamics (optical) | 11 | |||
| (Mostly HST) | ||||
| Stellar Dynamics | 17 | |||
| (Mostly HST) |
The columns give all methods which can (or, in the case of the Fe K line emission, might) be used to estimate SBH masses, and the telescopes needed for the observations; the typical distance from the singularity of the material probed by each method; the number of SBH detections claimed based on that method; the range in the detected SBH masses; and the corresponding implied central mass density.
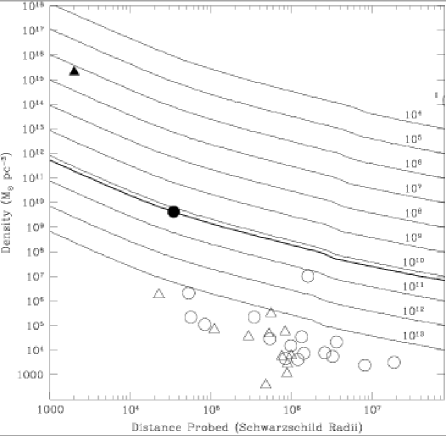
In the absence of the ultimate, relativistic signature, the case for the detected masses to be confined within a singularity becomes stronger as the corresponding mass-to-light ratio and mass density increase. Maoz (1998) provided rough calculations of the lifetime of a dark cluster against evaporation and collapse. For any choice of the cluster’s mass and density (or, equivalently, radius and density) such lifetime depends on the cluster’s composition. Maoz considered the case of clusters of brown dwarfs (with masses down to M⊙), white dwarfs, neutron stars and stellar black holes. His results are reproduced in Figure 6, where the maximum lifetime attainable by any such cluster is plotted as a function of the cluster’s density and radius (an upper limit to which is given by the scale probed by the data), the latter normalized to the Schwarzschild radius. The case for a SBH is tight, according to this simple argument, when the observations imply densities and masses for which the dark cluster lifetime is short compared to the age of the galaxy. When all SBH detections claimed to date are considered (Table LABEL:tab:allmasses), this condition is verified only in the case of the Milky Way, NGC 4258 and Circinus. For all other galaxies, although we will tacitly assume for the rest of this paper that the detected masses are indeed SBHs, dark clusters can provide viable explanations.
Table I summarizes typical central mass densities inferred for each of the methods which are (or might become) available to measure SBH masses in galactic nuclei. Observations of the Fe K emission line will be discussed in § 8.2. The line, which seems to be an almost ubiquitous feature in the X-ray spectra of Seyfert 1 galaxies, is thought to arise from material within a few Schwarzschild radii of the central SBH (Nandra et al. 1997; Reynolds 1997; but see also Done et al. 2000; Gondoin et al. 2001a&b). As such, it provides a powerful testbed of the properties of spacetime in strong gravitational fields. Future generations of X-ray satellites (most notably the European mission XEUS and NASA’s Constellation X), will reveal whether the line responds to flares in the X-ray continuum (a point which is debated, Nandra et al. 1997; Nandra et al. 1999; Wang et al. 2001; Takahashi et al. 2002). If it does, the mass of the central SBH can conceivably be estimated using reverberation mapping techniques (§ 8.3).
In its current application, reverberation mapping (§ 8.3) targets the Broad Line Region (BLR) of Type 1 AGNs (Blandford & McKee 1982; Peterson 1993; Peterson 2002). It is currently the least secure, but potentially most powerful of the methods which we will discuss, probing material within only a few hundred Schwarzschild radii from the singularity, a factor closer than can be reached by stellar and gas dynamical studies using HST. As discussed in detail in § 8.3, although there is compelling, albeit indirect observational evidence that the BLR motion is Keplerian, the kinematics and morphology of the BLR have not yet been mapped directly. In the Keplerian hypothesis, the SBH mass is derived from the observed “average” size and velocity of the BLR. If the method does indeed measure masses (and the evidence that this is indeed the case is growing stronger by the day), the inferred central densities leave no doubt that such masses are indeed confined in a singularity.
To date, the only secure detections of SBHs (as opposed to dense clusters of stars or exotic particles) come from stellar proper motion in the Galactic center and the H2O megamaser study of the nearby Seyfert 2 galaxy NGC 4258 (§ 5.1 and § 6 respectively). The applicability of either method is however limited (to one galaxy, the Milky Way, in the case of proper motion studies). The most prolific methods are based on optical stellar and gas dynamical studies, generally carried out using the Hubble Space Telescope (HST, § 5.2 and § 7). On the downside, these methods can rarely reach closer than several million Schwarzschild radii from the singularity; the implied central densities are always far lower than needed to conclude that the mass is indeed collapsed into a SBH.
Table LABEL:tab:allmasses lists all galaxies for which a SBH detection has been claimed based on stellar proper motion, H2O megamasers, or optical stellar and gas dynamical studies (reverberation mapping detections will be listed in § 8.3). Cases for which the analysis did not lead to a successful determination of the SBH mass (according to the original investigators) are grouped at the end of the table. For each galaxy, we list the Hubble type, distance (mostly from Tonry et al. 2001), SBH mass and reference, central bulge velocity dispersion, total and extinction corrected blue magnitude (from the RC3, de Vaucouleurs et al. 1991, corrected for Galactic extinction using the reddening maps of Schlegel et al. 1998), and fraction of the total light judged to be in the hot stellar component (from Fukugita et al. 1998). In the last column, the ratio between the radius of the SBH sphere of influence (equation 6) and the spatial resolution of the data is given as a rough indicator of the quality of the SBH mass estimate. All studies which have addressed the issue (Ferrarese & Merritt 2000; Merritt & Ferrarese 2001b&c; Graham et al. 2001; Ferrarese 2002a; Marconi & Hunt 2003; Valluri et al. 2004) have concluded that resolving the sphere of influence is an important (although not sufficient) factor: not resolving can lead to systematic errors on or even spurious detections.
This rather intuitive fact explains the dominance of HST in this field. As an example, consider our close neighbor, the Andromeda galaxy. At a fiducial stellar velocity dispersion of km s-1, and assuming a SBH with mass M⊙ (unfortunately, the well known presence of a double nucleus does not allow for an accurate determination of the SBH mass - Bacon et al. 2001), the radius of the sphere of influence is 5.2 pc, or 1′′.4 at a distance of 770 kpc. This is resolvable from the ground. However, if Andromeda were just a factor two or three further, ground based observations would be unable to address the question of whether its nucleus hosts a SBH. In the absence of maser clouds or an active nucleus, HST data would offer the only viable option. At the
| Object | Hubble | Distance | Ref. & | |||||
|---|---|---|---|---|---|---|---|---|
| Type | (Mpc) | (M⊙) | Method | (km s | (mag) | |||
| MW | SbI-II | 0.008 | 1,PM | 10020 | -20.080.50 | 0.34 | 1700 | |
| N4258 | SAB(s)bc | 7.2 | 2,MM | 13818 | -20.760.15 | 0.16 | 880 | |
| N4486 | E0pec | 16.1 | 3,GD | 34545 | -21.540.16 | 1.0 | 34.6 | |
| N3115 | S0 | 9.7 | 4,SD | 27836 | -20.190.20 | 0.64 | 22.8 | |
| I1459 | E3 | 29.2 | 5,SD | 31241 | -21.500.32 | 1.0 | 17.0 | |
| N4374 | E1 | 18.7 | 6,GD | 28637 | -21.310.13 | 1.0 | 10.3 | |
| N4697 | E6 | 11.7 | 7,SD | 16321 | -20.340.18 | 1.0 | 10.2 | |
| N4649 | E2 | 16.8 | 7,SD | 33143 | -21.430.16 | 1.0 | 10.1 | |
| N221 | cE2 | 0.8 | 8,SD | 7610 | -15.760.18 | 1.0 | 10.1 | |
| N5128 | S0pec | 4.2 | 9,GD | 14525 | -20.780.15 | 0.64 | 8.41 | |
| M81 | SA(s)ab | 3.9 | 10,GD | 17417 | -20.420.26 | 0.33 | 5.50 | |
| N4261 | E2 | 31.6 | 11,GD | 29038 | -21.140.20 | 1.0 | 3.77 | |
| N4564 | E6 | 15.0 | 7,SD | 15320 | -19.000.18 | 1.0 | 2.96 | |
| CygA | E | 240 | 12,GD | 27087 | -20.030.27 | 1.0 | 2.65 | |
| N2787 | SB(r)0 | 7.5 | 13,GD | 21023 | -18.120.39 | 0.64 | 2.53 | |
| N3379 | E1 | 10.6 | 14,SD | 20126 | -19.940.20 | 1.0 | 2.34 | |
| N5845 | E* | 25.9 | 7,SD | 27536 | -18.800.25 | 1.0 | 2.28 | |
| N3245 | SB(s)b | 20.9 | 15,GD | 21119 | -20.010.25 | 0.33 | 2.10 | |
| N4473 | E5 | 15.7 | 7,SD | 18825 | -19.940.14 | 1.0 | 1.84 | |
| N3608 | E2 | 22.9 | 7,SD | 20627 | -20.110.17 | 1.0 | 1.82 | |
| N4342 | S0 | 16.7 | 16,GD | 26134 | -17.740.20 | 0.64 | 1.79 | |
| N7052 | E | 66.1 | 17,GD | 26134 | -21.330.38 | 1.0 | 1.53 | |
| N4291 | E3 | 26.2 | 7,SD | 26935 | -19.820.35 | 1.0 | 1.52 | |
| N6251 | E | 104 | 18,GD | 29739 | -21.940.28 | 1.0 | 1.19 | |
| N3384 | SB(s)0- | 11.6 | 7,SD | 15120 | -19.590.15 | 0.64 | 1.12 | |
| N7457 | SA(rs)0- | 13.2 | 7,SD | 7310 | -18.740.24 | 0.64 | 0.92 | |
| N1023 | S0 | 11.4 | 7,SD | 20114 | -20.200.17 | 0.64 | 0.89 | |
| N821 | E6 | 24.1 | 7,SD | 19626 | -20.500.21 | 1.0 | 0.74 | |
| N3377 | E5 | 11.2 | 7,SD | 13117 | -19.160.13 | 1.0 | 0.74 | |
| N2778 | E | 22.9 | 7,SD | 17122 | -18.540.33 | 1.0 | 0.39 | |
| Galaxies for which the dynamical models might be in error. | ||||||||
| Object | Hubble | Distance | Ref. & | Notes | ||||
| Type | Mpc | M⊙ | Method | |||||
| Circinus | SA(s)b | 4.2 | 19,MM | disk inclination angle not constrained | ||||
| N4945 | SB(s)cd | 3.7 | 20,MM | no 2-D velocity field | ||||
| N1068 | Sb | 23.6 | 21,MM | maser disk is self gravitating | ||||
| N4459 | SA(r)0+ | 16.1 | 13,GD | disk inclination angle not constrained | ||||
| N4596 | SB(r)0+ | 16.8 | 13,GD | disk inclination angle not constrained | ||||
| N4594 | SA(s)a | 9.8 | 22,SD | no 3-integral models | ||||
| N224 | Sb | 0.77 | 23,SD | double nucleus | ||||
| N4041 | Sbc | 16.4 | 0.2 | 24,GD | disk might be dynamically decoupled | |||
Notes to Table II: The columns give the galaxy’s Hubble type; distance (from Tonry et al. 2001 whenever available; derived from the heliocentric systemic velocity and km s-1 Mpc-1 in all other cases); black hole mass, reference (coded below) and method of detection (PM = stellar proper motion, GD= gas dynamics, SD = stellar dynamics, MM = H2O megamasers); central bulge velocity dispersion; total, extinction corrected blue magnitude (from the RC3, de Vaucouleurs et al. 1991, corrected for Galactic extinction using the reddening maps of Schlegel et al. 1998); fraction of the total light judged to be in the hot stellar component (from Fukugita et al. 1998); the ratio of the diameter of the SBH sphere of influence to the spatial resolution of the data. References: 1. Ghez et al. 2003 – 2. Miyoshi et al. 1995 – 3. Macchetto et al. 1997 – 4. Emsellem et al. 1999 – 5. Cappellari et al. 2002 – 6. Bower et al. 1998 – 7. Gebhardt et al. 2003 – 8. Verolme et al. 2002 – 9. Marconi et al. 2001 – 10. Devereux et al. 2003 – 11. Ferrarese et al. 1996 – 12. Tadhunter et al. 2003 – 13. Sarzi et al. 2001 – 14. Gebhardt et al. 2000a – 15. Barth et al. 2001 – 16. Cretton & van den Bosch 1999– 17. van der Marel & van den Bosch 1998 – 18. Ferrarese & Ford 1999 – 19. Greenhill et al. 2003b – 20. Greenhill, Moran & Herrnstein 1997 – 21. Greenhill et al. 1996 – 22. Kormendy et al. 1988 – 23. Bacon et al. 2001 – 24. Marconi et al. 2003.
distance of the Virgo cluster, 15 Mpc, the sphere of influence of a M⊙ SBH would shrink to a projected radius of 0′′.07, not only well beyond the reach of any ground based telescope, beyond even HST capabilities. Overall, as will be discussed in § 11, the number of galaxies for which the SBH sphere of influence can be resolved with ground-based optical observations can be counted on the fingers of one hand. HST has enabled that number to be increased by well over an order of magnitude.
Section 5 STELLAR DYNAMICAL STUDIES
5.1 A Special Case: The Galactic Center
The case for a massive object at the Galactic Center has been building since the 1970’s detection of strong radio emission originating from the innermost 1-pc (Balick & Brown 1974; Ekers et al. 1975). Not only is the source, dubbed Sgr A∗, extremely compact (VLBI observations at 86 GHz set a tight upper limit of 1 A.U. to its size, Doeleman et al. 2001), but the absence of any appreciable proper motion implies that it must also be very massive. In the most recent study on the subject, Reid et al. (2003) argue that Sgr A∗ must be in excess of , thus excluding that it might consist of a compact cluster of stellar objects. Because of its proximity ( kpc, Eisenhauer et al. 2003), the Galactic Center can be studied at a level of detail unimaginable in any other galaxy. Proper motions of the star cluster surrounding Sgr A∗ can be detected using near infrared speckle imaging techniques. On-going monitoring studies, conducted for the past ten years at the ESO NTT and Keck Telescope first, and at the ESO VLT more recently, have reached a staggering 0′′.003 (0.1 mpc) astrometric accuracy in the stellar positions (Eckart et al. 1993; Ghez et al. 1998; Ghez et al. 2000; Schödel et al. 2003; Ghez et al. 2003): proper motion has been measured for over 40 stars within 1′′.2 of Sgr A∗; deviations from linear motion has been detected for eight stars and four stars in particular have passed the pericenter of their orbits since monitoring began (Ghez et al. 2003; Schödel et al. 2003). In the three cases for which accurate orbits can be traced, the stars orbit Sgr A∗ with periods between 15 and 71 years, reaching as close as 87 A.U. from the central source. Using a simultaneous multi-orbital solution, Ghez et al. (2003) derive a best fit central mass of . The implied central mass density of Mpc-3, provides virtually incontrovertible evidence that the mass is indeed in the form of a singularity.
An excellent review of the nature and observations of Sgr A∗ can be found in Melia & Falcke (2001), to which we refer the reader for a detailed discussion.
5.2 Integrated Stellar Dynamics
Modeling the kinematics of stars in galactic nuclei has historically been the method of choice to constrain the central potential, and for good reasons: stars are always present, and their motion is always gravitational. But, as for every method, downsides also exists. Stellar absorption lines are faint and the central surface brightness, especially in bright ellipticals, is low (Crane et al. 1993; Ferrarese et al. 1994; Lauer et al. 1995; Rest et al. 2001). Acquiring stellar kinematical data therefore often entails walking a fine line between the need for high spatial resolution and the need for high spectral signal-to-noise: the latter benefits from the large collective area of ground based telescopes, while the former demands the use of HST in all but a handful of cases. Theoretical challenges arise from the fact that the stellar orbital structure is unknown and difficult to recover from the observables. Although dynamical models have reached a high degree of sophistication (Verolme et al. 2002; Gebhardt et al. 2003; van de Ven et al. 2003), the biases and systematics which might affect them have not been fully investigated and could be severe (Valluri, Merritt & Emsellem 2004). For the rest of this section, we will explore in detail some of the issues related to stellar dynamical modeling.
Unlike globular clusters (e.g. Binney & Tremaine 1987), and with the possible exception of unusually dense galactic nuclei – M32 and NGC205 could be such cases – stars in a galaxy have not had enough time to become aware of each other’s individual existence. Putting it more rigorously, both the characteristic crossing time , and the galaxy age, are much shorter (typically by a factor and respectively) than the relaxation time, , defined as the characteristic timescale over which, due to the cumulative effects of stellar encounters, a typical star acquires a transverse velocity equal to its initial velocity. To very good approximation, therefore, galaxies can be treated as collisionless stellar systems: each star can be thought of as moving in the combined gravitational potential of all other stars. This makes it possible to describe the system analytically, while the dynamics of globular clusters, for instance, must be studied with the aid of numerical simulations. The distribution function (DF), defined as the number of stars which occupy a given infinitesimal volume in phase-space, obeys a continuity equation, i.e. the rate of change of the number of stars within a given phase space volume is equal to the amount of inflow minus the amount of outflow:
| (7) |
Equation 12 is known as the Collisionless Boltzmann Equation (CBE). is linked to the total mass density by the Poisson equation:
| (8) |
In the above equation, comprises all mass present within the system, including not only stars, but also SBHs and dark matter, if present.
Modulo a multiplicative factor (the stellar mass-to-light ratio), the stellar mass density and the six components of the streaming velocity and velocity dispersion involve integrals of the DF in velocity space. This implies that the DF can be reconstructed given the stellar mass density and velocity tensor. Once the DF is known, the total gravitational potential follows from the CBE, and the total mass density (and hence the SBH mass, if the stellar mass density is known) from Poisson’s equation.
Unfortunately, not all seven variables can be extracted from observational data: galaxies’ images and spectra contain information on the projected surface brightness profile and the integrated, line of sight velocity and velocity dispersion only. It is only at the cost of making further simplification that the CBE and Poisson’s equations can be solved analytically. For instance, if there are grounds to believe that the system is in a steady state (i.e. all time derivatives are null), spherically symmetric, and isotropic, the first velocity moment of the CBE becomes:
| (9) |
where is the velocity dispersion, and is the stellar mass density. Both are related to the surface brightness profile and the line of sight velocity dispersion through Abel integrals which can be easily inverted; therefore equation 9 can be solved analytically to derive .
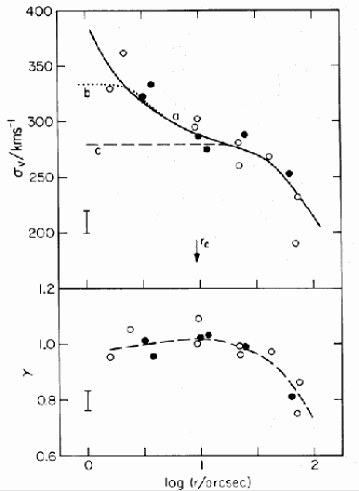
The first attempts to use morphological and dynamical data to constrain the presence of a central mass were indeed based on Equation 9: assuming an isotropic, spherically symmetric system, Sargent et al. (1978) “detected” a central M⊙ dark mass within the inner 110 pc of M87 (Figure 7). But how much does this result depend on the assumptions of sphericity and isotropy? Like all giant ellipticals, M87 does not appreciably rotate, and is well described (at least in the inner parts) by a spherical system. However, the assumption of isotropy is unfounded. The ratio between velocity dispersion and circular velocity in massive ellipticals is far higher than predicted for an isotropic model (Illingworth 1977), implying that these systems are supported by an anisotropic velocity tensor. Relaxing the assumption of isotropy drastically alters the dynamical models. The Sargent et al. data were reanalyzed by Binney & Mamon (1982), and later Richstone & Tremaine (1985). Both groups lifted the assumption of isotropy. To still be able to solve the CBE analytically, if isotropy is not assumed, some other restrictions must be imposed on the system. In the specific case of M87, the mass to light ratio was constrained to be constant throughout the galaxy. The model which is able to fit the data has a mass to light ratio of 7.6 (in the band), plausible for a stellar system, and a highly anisotropic velocity dispersion in the inner 300 pc (Figure 7). This is easy to understand: a highly radial velocity dispersion will mimic an increase in the observed line of sight velocity dispersion in the central regions (as the presence of a central dark object would) since, compared to the isotropic case, the space-volume sampled by the data includes more radially directed stars moving closely along the line of sight.
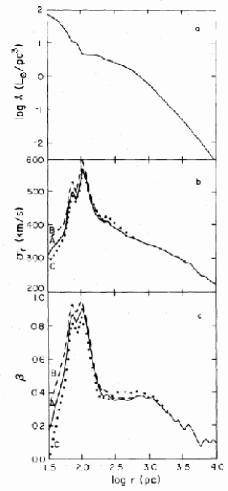
Although the Binney & Mamon model has not been tested for dynamical stability – indeed, no anisotropic dynamical models of galactic nuclei have – the example serves to illustrate the difficulty in modeling stellar kinematical data. It is important to realize that, especially for non rotating, giant ellipticals, such difficulty cannot be rooted out given the observables (see also the illuminating discussion at the beginning of §4 of Kormendy & Richstone 1995). Indeed, for M87 the ambiguity remained even when more recent, state of the art data (van den Marel 1994) were used (Figure 8). A potentially powerful way to break the degeneracy between a varying mass-to-light ratio, and velocity anisotropy comes from analyzing the Line of Sight Velocity Distribution (LOSVD), defined as:
| (10) |
where is the projected surface brightness profile at position , measured in the plane of the sky. The LOSVD, which is reflected in the shape of the absorption line profiles, is routinely expressed in terms of Gauss-Hermite moments, which arise from an expansion of the profile shape in terms of orthogonal functions. The second moment in particular depends on the level of anisotropy of the system (van der Marel & Franx 1993; Gerhard 1993). For instance, tangentially (radially) anisotropic DFs produce LOSVDs which are more flat-topped (peaked) compared to the isotropic case. The presence of a SBH further influences the LOSVD by stretching its wings, due to high velocity stars orbiting in the Keplerian potential (van der Marel 1994). In practice, a comprehensive study of the LOSVD requires higher S/N than available (or obtainable) for the vast majority of galaxies. It therefore remains generally true that stellar dynamical models are best applied to rapidly rotating systems (most faint ellipticals are in this class, e.g. Kormendy & Richstone 1992). Not only are these galaxies more accurately described as isotropic systems (Illingworth 1977) but also, as the streaming velocity becomes the dominant kinematical component, terms involving the velocity dispersion play only a second order effect in the CBE. The most extreme cases of such systems are galaxies hosting small nuclear stellar disks, a not uncommon occurrence especially in late type ellipticals (Kormendy & Richstone 1992; Scorza & Bender 1995; van den Bosch & de Zeeuw 1996; van den Bosch, Jaffe & van der Marel 1998; Cretton & van den Bosch 1999). Van den Bosch & de Zeeuw (1996) find that if such a galaxy hosts a sufficiently massive SBH, the wing of the bulge-dominated LOSVD will show a clear signature of the fast rotation of the disk. Unfortunately, for this to happen, the mass of the SBH needs to be a few percent of the mass of the hot stellar component, at least a factor 10 larger than has been measured (§ 10).
Since the 1978 work of Sargent et al. , the level of sophistication of the dynamical models applied to stellar kinematics has been improving steadily. The complexity of the models is reflected in the complexity of the distribution function needed to describe the data. For instance, the DF of a spherical, isotropic system depends only on one integral of motion, the total energy of the system. The assumption of isotropy makes it possible to have a one-to-one correspondence between mass density and distribution function: given (which can be determined from the data once a stellar-mass-to-light ratio and, for our application, a central dark mass are assumed), it is always possible to find analytically a DF which self-consistently generates (and vice-versa). Once the DF is known, the velocity dispersion can be predicted uniquely. It follows that it is always possible to determine the values of and which best fit the observables. As mentioned earlier, whether these values actually describe the real galaxy hinges critically on whether the assumptions do, which should not be taken for granted.
If the velocity dispersion is anisotropic, the DF must depend on at least two integrals of motion; in the simplest case , where is the vertical component of the angular momentum. Such a DF can be fully constrained provided that the mass density and the tangential component of the streaming motion are known. As in the spherical isotropic case, therefore, the mean square velocity (velocity dispersion and streaming motion) can be uniquely predicted in any given gravitational potential. Two-integral (2I) models are handled through the Jeans equations, which relate the second order of the velocity moments to the potential and density of the stellar system. The procedure follows the steps below:
-
1.
Deproject the observed 2-D surface brightness profile to derive the underlying luminosity density. The deprojection is not unique, and an inclination angle must be assumed.
-
2.
Translate the luminosity density to a mass density by assuming a (generally constant with radius) and a central point mass . Compute the gravitational potential corresponding to the mass density thus derived.
-
3.
Solve the Jeans equation for the mean square velocities.
-
4.
Project the mean velocities onto the plane of the sky to get the line of sight velocity and velocity dispersion.
-
5.
Compare the predicted and observed velocities.
-
6.
Return to point 1, and iterate until the values , and which produce the best fit to the data are found. In practice, the data are never of high enough quality for all three parameters to be constrained, and an inclination angle is always assumed a priori.
As in the case of spherical isotropic models, 2I models can produce good fits to the data, but the solution might be severely in error if the galaxy under study is not well approximated by the assumption that . Unfortunately, there is ample evidence that this condition is in fact not generally obeyed. Not only do 2I models predict major-axis velocity dispersions which are larger than observed, they also require identical velocity dispersions in the radial and vertical direction, a condition not verified, for instance, in the solar neighborhood. Furthermore, numerical simulations show that most orbits are not completely described by two integrals of motion: a third integral must be admitted, although an analytical description of such an integral is not known. Dynamical models in which the distribution function depends on three integrals of motion are referred to as 3I models. State of the art 3I models are now routinely applied to stellar kinematics (Verolme et al. 2002; Gebhardt et al. 2003). Schwarzschild (1979) is credited with devising a way to construct galaxy models without an explicit knowledge of the integrals of motions:
-
1.
Start with a choice of potential, as for the 2I models (items 1. and 2.)
-
2.
For a grid of cells in position space, choose initial conditions for a set of orbits. For each orbit, the equations of motion are integrated over many orbital periods, and a tally is kept of how much time each orbit spends in each cell. This provides a measure of how much mass is contributed to each cell by each orbit.
-
3.
Determine non-negative weights for each orbit such that the summed mass and velocity structure in each cell, when integrated along the line of sight, reproduce the observed surface brightness and kinematical constraints.
With the introduction of 3I models, any kind of stellar system can in principle be modeled in the most general and unconstrained way. In practice, however, some assumptions must still be made. With one exception (Verolme et al. 2002), the inclination angle of the galaxy is always assumed a priori (e.g. Gebhardt et al. 2003); not doing so would introduce an extra degree of freedom which cannot be constrained given the observables. Furthermore, although steps toward a formalism for triaxial systems have recently been taken (van de Ven et al. 2003), all current models assume axisymmetry.
These problems notwithstanding, systematic uncertainties could be hidden in the method itself (if a lesson is to be learned from the M87 example discussed above, it is that stellar dynamical studies can be fallible!). It is therefore rather surprising that to date there has been only one study specifically aimed at investigating the incidence of systematics in 3I models (Valluri, Merritt & Emsellem 2004). This study reaches the rather bleak conclusion that even in the case of the best observational datasets, 3I models admit too many degrees of freedom to constrain . Valluri et al. identify a fundamental reason for this: since in the 3I case there is an infinite number of distribution functions corresponding to a given and (e.g. Binney & Tremaine 1987), a change in the gravitational potential (for instance due to the introduction of a central point mass) can always be compensated with a change in the DF, so to leave the goodness of the fit of the model to the data unchanged. Valluri et al. further argue that this intrinsic indeterminacy becomes apparent only when the number of orbits used in the simulations (step 2 above) is large (at least a factor 10) compared to the number of observational constraints. When only a few orbits are used (relative to the number of constraints), the system is artificially restricted to such an extent that an apparently well constrained (but very likely biased) solution is found. Although it seems unlikely that 3I models are severely flawed (after all, SBH masses determined using these models agree, in a statistical sense, with those measured using completely independent methods, such as dynamical studies of gas kinematics, and reverberation mapping, § 9) quantifying possible systematics is a must. Consequently, it is imperative that more studies address this issue in the future.
The 17 claimed SBH detections that are based on 3I models are listed in Table LABEL:tab:allmasses, ranked from highest to lowest resolution of the SBH sphere of influence. With no exceptions, they all required the use of HST data. Even then, the sphere of influence was not resolved in five cases, and barely resolved in several others.
Section 6 GAS DYNAMICS FROM WATER MASER CLOUDS
The 1995 announcement of the discovery of a massive black hole in NGC 4258 (Miyoshi et al. 1995) marked the beginning of an unexpected and powerful new way to measure central masses in AGNs. At a distance of 7.2 Mpc (Herrnstein et al. 1999), and given the low bulge velocity dispersion of the galaxy (Heraudean & Simien 1998) the Hubble Space Telescope would be able to resolve the sphere of influence only of a SBH more massive than a few M⊙ (equation 6). Scaling relations (§ 9) predict a SBH mass an order of magnitude smaller. NGC 4258, however, is blessed by the presence of water masers clouds, confined to a thin, regular disk extending only a fraction of a parsec from the central source. Emitting at 22 GHz, the masers can be studied with the VLBA at spatial resolutions a factor higher than can be achieved using the Hubble Space Telescope, instantly pushing the ability to detect a SBH to correspondingly smaller masses.
The history of extragalactic water masers is a recent one, although Galactic water masers, which are likely the result of collisional excitation of warm interstellar gas (Neufeld & Melnick 1991) were first detected in 1968 (Cheung et al. 1969) and subsequently identified in a number of star forming regions and late-type stellar envelopes. The first extraordinarily luminous, extragalactic example was found in the Seyfert 2 galaxy NGC 4945 (dos Santos and Lepine 1979). In the following five years very luminous () H2O masers were detected in four additional active galaxies: Circinus (Gardner & Whiteoak 1982), NGC 4258, NGC 1068 (Claussen, Heiligman, & Lo 1984), and NGC 3079 (Henkel et al. 1984). The 22 GHz water maser emission line luminosity in NGC 1068 is , exceeding the luminosity of a typical Galactic water maser by a factor of , and exceeding the brightest Galactic source, W49 (Walker, Matsakis, and Garcia-Barreto 1982) by a factor of 350.
VLA observations by Clausen & Lo (1986) were unable to resolve the maser sources in NGC 1068 and NGC 4258, which must therefore be confined within 3.5 and 1.3 pc of the nucleus. Based on marked variability of the two sources and preliminary VLBI observations, Clausen & Lo concluded that the true sizes of the sources were 10-100 times smaller than the VLA upper limits. This made it unlikely that the masers could be a superposition of Galactic-type water masers, which are known to be powered by massive young stars. To further strengthen the lack of association between the nuclear and Galactic masers, they noted that two nearby starburst galaxies, M82 and NGC 253, are not luminous water maser sources, and that the infrared luminosity that would be required to excite the H2O maser in NGC 4258 exceeded the observed IR luminosity of the galaxy by a factor of nearly 300. The logical conclusion was that the excitation energy was produced in the active nucleus. In an inspired insight, Clausen & Lo suggested that the masing in NGC 1068 might arise in the postulated – but never directly observed – pc-size obscuring torus which is at the heart of the Seyfert 1/2 unification scheme (Antonucci and Miller 1985).
Neufeld, Maloney, & Conger (1994) show that luminous water masers can be produced when X-rays, presumably generated by the innermost accretion disk around the central SBH, illuminate and heat a torus of dense circumnuclear gas and dust. Their model leads to “a sandwich structure in which the high-pressure gas closest to the midplane is molecular but the lower-pressure gas above and below the plane is atomic.” When the X-ray heating is large enough to raise the temperature in gas and dust above 400 K, but small enough to permit the existence of H2, a reaction network O + H OH + H and OH + H H2O + H is very efficient at producing water with an abundance ratio of water to hydrogen of several . Over a range of X-ray fluxes a stable two phase structure is possible with an atomic phase at to 8000 K and a molecular phase at to 2500 K. Warping in the maser disk is argued to be critical: if the disk were flat, the path through the disk would be optically thick to X-rays and the X-ray opacity would become too high for the heating required to excite the masers. This prediction is supported by observations of NGC 4258, which indeed show the maser disk to be mildly warped (§ 6.1)
Unfortunately, H2O masers are not common. The first large survey was conducted by Braatz, Wilson, & Henkel (1994, 1996). Targeting 354 galaxies mostly within 10 Mpc, including Seyfert galaxies, LINERS, and radio galaxies, they found a 7% detection rate (13 sources) among Seyfert 2 and LINERS, but no detections in Seyfert 1 nuclei. This is not surprising, since to detect water masers the observer must see a long path length through the torus. Therefore, when the geometry is favorable to observe masing, the Seyfert 1 nucleus is hidden by the optically thick torus. The Greenhill et al. (1997) survey of 26 AGNs with the 70m antenna of the NASA Deep Space Network produced only one detection, NGC 3735. One additional detection stemmed from a survey of 131 AGNs with the Parkes Observatory (Greenhill et al. 2002). In most of the sources the masers were detected only at the systemic velocity of the galaxy. In a few cases, however, NGC 4258 being the most noticeable (Nakai et al. 1995), high velocity ( km s-1), maser clouds were also detected. It is these high velocity clouds which, as we will discuss in more detail below, open the possibility of constraining the central potential through the study of the masers’ velocity field.
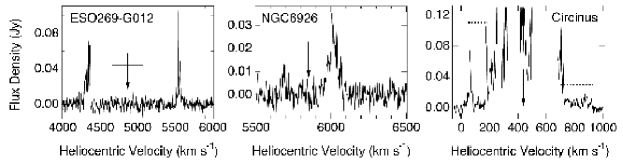
The most recent, and most promising results come from Greenhill et al. (2003a). Benefiting from a larger sensitivity and wider wavelength coverage than previous surveys, this study led to the discovery of seven new sources among 160 nearby ( km s-1) AGNs surveyed with the NASA Deep Space Antenna. More exciting still, two of the sources exhibit high velocity masers and are promising targets for VLBI follow-ups (Figure 9).
Besides the fact that no H2O maser emission is detected in Seyfert 1 galaxies, no strong correlations have been found between maser emission and the global properties of the host galaxies, although where X-ray measurements are available, all known masers lie in galaxies with large X-ray obscuring column densities (Braatz et al. 1997). All galaxies in which H2O nuclear masers have been detected are listed in Table III.
| Galaxy | Type | Distance | Reference | High v | Rot. | SBH Mass |
|---|---|---|---|---|---|---|
| (Mpc) | Masers? | Curve? | (M⊙) | |||
| M51 | S2/L | 9.6 | Hagiwara et al. 2001a | yes | no | |
| NGC 1052 | L | 20 | Braatz et al. 1996 | no | no | |
| NGC 1068 | S2 | 16 | Greenhill et al. 1996 | yes | yes | |
| NGC 1386 | S2 | 12 | Braatz et al. 1996 | no | no | |
| NGC 2639 | S2 | 44 | Braatz et al. 1996 | no | no | |
| NGC 2824 | S? | 36 | Greenhill et al. 2003a | no | no | |
| NGC 2979 | S2 | 36 | Greenhill et al. 2003a | no | no | |
| NGC 3079 | S2 | 16 | Trotter et al. 1998 | yes | yes | |
| NGC 3735 | S2 | 36 | Greenhill et al. 1997 | no | no | |
| NGC 4258 | S2 | 7.2 | Greenhill et al. 1995 | yes | yes | |
| NGC 4945 | S2 | 3.7 | Greenhill et al. 1997 | yes | yes | |
| NGC 5347 | S2 | 32 | Braatz et al. 1996 | no | no | |
| NGC 5506 | S2 | 24 | Braatz et al. 1996 | no | no | |
| NGC 5643 | S2 | 16 | Greenhill et al. 2003a | no | no | |
| NGC 5793 | S2 | 50 | Hagiwara et al. 2001b | yes | yes | |
| NGC 6240 | L | 98 | Hagiwara et al. 2002 | yes | no | |
| NGC 6300 | S2 | 15 | Greenhill et al. 2003a | no | no | |
| NGC 6929 | S2 | 78 | Greenhill et al. 2003a | yes | no | |
| IC1481 | L | 83 | Braatz et al. 1996 | no | no | |
| IC2560 | S2 | 38 | Ishihara et al. 2001 | yes | no | |
| Mrk1 | S2 | 65 | Braatz et al. 1996 | no | no | |
| Mrk348 | S2 | 63 | Falcke et al. 2000 | yes | no | |
| Mrk1210 | S2 | 54 | Braatz et al. 1996 | no | no | |
| Mrk1419 | S2 | 66 | Henkel et al. 2002 | yes | no | |
| Circinus | S2 | 4 | Greenhill et al. 2003a | yes | yes | |
| ESO269-G012 | S2 | 65 | Greenhill et al. 2003a | yes | no | |
| IRASF18333-6528 | S2 | 57 | Braatz et al. 1996 | no | no | |
| IRASF22265-1826 | S2 | 100 | Braatz et al. 1996 | no | no | |
| IRASF19370-0131 | S2 | 81 | Greenhill et al. 2003a | no | no | |
| IRASF01063-8034 | S2 | 53 | Greenhill et al. 2003a | no | no |
The columns give the galaxy name; AGN type (L = LINER, S2 = Seyfert 2); distance (from the heliocentric velocity, assuming km s-1 Mpc-1); whether high velocity emission has been detected; whether the emission has been spatially resolved; and the estimated SBH mass.
6.1 The Small Masing Disk in NGC 4258
NGC 4258 is a fascinating object. It was one of the 12 galaxies identified by Seyfert (1943) as having peculiar nuclei, but the peculiarities do not end there. In addition to two well-defined spiral arms delineated by HII regions and bright OB associations, there are two anomalous arms that are visible only in emission lines at optical wavelengths (van der Kruit et al. 1972) (Figure 10). The anomalous arms emit bright synchrotron radiation at radio wavelengths (Turner & Ho 1994). The arms have both a morphological (Ford et al. 1986) and kinematical (Dettmar & Koribalski 1990; Cecil, Wilson, & Tully 1992) twist; the latter has the same sense as the rotation of the molecular disk discussed below.
THIS FIGURE IS INCLUDED IN THE FULL VERSION OF THE
MANUSCRIPT AVAILABLE AT http://www.physics.rutgers.edu/ lff/publications.html.
The arms have long been thought to mark the location of a bi-directional jet which is moving through the disk of NGC 4258. For this to be the case, the axis of the central engine and the galaxy’s rotational axis must be misaligned by 90∘, a condition that might also apply to M51 and NGC 1068 (Ford et al. 1986). If this interpretation is correct, then the central accretion disk and molecular torus, the axes of which should align with that of the SBH, should be seen nearly edge on. This is precisely what the maser observations suggest.
Nakai et al. (1993) used the Nobeyama 45-m telescope to discover high velocity H2O maser lines at km s-1 relative to NGC 4258’s systemic velocity (Figure 11). They combined very long baseline interferometric observations from the 45-m telescope and the Kashima 34-m telescope to show that the strong features near systemic velocity are within 0′′.05 ( pc) of the nucleus. Nakai et al. proposed three possible explanations for the observations: a circumnuclear molecular torus in Keplerian orbit around a central object, bi-directional outflow, and stimulated Raman scattering of the emission features near systemic velocity.
Nakai et al.’s results precipitated a great deal of theoretical and observational activity. Almost simultaneously, three independent teams (Watson & Wallin 1994; Haschick et al. 1994; Greenhill et al. 1995a) arrived at the conclusion that the maser emission in NGC 4258 must originate in a rapidly rotating Keplerian disk viewed nearly edge-on. The incriminating piece of evidence, beside the existence of the high velocity features, resided in the fact that the systemic velocities showed both a secular and spatial variation, km s-1 yr-1 and km s-1 mas-1 respectively (Haschick et al. 1994; Greenhill et al. 1995a&b), exactly as expected if the masers originate in an edge on disk. In this case, the high velocity lines arise from masing along the long lines of sight through the two opposing tangent points in the disk, while the clouds which project along the line of sight to the nucleus should have velocities close to the systemic velocity. The velocity of individual masing clouds which project against the nucleus should therefore change with time (secular change) as the clouds move along their trajectory, while clouds projecting at slightly different locations should have slightly different velocity (spatial change), as observed222According to this model, there should be no frequency drift in the high velocity features, again in agreement with the observations.:
| (11) |
| (12) |
Here, is the circular velocity at the outer radius () of the disk, is the distance to the galaxy, and is the angular displacement along the arc.
Watson & Wallin modeled the hypothetical edge-on disk as a thin unsaturated annulus surrounding a transparent gap in the disk and a small central opaque region, which was included to account for the splitting of the emission near systemic velocity into two sets of lines. Assuming a distance Mpc333Subsequent high resolution VLBA observations, combined with measurements of the angular size of the disk, the central mass, and the observed temporal and spatial variation of the systemic lines (equations 11 and 12) enabled Herrnstein et al. (1999) to derive a geometric distance to NGC 4258, Mpc. Watson & Wallin used equations 11) and 12) and advance publication results from Greenhill et al. (1995b) to find km s-1 and pc. The agreement of their derived with the observed values of the high velocity satellite lines (740 to 980 km s-1 and -760 to -920 km s-1) lent strong support to the Keplerian disk hypothesis. Knowing and , they calculated the central mass as .
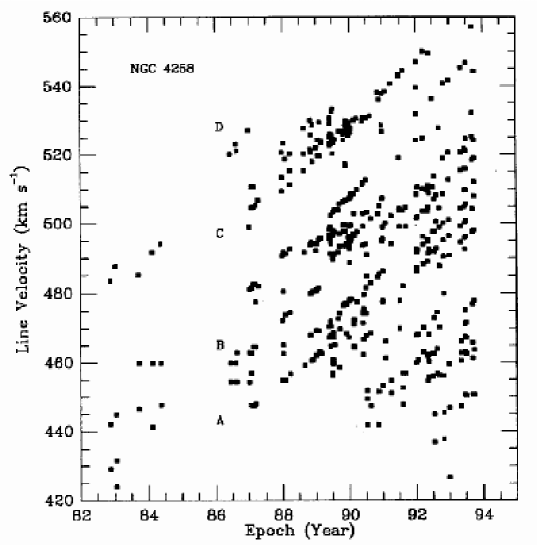
Similar conclusions were reached by Haschick et al. ( pc, km s-1, ) by combining Greenhill et al.’s (1995b) observed linear gradient in velocity, with the results of a seven year monitoring program showing an acceleration for the systemic H2O maser lines of 7.5 km s-1 yr-1 (Figure 12)444They also noted the previously reported fact (Haschick & Baan 1990) that the flux density of the systemic lines showed strong variability between 1988.6 and 1989.6. The strongest feature ( km s-1) varied with an apparent 85 day period. The periodicity, which has disappeared in subsequent observations, remains unexplained.. Interestingly, neither Haschick et al. nor Watson & Wallin suggested that the central mass might reside in a massive black hole. The final proof had to await until the day when Miyoshi’s et al. (1995) high resolution ( mas at a position angle of ∘) VLBI observations could spatially resolved the disk’s structure. The masing clouds, which are confined in an annulus with inner and outer radii of 0.14 and 0.28 pc respectively, display the unmistakable signature of Keplerian motion around solar masses555Values have been corrected to a distance of Mpc (Herrnstein et al. 1999).. Miyoshi’s et al. paper, combined with the HSTmeasurement of the mass of the SBH in M87, marked a turning point in the debate about the existence of massive black holes. Figure 13 shows the VLBA velocities plotted versus distance along the disk major axis. The high velocity lines on opposing sides of the disk (which is very thin, Figure 13) and the central lines are an almost perfect fit to a Keplerian disk inclined to the plane of the sky by 86∘. Moran et al. (1999) summarizes the properties of the disk and central mass.
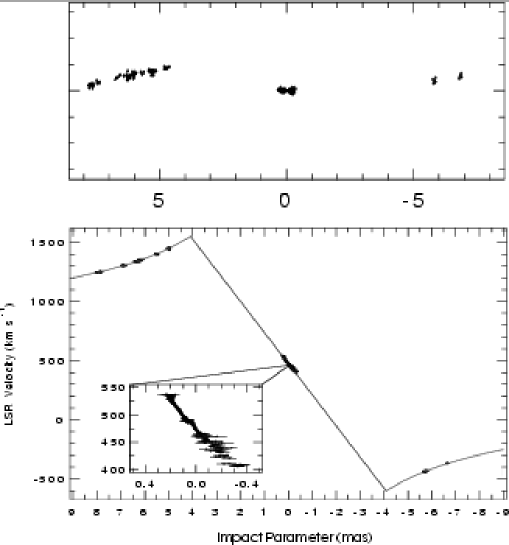
The absence of measurable perturbations in the Keplerian dependence of the high velocity lines requires . Taking the 4.1 mas inner radius as an upper limit to the size of the central object, Miyoshi et al. (1995) found that the mass density is pc-3, larger than the density in the densest known star clusters, globular clusters, where pc-3, and several orders of magnitude larger than measured in any other galactic nucleus for which a SBH has been claimed, with the exception of the Milky Way (Figure 6). Stronger constraints still can be obtained by assuming that the central source has a size less than the angular extent of the systemic lines on the sky ( mas = 0.02 pc). This requires pc-3, leaving virtually no doubt that the detected mass belongs to a central black hole, with the masers orbiting as close as 40,000 Schwarzschild radii. At this distance, relativistic corrections are small but not negligible; the transverse Doppler shift is km s-1, the gravitational redshift is km s-1, while the gravitational deflection of the maser positions is only as (Moran et al. 1995).
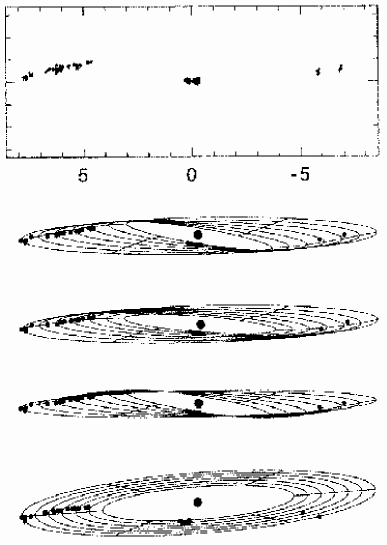
The VLBI observations of NGC 4258 are so exquisite to allow a most detailed study of the physical properties of the molecular disk (Moran et al. 1999; Neufeld & Maloney 1995; Neufeld, Maloney & Conger 1994). Herrnstein et al. (1996) convincingly argue that the disk is warped; the degree of warping can be constrained given the relative positions of the clouds on the sky, the line of sight velocities and the accelerations for each of the maser clouds. The warping can be represented by concentric rings with varying inclination and a progression in the line of nodes; Herrnstein et al. conclude that a model in which the line of nodes progresses by several (5 to 10) degrees from the inner to the outer edge of the disk fits the observations best. A few degree change in the position angle of the disk cannot be excluded from the observations, because of the limited coverage of the maser clouds (see Figure 14). The warp in the disk naturally explains the lower intensity of the blueshifted masers compared to the redshifted emission and might be a necessary condition for the maser emission to ensue (Neufeld & Maloney 1995).
The disk is found to be at most 0.01 mas (0.0003 pc) thick, giving it a height to radius ratio of . The disk is then likely close to hydrostatic equilibrium, so that ( is the Keplerian rotational velocity). Knowing the sound speed allows one to calculate Toomre’s parameter for the stability of a disk (cf Binney & Tremaine, 1987), where is the angular rotation speed. is found to decrease from the inside out, finally dropping below one (i.e. the disk becomes unstable) at the outer edge of the disk. Instability beyond this radius may be what sets the outer radius of the masing portion of the disk. The existence of the inner radius might result if the disk becomes geometrically flat at that radius (Neufeld & Maloney 1995).
Neufeld & Maloney (1995) estimate the mass accretion rate to be M⊙yr-1, where is a dimensionless parameter that conventionally characterizes the disk viscosity. They find that if the accretion rate has been constant over the years required for material to transit the disk from pc into the nucleus, the efficiency for conversion of rest mass into 2-10 Kev X-rays is . Since X-rays typically account for 10% of the total luminosity of AGNs (Mushotzky, Done & Pounds 1993), the required efficiency for generation of the bolometric luminosity is , in agreement with expectations from standard accretion disk models.
6.2 The Maser Emission in NGC 1068
Because of NGC 1068 key role in AGN physics, we will discuss the H2O maser observations in this galaxy in some detail. The prototypical Seyfert 2, NGC 1068 is the galaxy for which the existence of a parsec-scale, dense, dusty torus surrounding the nucleus was postulated to reconcile the spectral properties of Seyfert 1 and Seyfert 2 nuclei (Antonucci and Miller 1985). As mentioned at the beginning of this section, Clausen & Lo (1986) suggested that H2O maser emission in NGC 1068 might in fact arise from such an obscuring, molecular torus.
The maser emission, which spans a 300 km s-1 range from systemic velocity, was partially resolved into a 40 mas structure by Gallimore et al. (1996a,b&c) using VLA observations. Figure 15 shows the VLA positions of the masers relative to a 22 GHz continuum map.
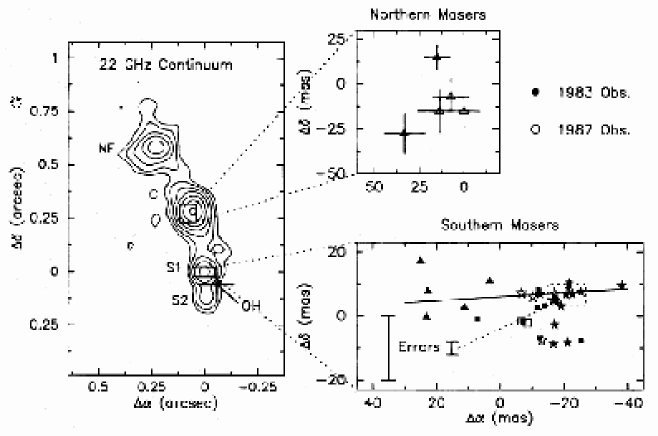
On the basis of its inverted radio spectrum, Gallimore et al. (1996a,b&c) identified the S1 feature shown in Figure 15 with the nucleus of the galaxy. This conclusion was subsequently reinforced by Thatte et al. (1997) using speckle and adaptive optics band and stellar 2.29 m CO absorption bandhead observations. To within the astrometric errors, the position of S1 coincides with that of the unresolved ( pc), heavily extincted band nucleus, and of the resolved ( pc), relatively young ( years) nuclear star cluster revealed by the CO observations. Thatte et al. (1997) speculate that the band thermal emission from the point source arises from dust that is at the sublimation temperature because of heating by the central engine. The sublimation is most likely occurring at the inner edge of the torus that hides the Seyfert 1 nucleus.
Also based on the radio spectra, Gallimore et al. (1996a,b&c) identify the radio knots C and NE (Figure 15) as knots in a jet that emanates from S1. They conclude that the jet hits a molecular cloud at C and is deflected by 20∘ toward the NE knot. They attribute the excitation of the H2O masers in knot C to a shock at the interface between the radio jet and a dense molecular cloud. In a subsequent paper Gallimore et al. (1997) used VLBI continuum measurements to resolve S1 into a clumpy structure with dimensions 1 pc in length and 0.2pc wide. S1 is approximately perpendicular to the direction of the local radio jet. They conclude that the radio continuum emission comes from a hot ( K) dense ( cm-3) plasma that is most likely heated and ablated from the inner edge of the molecular disk due to intense heating by the central AGN.
Further insight to the morphology of the innermost regions in NGC 1068 came from VLBI observations of Greenhill et al. (1996) and Greenhill & Gwinn (1997) who spatially resolved the high velocity maser emission (Figure 16).
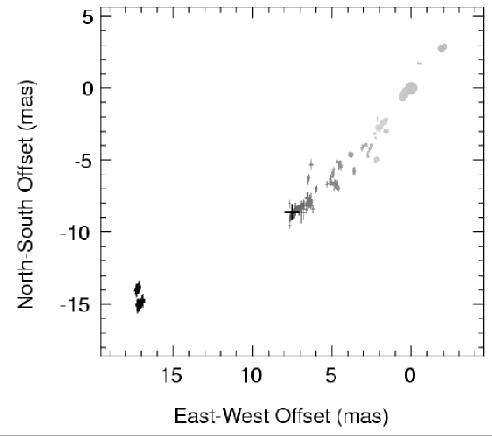
Greenhill & Gwinn (1997) plausibly interpret the nearly linear loci of H2O masers as a thin, flat, edge-on disk with rotation velocities of 330 km s-1 at 0.65 pc. The rotation axis of the disk does not correspond to the axis of the jet seen on larger scales. Assuming the disk is Keplerian (although they note that the rotation curve falls more gradually than predicted by Kepler’s law, as shown in Figure 17), Greenhill & Gwinn estimate the mass enclosed within 0.65 pc to be .
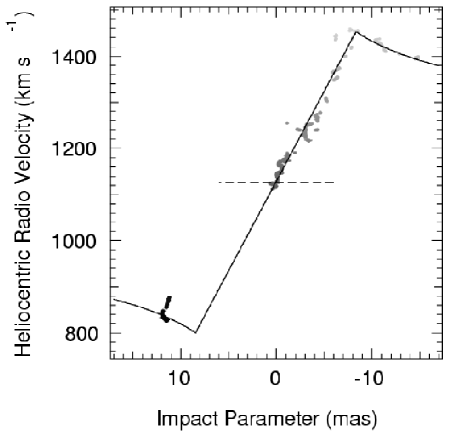
Although the NGC 1068 observations provide only partial evidence for the presence of a massive black hole (since Keplerian motion needs to be assumed), they do give us perhaps the clearest picture of the center of an AGN to date. The active nucleus produces a radio jet that is roughly perpendicular to the molecular disk. The central accretion disk is surround by a flattened, high temperature, high density “hot zone” that is likely heated by X-ray photoionization from the innermost accretion disk. The hot zone appears to be interior to the molecular disk. A luminous thermal infrared source composed of hot dust at the sublimation temperature is centered on the active nucleus. The hot dust is likely ablating from the inner radius of the molecular disk due to intense heating by the central source. The molecular disk and central black hole are at the center of a compact, relatively young nuclear star cluster that provides at least 10% of the nuclear bolometric luminosity.
6.3 H2O Masers in Other Galaxies
For the rest of the section, we will briefly touch upon additional H2O maser studies.
M51: Hagiwara et al. (2001a) used Effelsberg 100 m telescope and VLA observations of this Seyfert 2/LINER galaxy to find low-luminosity, high velocity (up to 120 km s-1) H2O maser clouds, distributed asymmetrically with respect to the systemic features. The maser emission is spatially unresolved, but based on slight offsets between the nuclear and maser positions, Hagiwara et al. conclude that the masers in M51 are most likely associated with the nuclear jet, although they cannot completely rule out the possibility that the emission originates from a circumnuclear disk.
Mrk 1419: Henkel et al. (2002) used the Effelsberg 100m telescope to detect H2O emission from the nucleus of this LINER galaxy. Both systemic and high velocity features are seen; for the former, a secular velocity drift of km s-1 yr-1 is detected. As for the case of M51, no spatially resolved observations of the maser clouds exist, but assuming that the emission originates in an edge-on Keplerian disk, the data implies a binding mass of M⊙ within 0.13 pc of the nucleus, corresponding to a mass density of M⊙ pc-3.
NGC 5793: VLA observations (Hagiwara et al. 2001b) detected both systemic and high velocity ( km s-1 relative to systemic) H2O maser clouds in the nucleus of this Seyfert 2 galaxy. The spatial distribution of the blueshifted clouds was resolved by the VLBI in two clumps with a separation of 0.16 pc but, unfortunately, both the systemic and redshifted features (which are variable) were too weak to be detected at the time of the VLBI observations. Assuming that the blueshifted features (which do not show any evidence of a velocity drift) arise from the edge of a Keplerian disk, Hagiwara et al. estimate a binding mass of the order of M⊙ within 0.13 pc of the nucleus, corresponding to a mass density of M⊙pc-3. VLBI imaging of the redshifted features will be necessary to exclude different scenarios, for instance one in which the highly blueshifted velocity of the maser features might trace outflowing gas surrounding the active nucleus.
IC 2560: H2O emission at the systemic velocity in this Seyfert 2 galaxy was detected by Braatz et al. (1996). Using single dish VLBI observations, Ishihara et al. (2001) detected high velocity clouds symmetrically distributed up to a 418 km s-1 on either side of the systemic velocity. Furthermore, they detected a secular velocity drift of the systemic features. The high velocity clouds are not spatially resolved; however, by assuming that the maser clouds lie in a Keplerian disk inclined 90∘ to the line of sight, Ishihara et al. measure a SBH mass of M⊙ within 0.068 pc, giving a density in excess of 2.1 M⊙pc-3.
NGC 4945: Greenhill, Moran & Herrnstein (1997) reported on VLBA observations of this starburst/Seyfert 2 galaxy. H2O emission at km s-1 is found symmetrically distributed on both sides of the systemic features. The rotation curve, however, is not as cleanly Keplerian as in the case of NGC 4258. Greenhill, Moran & Herrnstein note that while on the blue side the the velocities roughly decline with angular distance from the systemic emission, “the position errors are significant, the redshifted emission does not appear to mirror this structure, the decline in velocity for the blueshifted emission is faster than what is characteristic for a Keplerian rotation curve, and the non-point-source emission that seems to exist at some systemic and blueshifted velocities could not be mapped.” If the maser clouds are distributed in a Keplerian disk, the implied binding mass would be M⊙ within a volume of radius pc.
NGC 3079: The high velocity ( km s-1 relative to systemic) water maser features in NGC 3079 were studied with the VLBA by Trotter et al. (1998). The galaxy, which has a LINER nucleus, features a large scale ( pc), rotating molecular ring (Young, Claussen, & Scoville 1988; Sofue & Irwin 1992). The H2O maser clouds are confined within 0.5 pc of the center, but their distribution and velocity structure is consistent with them belonging to an “inward” extension of the molecular disk. In a simple Keplerian approximation, the implied binding mass is M⊙, although Trotter et al. note that “the velocity dispersion of clumps within the distribution and the suggestion of internal velocity gradients within the clumps indicate that non rotational, possibly turbulent motions are significant. The masers may arise in shocks driven by a wide opening-angle nuclear wind.”
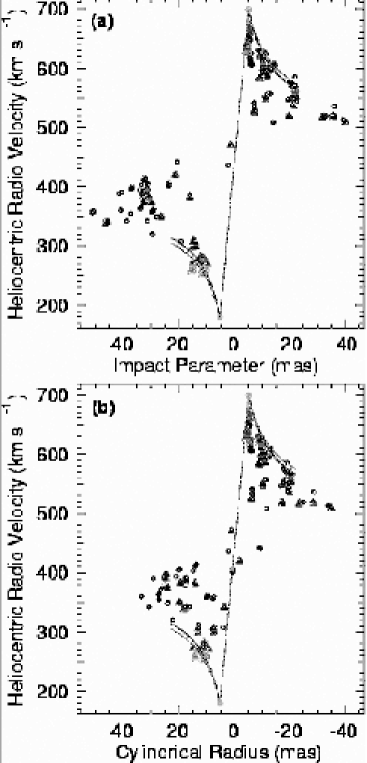
Circinus: Greenhill et al. (2003b) used VLBA observations to resolve the maser clouds into two distinct morphological and kinematical components. Some of the clouds trace a warped accretion disk extending from 0.1 pc to 0.4 pc from the center of this galaxy, with a peak rotational speed of 260 km s-1. A second population of clouds defines a wide-angle bipolar outflow up to 1 pc from the center. The clouds belonging to the disk follow a Keplerian rotation curve rather closely (Figure 18), implying a central mass of M⊙, corresponding to a mass density of M⊙pc-3. Greenhill et al. note that the inclination of the disk could not be measured directly, and therefore “formally, the mass and density estimates depend on the inclination and are lower limits”. Higher velocity (up to 460 km s-1) emission subsequently detected by Greenhill et al. (2003b), but for which no VLBI observations exist, might help to further define the velocity structure in this galaxy.
Section 7 GAS DYNAMICS OF NUCLEAR DUST/GAS DISK
In their seminal 1978 paper discussing stellar kinematics in the nucleus of M87, Sargent et al. note that the spectrum of the galaxy shows an [OII]3727 emission doublet with a broadened, unresolved component, plus a narrower, asymmetric feature. Although they “appreciate the dangers of associating the broad lines with gas clouds swirling around a massive object, especially in view of the possibility of ejection or infall”, Sargent et al. point out that the width of the narrow line, 600 km s-1, corresponds to the stellar velocity dispersion measured at the same radius. Interpreting the broadening of the unresolved component as due to Keplerian rotation, they notice that the implied mass is of the same order as that derived from the stellar dynamical modeling.
In the Galactic Center, gas kinematics hinted at the presence of a central mass concentration well before the spectacularly conclusive proper motion studies described in § 5.1. The sharp increase in the gas velocity from km s-1 at 1.7 pc, to 700 km s-1 at 0.1 pc implies a virial mass of a few M⊙ within this radius (Wollman et al. 1977; Lacy et al. 1980 and 1982; Crawford et al. 1985; Serabyn & Lacy 1985; Mezger & Wink 1986). Although often interpreted as evidence for a central black hole, concerns over the possibility of gas outflows or inflows ultimately limited the credibility of such claims (e.g. Genzel & Townes 1987).
Indeed gas, unlike stars, can easily be accelerated by non gravitational forces, and dynamical studies based on gas kinematics have often been quickly – and sometimes unjustly – dismissed by the establishment. For instance, as late as 1995, Kormendy and Richstone remark that although the H2O rotation curve of NGC 4258 “looks Keplerian”, “as usual it is not certain that gas velocities measure mass”. This concern is of course unfounded: NGC 4258, with the Milky Way, has given us the only undeniable proof of the existence of a SBH in a galactic nucleus, and the most reliable and elegant determination of its mass (§ 6.1). This frame of mind is no longer popular; the turning point, in our opinion, can be traced back to the early ’90s HST observations of NGC 4261 (Jaffe et al. 1993) and M87 (Harms et al. 1994; Ford et al. 1994). NGC 4261 was one of the first elliptical galaxies to be imaged with the Hubble Space Telescope, as part of a magnitude limited sample of 12 early type galaxies in the Virgo cluster. It was later realized that NGC 4261 should not have been included in the sample, since it in fact belongs to a small group of galaxies about twice as far as Virgo. Its inclusion turned out to be a lucky mistake: the image of the 270 pc, perfectly defined nuclear dust disk surrounding the bright non-thermal nucleus of the galaxy (Figure 19), has since gone on to become one of the most popular of all Hubble’s images.
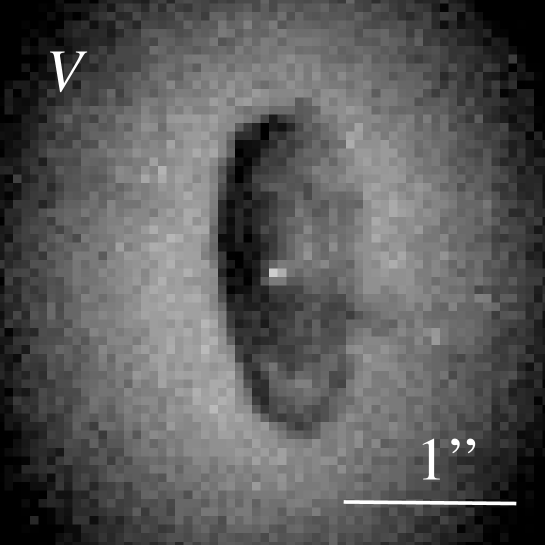
NGC 4261 is a well studied FR-I radio galaxy (e.g. Jones et al. 2000), and the disk, which is roughly perpendicular to the radio jets, immediately evokes textbook sketches of the inner molecular torus which is at the heart of the AGN paradigm (Antonucci & Miller 1985). The moment the HST image of NGC 4261 was downloaded, it was realized that the regularity of the dust disk must reflect the signature of material in cold, circular rotation – if verified by kinematical data, the major objection to using gas to trace gravity would be lifted. HST spectra of NGC 4261 had not yet been taken, but they were available for Virgo’s cD galaxy, M87. Narrow band H+[NII] images of M87 showed the presence of a disk-like structure, although not as regular as the one seen in NGC 4261 (Ford et al. 1994, Figure 20). Spectra taken with the 0′′.26 Faint Object Spectrograph (FOS) at five different locations (including one centered on the nucleus) showed that the gas velocity reached km s-1 12 pc on either side of the nucleus (Harms et al. 1994). If interpreted as due to Keplerian motion, this implies a central mass of M⊙. The limited amount of kinematical information available to Harms et al. did not allow for very sophisticated modeling; not only was Keplerian motion assumed, but also the inclination angle of the disk was fixed to the value estimated by Ford et al. (1994) from the analysis of the narrow band images. The correctness of these assumptions was verified a few years later by a much more extensive kinematical survey of the disk, using the HST Faint Object Camera (FOC) (Macchetto et al. 1997). The 0′′.062 wide FOC slit was positioned at the nuclear location and on either side, which sampled the disk at over 30 (roughly) independent positions within 0′′.5 of the nucleus, at a spatial resolution of 3 pc. This allowed for very detailed dynamical modeling to be performed, leaving virtually no doubt as to the presence of a M⊙ SBH (Figure 21).
THIS FIGURE IS INCLUDED IN THE FULL VERSION OF THE
MANUSCRIPT AVAILABLE AT http://www.physics.rutgers.edu/ lff/publications.html.

A kinematical study of NGC 4261 followed in 1996 (Ferrarese et al.), claiming a M⊙ SBH. In the meantime, it started to become apparent that nuclear dust/gas disks are not uncommon in early type galaxies. The most recent and statistically complete study (Tran et al. 2001) finds NGC4261-type disks in 18% of early type galaxies, and almost 40% of early type galaxies with IRAS 100 m emission. Figure 22 shows some examples of such disks. Tran et al. (2001) find that all galaxies hosting dust disks show signs of nuclear activity, and in almost all cases the disks are aligned with the major axes of the galaxies in which they reside. The origin of the dust (the two possibilities being internal from stellar mass loss, or external from merging or interactions with other galaxies) remains undetermined (Ferrarese & Ford 1999; Tran et al. 2001).
By 1996, it had become apparent that the kinematics of dust disks was a powerful tool to constrain the central potential in early type galaxies, and many such studies began to be published. At present, SBHs have been claimed in 11 galaxies thanks to dynamical studies of gas/dust disks; for all, the SBH sphere of influence was resolved (see TableLABEL:tab:allmasses for a complete list). These studies proved even more valuable because they could target the very objects for which stellar dynamical studies fail, i.e. bright, pressure supported ellipticals like M87. In fact, stellar and gas dynamical studies are complementary. Gas disks are not common in the elongated, fainter ellipticals with higher central surface brightness that are the preferred targets of stellar dynamical studies. Furthermore, the very presence of the disks makes stellar dynamical studies observationally challenging, because of the large amount of dust obscuration. The downside is that there are few objects for which a dynamical measurement of based on stellar and gas dynamics can be compared. Only one, IC1459 (Cappellari et al. 2002) has been studied so far; we will return to IC1459 later in this section. Studies to explore the possibility of using the kinematics of cold disks to constrain the central potential in spiral galaxies are also underway (Marconi et al. 2003; Sarzi et al. 2001)
THIS FIGURE IS INCLUDED IN THE FULL VERSION OF THE
MANUSCRIPT AVAILABLE AT http://www.physics.rutgers.edu/ lff/publications.html.
Constraining the central mass using gas dynamical data proceeds through the following steps:
-
1.
The stellar surface brightness profile is deprojected to give a stellar luminosity density (an inclination angle for the galaxy is assumed). This is converted to a mass density by adoption of a (generally constant) mass to light ratio, which enters the models as a free parameter. Given the mass density, the stellar potential is calculated using Poisson’s equation. The stellar contribution to the circular velocity at any given radius is then simply determined by the stellar mass enclosed within that radius.
-
2.
The contribution to the circular velocity due to the dust/gas disk itself is computed in a similar way. The mass of the disk can be measured directly if images are available in multiple passbands, so that the amount of extinction can be determined. This requires a knowledge of the visual mass absorption coefficient, reddening law, and gas-to-dust mass ratio, all of which are reasonably well constrained (see Ferrarese & Ford 1999). The mass of the disk itself generally turns out to be too small (of the order - M⊙) to be of any dynamical relevance (e.g. Ferrarese & Ford 1999; Barth et al. 2001)
-
3.
An additional contribution to the rotational velocity comes from a central point mass , which is obviously kept as a free parameter in the models.
-
4.
The rotational velocity (which is calculated in the plane of the disk) is projected along the line of sight. This requires knowledge of the inclination angle of the disk. Although this should be a free parameter, it can not always be constrained from the data (e.g. Harms et al. 1994; Sarzi et al. 2001). In these cases, the inclination angle is fixed to the value measured from the images, under the assumption that the disk is flat all the way into the center.
-
5.
The comparison between the line of sight velocities predicted by the model and the observed velocities, depends on four additional parameters: the and projected positions of the center of the slit relative to the kinematical center of the disk, the angle between the line of node of the disk and the slit’s major axis, and the systemic velocity of the disk. All are treated (if possible) as free parameters.
-
6.
Finally, the model must be artificially “degraded” to simulate the observing conditions: in particular, the blurring introduced by the finite pixel size, as well as slit width must be taken into account. This step, which is very nicely described in Barth et al. (2001), depends on the emission line surface brightness within the disk, as well as on the intrinsic and instrumental velocity dispersion of the line. The reason for this is that the contribution to the velocity observed at any given position is given by the integrated contribution at each neighboring positions, entering with a weight which depends on the broadening and strength of the line at each point.
-
7.
The free parameters in the model, namely the inclination angle of the disk, the position of the center of the slit relative to the kinematical center of the disk, the angle between the line of node of the disk and the slit’s major axis, the systemic velocity of the disk, the mass-to-light ratio of the stellar population, and the mass of the central SBH, are varied until the best fit to the data are obtained.
For gas dynamical studies to be robust, a two dimensional velocity field is essential (to be fair, the same is true of stellar dynamical studies, for which such data are never available – de Zeeuw 2003; Verolme et al. 2002). In the case of gas kinematics, the 2-D velocity field is necessary to verify the critical underlying assumption that the gas motion is indeed gravitational and the gas is in equilibrium. It must be pointed out that as long as the motion is gravitational, the gas does not necessarily have to be in circular rotation in a geometrically thin disk for the data to be useful. In fact, since the very first studies, it has been noted that the emission lines are broadened beyond what is expected from simple thermal broadening and instrumental effects (e.g. Ferrarese et al. 1996; Ferrarese & Ford 1999; van der Marel & van den Bosch 1998; Verdoes Kleijn et al. 2000; Barth et al. 2001). The origin of the broadening is not well understood and has been interpreted either as microturbolence within the disk (Ferrarese & Ford 1999; van der Marel & van den Bosch 1998; Marconi et al. 2003) or as evidence of non-circular motion, as could be expected if the gas is fragmented into collisionless clouds that move ballistically, providing hydrostatic support against gravity (Verdoes Kleijn et al. 2000; Barth et al. 2001; Cappellari et al. 2002). In their analysis of NGC 3245, Barth et al. conclude that the mass of the central SBH should be increased by 12% to account for non-circular motions. In either case, turbulence and asymmetric drifts can and have been successfully incorporated in the modeling (e.g. Verdoes Kleijn et al. 2000; Barth et al. 2001), although doing so requires high S/N data with a wide spatial coverage.
Cases in which the gas is affected by non-gravitational motions or is not in equilibrium can also be recognized from high resolution kinematic maps of the ionized gas. In NGC 4041, a quiescent Sbc spiral, Marconi et al. (2003) remark that the systematic blueshift of the disk relative to systemic velocity might be evidence that the disk is kinematically decoupled. They conclude that only an upper limit, of M⊙, can be put on the central mass. Cappellari et al. (2002) conclude that non-gravitational motions might indeed be present in the case of IC 1459, for which the ionized gas shows no indication of rotation in the inner 1′′. IC 1459 is the only galaxy for which a SBH mass estimate exists based both on gas and stellar kinematics (Cappellari et al. 2002). Three-integral models applied to the stellar kinematics produce M⊙, while the gas kinematics produces estimates between a few and M⊙, depending on the assumptions made regarding the nature of the gas velocity dispersion. Unfortunately, the authors express strong reservations as to the reliability of either mass estimate. As mentioned above, there is evidence that the gas motion might not be completely gravitational, which would invalidate the method entirely. On the other hand, they also note that the HST stellar spectra “do not show any obvious evidence for the presence of a BH”, and conclude that the “BH mass determination [in IC 1459] via the stellar kinematics should be treated with caution”.
Other systematics in gas dynamical study are of a more technical nature. Maciejewski & Binney (2001) point out that neglecting to account for the finite size of a wide slit can introduce systematic errors in the measured masses. The reason for this is that if the slit is wider than the instrumental resolution, the position and velocity information become entangled. As a consequence, intrinsically gaussian emission lines profiles could become asymmetric or even display multiple peaks. The degree to which this takes place is very sensitive not only to the slit width (relative to the instrumental PSF), but also to the gradient in the velocity field: spectra for galaxies with large velocity gradients, and observed with wide slits, are affected the most. From a practical point of view, if the features artificially introduced by the slit in the line profiles are mistaken for distinct kinematical components, the measurement of the rotational velocity, and therefore the estimate of , could be affected. Maciejewski & Binney indeed argue that this could be the case for Bower et al’s 1998 HST/STIS observations of M84, observed with a 0′′.2 slit, and estimate that Bower et al. mass could have been overestimated by as much as a factor 4 because of this effect. The earlier observations which used FOS aperture spectroscopy matched to the FOS resolution (Harms et al. 1994; Ferrarese et al. 1996; Ferrarese et al. 1999) as well as the FOC observations of M87 (Macchetto et al. 1997), which used a very narrow slit, are not affected by this bias. The most recent investigations (Cappellari et al. 2002; Verdoes Kleijn et al. 2000; Barth et al. 2001) take the finite slit width into account.
In view of the above discussion, gas kinematics is a transparent and therefore potentially powerful tracer of the central potential – in our view more so than stellar kinematics. The criticism that gas can be subject to non gravitational motions is a strength rather than a weakness. Non gravitational motions can be recognized from the data, and detecting them leaves no doubt that the data are unsuitable for dynamical studies. The modeling is more transparent than in the case of stellar dynamics. Either the Keplerian motion is detected or it isn’t – in the first case a SBH mass can be measured, in the second it can’t. Proof of this is that there have been no SBH detections based on gas kinematical data which did not resolve the sphere of influence. This is in sharp contrast with stellar dynamical cases, where one third of the claimed detections are based on data for which the sphere of influence is unresolved. Moreover, for many of the stellar dynamical SBH detections the data shows no evidence of Keplerian motion, even when the sphere of influence is resolved (e.g. Gebhardt et al. 2003). Figure 23 shows the percent error quoted on all SBH detections listed in Table LABEL:tab:allmasses, plotted against the degree with which the SBH sphere of influence is resolved by the data. The errors and masses are as quoted in the original papers; filled and open circles are detections from gas and stellar kinematics respectively. While, as expected, detections based on gas kinematics became increasingly less secure as the resolution (relative to the SBH sphere of influence) worsens, this does not appear to be the case for detections claimed based on stellar dynamical studies. In fact, rather surprisingly, the most secure detections (as secure, at face value, as the detections in the Milky Way and NGC 4258) based on stellar kinematics appear to be in galaxies for which the SBH sphere of influence was either not or only marginally resolved (e.g. NGC 3384, NGC 1023).

Section 8 BLACK HOLE MASSES IN LUMINOUS AGNs.
Even for the heftiest SBHs, state of the art telescopes and spectrographs lack the ability to spatially resolve the sphere of influence in galaxies farther than km s-1. Beyond, dynamical estimates of the central mass, using the methods described in the preceding sections, become infeasible. A way to measure black hole masses in more distant, quiescent galaxies or low luminosity AGNs has yet to be devised: if M87 were at the distance of one of the closest quasars, 3C273, its BH mass could not be measured. For some AGNs and quasars, however, alternative techniques are available.
Two of these techniques, fitting accretion disk models to multiwavelength continua spectra (§ 8.1; Shields 1978; Malkan 1983), and the study of the 6.4 KeV emission line due to iron fluorescence (§ 8.2; see Fabian et al. 2000; Reynolds & Nowak 2003 for recent reviews) rely on the existence of geometrically thin, optically thick accretion disks. The study of the 6.4 keV emission in particular gives us the most direct and powerful view of the region within a few gravitational radii of the central engine. Its use in deriving SBH masses is currently hampered by the limited energy resolution and collective area of available X-ray satellites, but might be within reach of future missions (e.g. XEUS and Constellation X). Spectral fitting to the UV/optical continuum is a powerful diagnostic of the physics of accretion in particular classes of AGNs. However, because of their complexity, the models cannot yet reliably measure SBH masses in individual objects.
The other two techniques we will discuss rely on spectral observations of the broad optical emission lines which characterize the spectra of Seyfert 1 galaxies and quasars. One of these, reverberation mapping, has great potential. The method, which can be applied to Seyfert 1 galaxies and quasars with a variable continuum source, is extremely demanding from an observational standpoint, but the theoretical formalism is well described, and a better understanding of the systematics is well underway. Photoionization models applied to the BLR, on the other hand, require only simple observations, but rely on a heavy set of assumptions. Their usefulness is mainly statistical.
Finally, we will discuss some “secondary mass estimators”. These are based on empirical relations between SBH masses (or quantities related to the masses) and other, easily measurable, AGN properties. Such relations can be calibrated using galaxies for which the SBH mass is measured independently, for instance through reverberation mapping. Although they can lead to mass estimates in error by a factor of several in individual objects, these relations have the obvious practical advantage that they can be easily applied to large samples of objects. Hopes for studying the redshift evolution of SBH scaling relations (§ 9) lie largely in these relations.
8.1 Spectral fitting to the Big Blue Bump
Twenty years have passed since the realization that the blue and ultraviolet spectra of most quasars and Seyfert 1 galaxies show a marked excess flux over the extrapolated infrared power law spectrum (Shields 1978; Richstone & Schmidt 1980; Malkan & Sargent 1982). In two ground breaking papers, Shields (1978) and Malkan (1983) attributed the origin to what became affectionately known as the “big blue bump” to thermal emission from a geometrically thin, optically thick accretion disk surrounding the central SBH.


A comprehensive review of spectral models for accretion disks, detailing the assumptions as well as shortcomings of the models, and comparison with the observations, can be found in Krolik (1998). In its basic form, the model assumes local heat balance (i.e. the heat generated by viscosity within the disk is radiated locally through the disk surface), a Keplerian velocity field, and negligible pressure gradient and velocity (i.e. small accretion rates) in the radial direction. To zeroth-order, the spectrum can then be calculated by dividing the disk in concentric annuli, each radiating as a blackbody with effective temperature steadily decreasing outwards. While several problems can be identified, most notably the fact that the accretion rates derived often exceed the limit above which the disk ceases to be geometrically thin (Szuszkiewicz, Malkan & Abramowicz 1996), this simple model can reproduce the blue/UV part of the spectrum reasonably well, given only three parameters: the mass of the central SBH, the mass accretion rate, and the inclination angle of the disk. More complex and realistic models have been explored since then, and include relativistic effects in inclined disks surrounding both Kerr and Schwarzschild SBHs (Sun & Malkan 1989), modification to the black body spectrum due to electron scattering, comptonization and irradiation of the surface of the disk by an external X-ray source (Ross, Fabian & Mineshige 1992; Siemiginowska et al. 1995), and the presence of an inner shock front inside which the flow becomes supersonic, and the disk gives way to a hot, ionized, pressure supported torus. Geometrically thick disks able to support accretion rates comparable to the Eddington rate have also been studied (Szuszkiewicz, Malkan & Abramowicz 1996; Sincell & Krolik 1998; Wang et al. 1999; Hubeny et al. 2000). Figure 24 (from Hubeny et al. 2000) represents recent simulations showing the effects of varying SBH mass and accretion rate on the emerging integrated spectral energy distribution, for a disk seen nearly face-on.
Spectral fitting to the optical/UV/soft X-ray continuum provides a powerful tool to study the physical mechanisms that regulate AGN activity. Its value in measuring SBH masses is however limited. The potential systematic errors in the derived masses are large, due to the complex, and largely unknown, physical processes at play. Furthermore, the models rarely do a good job at fitting the available data, and often the SBH mass and other parameters enter the models in a degenerate way. For instance, Szuszkiewicz, Malkan & Abramowicz (1996) and Sincell & Krolik (1998) shows that the shape of the spectrum is determined mainly by the ratio of the SBH mass to the accretion rate, rather than by the two quantities independently.
8.2 The Iron K Emission Line
X-ray production in Galactic black hole candidates as well as Seyfert nuclei is generally credited to inverse Compton scattering of soft optical/UV photons off a population of hot electrons (Thorne & Price 1975; Sunyaev & Truemper 1979; Zdziarski et al. 1994). While the details of the model are not entirely agreed upon (see for instance the excellent review in Reynolds & Nowak 2003) the general picture is that of a geometrically thin, optically thick accretion disk generating UV photons, and surrounded by a Comptonizing population of thermal electrons in the form of a hot corona, produced by evaporation at the surface of the disk. The hard X-rays produced in the hot corona irradiate and are in turn reprocessed by the cold surface of the accretion disk, producing Compton reflection and fluorescence in the low-ionization Compton thick material (e.g. Reynolds 1996). Indeed, the detection of a hard reflection ‘hump’ above 10 keV, and of the iron K fluorescence line emission at 6.4 keV by the Ginga and ASCA X-ray satellites respectively, provide the most direct evidence for the existence of thin accretion disks in these objects (Piro, Yamauchi & Matsuoka 1990; George & Fabian 1991; Matt, Perola & Piro 1991; Matt et al. 1992; Fabian et al. 1995). Moreover, the study of fluorescent iron emission strongly suggests that the central regions in Seyfert 1 galaxies are under the influence of the extremely strong gravitational field expected in the presence of a supermassive black hole.
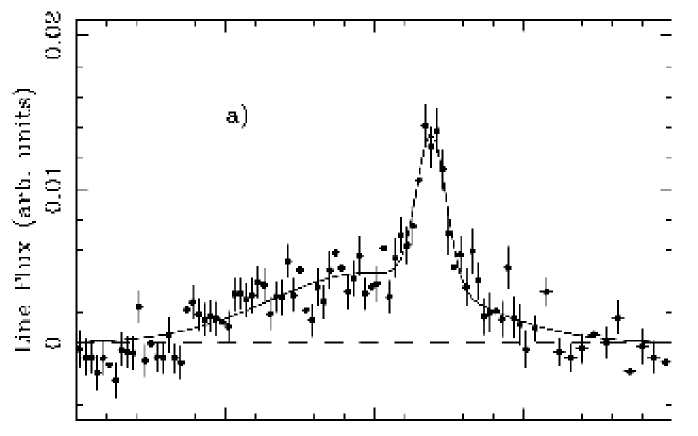
Broad K line emission seems to be an almost ubiquitous property of the X-ray spectra of Seyfert 1 galaxies, being detected in of cases (Nandra et al. 1997; Reynolds 1997; but see also Done et al. 2000; Gondoin et al. 2001a&b). The first detection of K iron emission was made by Exosat in the Seyfert 1 galaxy MCG-6-30-15 (Nandra et al. 1989), but it was only thanks to the higher energy resolution of ASCA that the line width and profile could be studied in detail (Tanaka et al. 1995; Nandra et al. 1997). The line mean energy (6.34 0.04 Kev, Nandra et al. 1997) implies that the line originates from fluorescence in the cold, low ionization (FeXVI), thin (0.1% to 1% of the total disk’s thickness) outer layer of the accretion disk (Fabian et al. 2000). The line is expected to be intrinsically narrow, but ASCA revealed it to be extremely broad and significantly skewed. Figure 25 is a composite line profile produced by combining the data for 14 Seyfert 1 galaxies observed with ASCA (from Nandra et al. 1997). The full width at zero intensity exceeds keV, or . The narrow ( eV) blue peak of the line is centered around the rest wavelength of 6.4 keV, but the line itself extends dramatically to the red. The line profile can be reproduced remarkably well if it is assumed to originate from a rapidly spinning accretion disk within a few gravitational radii of the central SBH. The disk rotation splits the line in two (in analogy with HI line emission in the outer disks of spiral galaxies). Relativistic beaming enhances the blue over the red component, and gravitational redshift strongly smears the emission from the innermost regions of the disk into an extended red wing. While the blue peak moves progressively to higher frequencies the higher the inclination (more edge on) of the disk, the redward extent of the line is more strongly influenced by relativistic effects, and is a sensitive function of the innermost radius of the line emitting region. Alternative explanations to describe the line profile were suggested by Fabian et al. (1995) but quickly rejected; these include Comptonization producing a net redshift of the line, jet and outflow geometries producing a marked asymmetric profile, or photoelectric absorption cutting into the blue side of the line.
In the surviving disk interpretation, the iron K line becomes a powerful testbed for the immediate environment around the central SBH, as well as a unique tool for testing our knowledge of the properties of space and time in very strong gravitational fields. The line profile can not only be used to determine the inclination of the accretion disk but also the spin of the central black hole (albeit with some ambiguity: see discussion in Reynolds & Nowak 2003); if the line emitting gas extends all the way to the innermost stable orbit , a much broader and more extended red wing is expected for a maximally rotating SBH than for a static one, as a consequence of the shrinkage of in a Kerr metric (§ 2; Fabian et al. 1989; Laor 1991; Martocchia & Matt 1996; Reynolds & Nowak 2003). Indeed, ASCA and XMM observations of MCG-6-30-15 are best explained under the assumption of an almost maximally spinning SBH (Iwasawa 1996; Dabrowski et al. 1997; Wilms et al. 2001). We mention in passing that in the cases studied in detail, the line profile points to an average inclination angle for the disk of 30∘ (Nandra et al. 1997), consistent with the postulates of the unification models of AGNs (Antonucci 1993). Most of the emission is produced at 20, with an inner radius for the emitting region extending to a few .
The next step in the study of the Iron K line will require the increase in spectral resolution and collective area afforded by the next generation of X-ray satellites. If the Fe K line responds to flares in the X-ray continuum produced in the corona above the accretion disk, then the disk structure can be studied using ‘reverberation mapping’ techniques (Young & Reynolds 2000; Fabian et al. 2000), which can potentially lead to a robust measurement of the SBH mass (see § 8.3). The timescale expected for the line to react is of order of the light crossing time at one gravitational radius, s, which is unfortunately shorter than the integration time required by current satellites to collect enough X-ray photons for a meaningful measurement. It should be mentioned, however, that preliminary results, based on limited variability studies conducted with ASCA in NGC 3516 and NGC 4151, point to a picture far more complex than expected (or hoped). The variability pattern of the line seems to change with time and, even more damming, at least in one case line and continuum variations seem to be uncorrelated (Nandra et al. 1997; Nandra et al. 1999; Wang et al. 2001; Takahashi et al. 2002).
8.3 Reverberation Mapping
According to the unification scheme of AGNs (Antonucci 1993; Urry & Padovani 1995; Figure 26), the central black hole and accretion disk are completely surrounded by an obscuring, geometrically thick molecular torus. The existence of the torus is strongly supported by polarization maps (e.g. Watanabe et al. 2003), infrared observations (e.g. Reunanen et al. 2003), as well as by the H2O maser observations discussed in § 6. The geometry and extent of the torus are dictated by the requirement that, to account for the well known polarization properties of Seyfert 1 and Seyfert 2 galaxies, the Broad Line Region (BLR) must be entirely enclosed within it, while the Narrow Line Region (NLR) – which extends from a few to several thousand parsecs (Pogge 1989) – must be largely outside. According to the standard model, the BLR consists of many (, Arav et al. 1997, 1998; Dietrich et al. 1999), small, dense ( cm-3), cold ( K) photoionized clouds (Ferland et al. 1992; but see also, e.g., Smith & Raine 1985, 1988; Pelletier & Pudritz 1992; Murray et al. 1995; Murray & Chiang 1997; Collin-Souffrin et al. 1988). Even if direct observational constraints on the BLR geometry are lacking, the emerging picture, which we will discuss in more detail below, is that of a BLR which extends from a few light days to several tens of light weeks from the central engine. Although a factor 10 to 100 times larger than the inner accretion disk, and three orders of magnitudes larger than the Schwarzschild radius of the SBH which powers the AGN activity, the BLR is, and will remain, spatially unresolved even using space based instrumentation. In the early ’80s it was realized that, while preventing direct imaging, the closeness of the BLR to the ionizing continuum source might open a new, unconventional way to map its properties. Short-term continuum variability is a staple of AGNs (and indeed is undisputed evidence of the compactness of the central engine); if the delayed response of the line emitting region to changes in the continuum source is regulated by light-travel time from the latter to the former, then the time lag between variations in the ionizing continuum and in the flux of each velocity component of the line emission directly probes the spatial structure and emissivity properties of the BLR. The technique is widely known as “reverberation” or “echo” mapping (Blandford & McKee 1982; Peterson 1993; Peterson 2002). It requires long-term, careful monitoring of both continuum and broad emission lines, and it can of course only be applied to those AGNs in which the BLR is directly observable, namely Type 1 Seyferts and quasars.
THIS FIGURE IS INCLUDED IN THE FULL VERSION OF THE
MANUSCRIPT AVAILABLE AT http://www.physics.rutgers.edu/ lff/publications.html.
In practice, reverberation mapping has so far failed to deliver a picture of the central regions of AGNs, not because of fundamental flaws in the theoretical reasoning, but rather because of inadequate observational data, a fact that could, and hopefully will, be rectified by future, dedicated spacecraft missions (Peterson 2003). Past and current experiments have however led to accurate measurements of the time delay between velocity-integrated line emission variations, and continuum flux, which can (but see Krolik 2001) be taken as a measure of the average BLR size. If assumptions are made regarding the geometry of the BLR, and it is further argued that the motion of the clouds is gravitational, then the binding mass can be rather trivially derived from the virial theorem: . Here, the BLR radius is known from the reverberation measurements, the mean velocity is given by the emission line width, and the factor depends on the geometry and kinematics of the BLR.
As a mass estimator, reverberation mapping has several important advantages. First, the region probed is only a factor 1000 beyond the Schwarzschild radius of the central SBH. This might seem large, but it is still at least a thousand times closer to the central engine than the innermost radius reached by ‘traditional’ methods based on resolved kinematics. The implied mass densities (Table I) are in excess of M⊙ pc-3, leaving little doubt that if the measurements can indeed establish a mass reliabily, this must belong to a supermassive black hole, since no cluster configuration could be stable under these conditions (e.g. Rees 1984). Second, bright Type 1 AGNs, the ideal targets of reverberation mapping, cannot be easily probed using standard techniques, precisily because the bright AGN continuum overwhelms the dynamical signature of the gas and dust needed for resolved dynamical studies. Although it can be argued that Type 1 AGNs comprise only 1% of the total galaxy population, exploring the SBH mass function in as many and as diverse as possible galactic environments is essential to understand the evolutionary histories of SBHs. Third, unlike SBH masses derived from resolved kinematics, those inferred from reverberation mapping do not depend on the cosmology adopted. Because the BLR size is measured directly in physical units from the time delay, the distance to the host galaxy does not enter the analysis. This means that the redshift to which reverberation mapping measurements can be pushed is limited only by the requirement that the AGN must be bright enough to be easily detected. Forth, reverberation mapping is intrinsically unbiased with respect to the mass of the SBH, since spatially resolving the sphere of influence (whose size depends on the mass) is irrelevant. Very small SBHs can be probed as long as the monitoring can be carried out on short enough timescales, and viceversa for very massive SBHs.
Time lags, in some cases in multiple emission lines, have now been measured for 37 AGNs (§ 8.3.1); the inferred virial masses, listed with the appropriate references in Table IV, have formal random uncertainties which rival those of resolved gas and stellar dynamical studies. However, systematic uncertainties can in principle be a factor of several or more (Krolik 2001). To date, the most compelling evidence supporting the reliability of reverberation mapping is observational; AGN reverberation masses obey the same scaling relations observed in quiescent galaxies, for which SBH masses are measured using “proven” traditional techniques (§ 8.3.2).
8.3.1 Results of AGN Monitoring Programs
Reverberation mapping was not originally devised with the intent of measuring SBH masses – but rather as a way to probe the kinematical and morphological structure of the BLR. However, for the reasons outlined in the previous section, it holds high promise of becoming the method of choice for mass determinations, replacing resolved kinematical studies at least in galaxies beyond a few hundred megaparsecs. It is therefore instructive to review the observational requirements of the method, the monitoring programs that have led to the masses listed in Table IV, and what we have learned from them about the structure of the BLR.
Although variability in quasars has been known since the early ’60s, and in Seyfert galaxies since the late ’60s, methodical UV/optical monitoring did not start until the early ’80s. The most extensive efforts have been carried out by the International AGN Watch (Peterson 1999). The project started in the late 1980s as an IUE and ground-based optical program to monitor NGC 5548, to-date the most extensively monitored AGN, and was soon expanded to include ground based and eventually HST monitoring. Since then, the project has monitored eight additional Seyfert 1 galaxies, including five in more than one emission line (see Wandel, Peterson & Malkan 1999 for a compilation). Additional programs were led by Bradly M. Peterson at Ohio State University (nine previously unobserved Seyfert 1s); Shai Kaspi at Wise/Steward Observatory (17 quasars, Kaspi et al. 2000), and the LAG (Lovers of AGNs) consortium, to which goes our prize for the most clever acronym. LAG, led by the late M.V. Penston, monitored eight Seyfert galaxies and quasars, three of which had not been previously observed (Stirpe et al. 1994 and references therein). With the exception of the International AGN Watch, which included UV, optical and X-ray monitoring (although not for all objects), all studies focused on optical monitoring of the continuum and H emission, although H emission was also monitored for some objects.
The fact that more progress has not been made on the observational front might at first seem surprising. In fact, monitoring programs are exceedingly demanding, to the point that the efforts mentioned above should be considered nothing short of heroic. On the upside, Type 1 AGNs are normally very bright, so large telescopes are generally not necessary for variations in the continuum to be easily detected – indeed, all ground based monitoring has been conducted with one to two-meter class telescopes. Photometric conditions are desirable but not strictly necessary, since the continuum and line flux can be calibrated against a non-variable spectral component (e.g. a narrow emission line) or by simultaneously observing a nearby (non-variable!) star (Peterson 2002). On the downside, observing conditions must be controlled and stable, or spurious variations can easily be introduced. For instance, the amount of light from the non-variable galactic component (NLR or underlying galaxy) entering the spectrograph depends on seeing conditions, pointing accuracy and guiding stability. If these conditions are not controlled, a change in any of them could easily be mistaken for a bona-fide variation in the AGN continuum flux. The time sampling of the data should ideally be 10 to 30 times shorter, and the total duration of the experiment 10 to 30 times longer, than the expected time lag (Krolik 2001). This implies that spectra should be obtained a few hours to several weeks apart, depending on the size of the BLR under study, and that monitoring should extend over a several year period for the most massive systems. This mandates the use of a dedicated telescope.
The results of these AGN monitoring programs are beautifully described in Peterson (2002). They conclusively demonstrated that although variations in the AGNs’ continua are aperiodic (periodicities have been searched for but never found), they correlate tightly with and precede variations in the broad emission lines flux (Figure 27; Peterson 2002; Onken & Peterson 2002; Onken et al. 2003)666Curiously, the physical drive for the continuum variability itself is still unclear. Some clues are given by the fact that in all of the objects studied so far, there is no apparent time delay between variations in the UV and in the optical, arguing against mechanical instabilities in the accretion disk or random fluctuations in the accretion rate as responsible for the fluctuations (these mechanism would propagate from the inner and hotter to the outer and cooler part of the disk, stimulating variations in the UV continuum first and in the optical later). The leading theory is that continuum variations might be caused as the disk reprocesses the hard X-rays produced in the surrounding corona. Further clues as to the fundamental physics that regulates the continuum variability (including perhaps the mass of the central SBH, Edelson & Nandra 1999) are held in the power density spectrum of the X-ray fluctuations (e.g. Belloni & Hasinger 1990; Haardt & Maraschi 1991, 1993; Zdziarski et al. 1994; Stern et al. 1995; Bao & Abramowicz 1996).. This is, of course, a necessary condition for reverberation mapping studies to be viable. It is strong evidence that, from the perspective of the BLR, the continuum source must be point-like; if the BLR and the continuum emission were spatially coexisting, the time delays would be chaotic, since it should be quite possible to have emission line variations from one part of the BLR precede variations in the continuum from a different part (indeed a similar situation might affect the 6.4 keV Fe K line emission, as discussed in § 8.2).
The time delay between continuum and optical emission line variations, measured by cross-correlating the continuum and emission light curves, can be of days to weeks. This time delay is a direct measure of the “responsivity weighted” size of the BLR777This is true only if the BLR structure does not change over the duration of the monitoring program. This condition is satisfied for programs shorter than the dynamical cloud crossing time, typically a few to several years. A longer monitoring program has been conducted only for NGC 5548., which is approximated by the radius where physical conditions (e.g. the particle density) produce the strongest line response for a given continuum change. The responsivity weighted size of the BLR depends on the ionization potential of the line and on the continuum flux, and therefore can change with time. In NGC 5548, the only AGN for which there is sufficient information on the long term behavior of a single line (H) to measure both the line widths and lags as a function of time, the lag is observed to become longer as the continuum brightens (Peterson et al. 2002). This is exactly what is expected. As the continuum brightens, the radius of the Strömgren sphere, i.e. the depth to which the BLR is ionized, increases, and therefore the responsivity weighted size of the emitting region becomes larger. Furthermore, when more than one line is monitored, the highest ionization lines respond most rapidly, and are hence produced closer, on average, to the central continuum source. Although the data are quite sparse, radial (out or inflow) motions do not seem to be dominant. A radial flow would be reflected in a difference between the time lag measured for the blue and red wings of the line; such difference is generally not detected (e.g. Koratkar & Gaskell 1991; Wanders & Horne 1994; Wanders & Peterson 1996; O’Brien et al. 1998; Sergeev et al. 2002), although a mild radial flow has been claimed by Kollatschny (2003) in the Seyfert 1 Mrk 110.
When using reverberation mapping to calculate SBH masses, the BLR velocity which enters the virial equation, , must be measured. This is done (relatively) easily from the FWHM of the emission lines. To avoid contamination from the non-varying components of the AGN, the line width is measured from the “rms” spectrum, where the rms is calculated relative to the mean of all spectra obtained during the monitoring experiment. By definition, non-variable components (for instance narrow absorption lines, and the underlying galaxy’s spectrum) cancel out in the rms spectrum, leaving only the clean contribution from the BLR. Krolik (2001) points out that the line flux and velocity might have different responsivity functions, i.e. produce the strongest response at different locations within the BLR. If the velocity measured from the rms spectrum is not representative of the velocity at the radius derived from the lag measurements, systematic errors in the derived masses can easily ensue.

| Object | z | (5100Å)b | vFWHM(rms) | (rms) | |
|---|---|---|---|---|---|
| (lt-days) | ergs s-1 | km s-1 | M⊙ | ||
| 3C 120 | 0.033 | ||||
| 3C 390.3 | 0.056 | ||||
| Akn 120 | 0.032 | ||||
| F 9 | 0.047 | ||||
| IC 4329A | 0.016 | ||||
| Mrk 79 | 0.022 | ||||
| Mrk 110 | 0.035 | ||||
| Mrk 335 | 0.026 | ||||
| Mrk 509 | 0.034 | ||||
| Mrk 590 | 0.026 | ||||
| Mrk 817 | 0.031 | ||||
| NGC 3227 | 0.0038 | ||||
| NGC 3516 | 0.0088 | ||||
| NGC 3783 | 0.0097 | ||||
| NGC 4051 | 0.0023 | ||||
| NGC 4151 | 0.0033 | ||||
| NGC 4593 | 0.0090 | ||||
| NGC 5548 | 0.017 | ||||
| NGC 7469 | 0.016 | ||||
| PG 0026 | 0.142 | ||||
| PG 0052 | 0.155 | ||||
| PG 0804 | 0.100 | ||||
| PG 0844 | 0.064 | ||||
| PG 0953 | 0.239 | ||||
| PG 1211 | 0.085 | ||||
| PG 1226 | 0.158 | ||||
| PG 1229 | 0.064 | ||||
| PG 1307 | 0.155 | ||||
| PG 1351 | 0.087 | ||||
| PG 1411 | 0.089 | ||||
| PG 1426 | 0.086 | ||||
| PG 1613 | 0.129 | ||||
| PG 1617 | 0.114 | ||||
| PG 1700 | 0.292 | ||||
| PG 1704 | 0.371 | ||||
| PG 2130 | 0.061 | ||||
| a Data for the PG quasars are from Kaspi et al. (2000), while data for all other objects (with the exceptions noted below) are originally from Wandel, Peterson & Malkan (1999), as listed in Kaspi et al. (2000). Data for NGC 3783 are from Onken & Peterson (2002). Data for NGC 3227, NGC 3516, & NGC 4593 are from Onken et al. 2003. Data for NGC 4051 are from Peterson et al. (2000). | |||||
| bAssuming km s-1 Mpc-1. | |||||
| cH was not observed, therefore the rms velocity refers to H. | |||||
8.3.2 Observational Support for the Reliability of Reverberation Mapping Masses
Reverberation mapping has always enjoyed high esteem within the AGN community; however, it has been viewed with considerable skepticism within the circles of stellar dynamicists, at least as a way to estimate SBH masses. Although there is no galaxy for which a SBH mass estimate exists based on both reverberation mapping and resolved stellar or gas kinematics, early studies indicated that for galaxies of comparable magnitude, masses derived from reverberation mapping, and those obtained using traditional resolved stellar dynamics, differed by as much as a factor 50 (e.g. Wandel 1999; McLure & Dunlop 2000; Ho 1999; Richstone et al. 1998). The blame for the discrepancy fell, only too easily, on the reverberation mapping results, which were vindicated only when it was realized that the stellar dynamical masses used in the comparison (from Magorrian et al. 1998) were seriously flawed. A discussion of this issue and its resolution can be found in Merritt & Ferrarese (2001c, see also Wandel 2002).
There still are, however, serious theoretical considerations which could potentially affect mass estimates from reverberation mapping (Krolik 2001). Of these, perhaps the most important are the assumptions made on the velocity and geometric structure of the BLR.
The virial hypothesis is of course at the heart of reverberation mapping as a mass estimator. If the hypothesis is invalidated, for instance if the BLR is in a radial flow, the whole method is undermined, at least as far as mass estimates are concerned. Reassuringly, the virial hypothesis has recently received strong observational support from the work of Peterson & Wandel (2000) and Onken & Peterson (2002). If the motion of the gas is gravitational, using the lags derived from different emission lines in the same AGN must lead to the same mass measurement. NGC 5548 was the first galaxy for which this was indeed verified. The highest ionization lines are observed to have the shortest time lag, so that the virial product remains constant (Figure 28). The implied central mass is M⊙. The same has now been observed in three additional galaxies, NGC 7469, NGC 3783, and 3C390.3; in all cases, the time lag (i.e. the BLR radius) and measured line width obey a virial relationship. Although there exist non-equilibrium kinematical configurations which can mimic a virial relationship (e.g. cloud outflows or disk winds could also explain the observations, Blumenthal & Mathews 1975; Murray et al. 1995; Emmering, Blandford & Shlosman 1992; Chiang & Murray 1996; Bottorff et al. 1997), these alternative explanations need to be very finely tuned to account for the mounting quantity of observational evidence, and are therefore becoming more and more untenable. The H line in NGC 5548 also maintains a virial relationship as a function of time: as the continuum brightens and the lags become larger, the line width is observed to become narrower, in the exact fashion necessary to maintain a virial relation (Peterson et al. 2002).
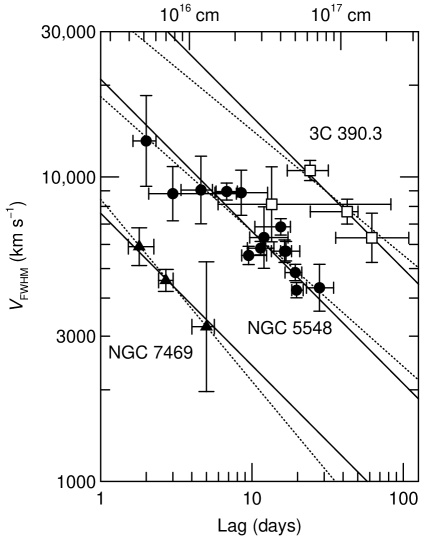
The geometry of the BLR is less securely constrained. For lack of evidence which favors one model over another, most studies (Wandel, Peterson & Malkan 1999; Kaspi et al. 2000; Onken et al. 2003; Sergeev et al. 2002; Vestergaard et al. 2000) assume that the BLR is spherical and characterized by an isotropic velocity distribution, although different assumptions are also made. For instance, McLure & Dunlop (2000) assume a thin disk geometry, leading to velocities times and black holes masses three times greater than in the spherical, isotropic case.
Perhaps the strongest support for reverberation mapping masses comes by comparing them with those measured, using traditional methods (§ 5, 6, 7), for the SBH hosted in “similar” (kinematically or morphologically) but quiescent galaxies. SBH masses measured through resolved stellar or gas dynamics are tightly connected to the velocity dispersion of the host bulge (Ferrarese & Merritt 2000; Gebhardt et al. 2000b, see § 9.2), so tightly that the relation can be used to estimate SBH masses with 30% accuracy from a single measurement of . Gebhardt et al. (2000c) presented tantalizing evidence that AGNs might follow the same relation as quiescent galaxies. Ferrarese et al. (2001) started a systematic program to map all reverberation mapped AGNs onto the plane. The results are encouraging (Figure 29); the remarkable agreement between SBH masses measured in AGNs and quiescent galaxies with similar velocity dispersion is strong observational support for the reliability of the AGN masses. By the time this review appears in press, bulge velocity dispersion measurements will have been obtained for all of the reverberation mapped galaxies (Onken et al. 2004). These studies promise to shed light on the value of the geometric factor , at least in a statistical sense.
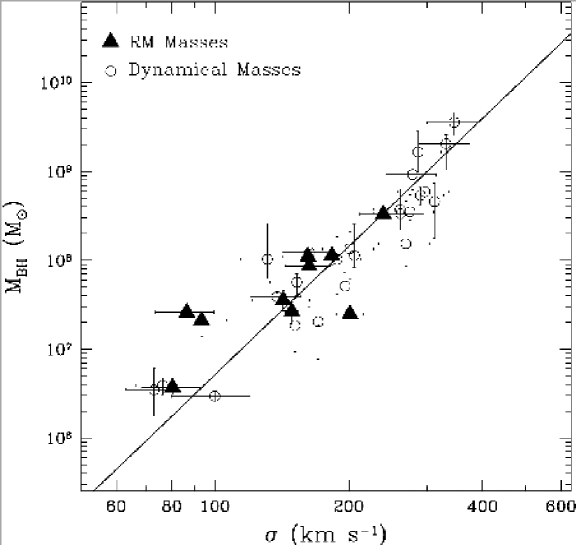
8.3.3 The Future of Reverberation Mapping
Observationally, the main limitation of current reverberation mapping studies lies in the less than optimal temporal sampling and duration of the experiments (Krolik 2001; Peterson 2002). This is the main obstacle which has so far prevented a direct determination of the geometry and kinematics of the BLR – the original aim of the method. Information about both is contained in the “transfer function”, i.e. the time-smeared emission line response to a -function outburst in the continuum:
| (13) |
Here, is the emission line flux observed at line of sight velocity , is the transfer function, and is the continuum light curve. The integral of the transfer function over time gives the line profile (flux as a function of line of sight velocity), while the integral of the transfer function over velocity gives the delay map (normalized flux as a function of time delay). Solving for the transfer function is a classical inversion problem; in practice, it requires extremely high S/N data. In the best cases so far, it has been possible to solve only for the 1D, or velocity independent transfer function, where both and represent integrals over the emission line width.
| (14) |
Examples of transfer functions are given in Peterson (2002). They can be calculated for different geometries (e.g. planar or spherical, as well as more complicated cases), anisotropy in the line emission (which could arise, for instance, if the BLR is optically thick to both continuum and emission line radiation, so that most of the emission would emerge from the side of the the BLR facing the continuum source), anisotropy in the continuum emission (originating, for instance, if the continuum is emitted in a biconical beam with given opening angle), distance-dependent responsivity functions (due, for instance, to geometrical dilution or a varying covering factor for the BLR). While very different scenarios can correspond to very similar 1D transfer functions, they are easily distinguishable using the 2D transfer function, i.e. when both time delay maps and line profiles are available (Figure 30).
Attempts at recovering transfer functions have been made in the case of the CIV and HeII lines in NGC 4151 (Ulrich & Horne 1996), the CIV and H lines in NGC 5548 (S. Collier, as cited by Peterson 2002), and the H, H, H, HeI5876 and HeII4686 lines in Mrk 110 (Kollatschny 2003). In the latter case, the transfer function seems to resemble the one expected for a disk in Keplerian rotation, inclined approximatively 30∘ relative to the line of sight (although, as mentioned earlier, the red wing of the lines seems to respond slightly faster than the blue wing, suggesting the presence of gas infall). Generally, however, the data are not of high enough quality for a satisfactory analysis. For instance, in the case of NGC 5548, the same transfer function has been argued to be evidence of no outflows (Wanders et al. 1995), radial outflows (Chiang & Murray 1996; Buttorff et al. 1997), and radial inflows (Done & Krolik 1996).
An unambiguous understanding of the morphology and kinematics of the BLR is not just a must for quantifying the uncertainties and systematics affecting reverberation masses, it also addresses one of the long standing problems in extragalactic astrophysics – the nature of the innermost structure of AGNs. Achieving such understanding requires long term, well sampled, high time resolution observations over a broad energy range, from the X-rays to the optical. Kronos, a concept for an optical/UV/X-ray space telescope, is designed to meet this goal in a selected sample of nearby AGNs (Peterson & Horne 2003).

8.4 Secondary Mass Estimators Based on Reverberation Mapping
Since the early days of reverberation mapping, observers noted a correlation of both the BLR radius and the central mass with continuum luminosity (Figure 31; Koratkar & Gaskell 1991; Wandel et al. 1999; Kaspi et al. 2000; Peterson et al. 2000). In the most recent characterization of the relation, given by Vestergaard (2002), the BLR size (measured from the H broad lines) correlates with the monochromatic continuum luminosity, measured at 5100 Å, as:
| (15) |
albeit with large scatter (Peterson et al. calculated a reduced for the fit of 15.7). A smaller scatter has been claimed if the AGN luminosity is measured at 3000 Å instead (McLure & Jarvis 2002), although it should be noted that the analysis is complicated by the fact that at 3000 Å the AGN continuum is severely contaminated by emission lines.
The slope of the relation holds interesting information about the physical nature of the ionization process. As pointed out by Koratkar & Gaskell (1991) one would expect the BLR size to correlate with the 0.5 power of the continuum luminosity if the shape of the ionizing continuum in AGNs is independent of luminosity, and all AGNs are characterized by the same ionization parameter and BLR density. In this case, a stronger optical continuum corresponds to a higher ionizing flux, which will be able to ionize the BLR to a larger depth. The fact that the slope of equation 15 seems marginally inconsistent with this simple expectation, suggests that the physical parameters within the central region (e.g. continuum shape, BLR density, column density, and ionization parameter) are likely not universal.
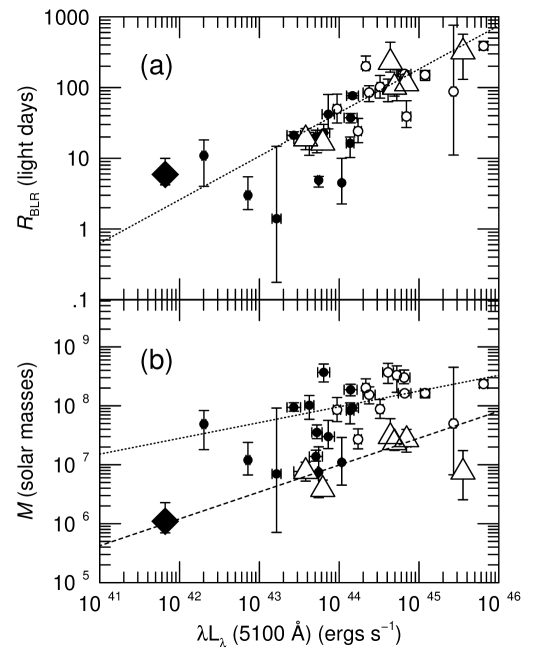
The relation has tremendous appeal because it allows us to estimate the BLR size from a quick, simple measure of the continuum luminosity, bypassing the need for long monitoring programs. Once the BLR size is known, the SBH mass is easily derived from the virial relation
| (16) |
(under the assumption of isotropy for the BLR).
The and virial relation, both of which are based on optical measurements, prompted a recent study by Vestergaard (2002) which investigates the viability of SBH mass estimators based on UV data, in particular the CIV 1549 emission (to replace H) and continuum luminosity at 1350 Å (rather than 5100 Å). This is an extremely important step, since the spectral region chosen by Vestergaard is redshifted into the optical (and therefore accessible from the ground) for AGNs with redshifts . Vestergaard’s calibration gives:
| (17) |
Vestergaard estimates 1 uncertainties of a factor 2.5 and 3 respectively in the mass determined for any single object from optical data (equations 15 and 16) and UV data (eq. 17, the larger scatter is a direct consequence of the fact that the UV relation is calibrated using the optical data). In spite of the large scatter, the undeniable value of these relations stems from the fact that they are easily applicable to large samples of objects, for which direct reverberation mapping measurements would be unrealistic. While the UV relations have not yet received direct applications (although many must be in the works!), several studies have employed the optical relations (e.g. Bian & Zhao 2003; Shields et al. 2003; Netzer 2003; Woo & Urry 2002a&b; Oshlack et al. 2002; Wandel 2002; Boroson 2002; McLure & Dunlop 2001).
Figure 31 shows the relation between reverberation-based masses and continuum luminosity (measured at 5100 Å). The relation follows from, but has larger scatter than, the correlations between BLR size and broad line widths with luminosity. A similar relation exists between SBH masses and the 10m and keV nuclear luminosities (the latter for Compton-thin sources only, Alonso-Herrero et al. 2002). The larger scatter in these relations, relative to the relation, indicates that luminosity, rather than mass, is the main factor determining BLR sizes. Nevertheless, these relations provide important clues as to the nature of the nuclear activity and accretion processes in different classes of AGNs. For instance, Peterson et al. (2000) note that narrow line Seyfert 1 galaxies (NLS1s) seem to have smaller SBH masses (by a factor 10) than regular Seyfert 1 galaxies with comparable continuum luminosity, indicating that they are accreting at higher rates and/or efficiencies. Based on these findings, Mathur (2000) further speculate that NLS1s might represent an early evolutionary stage of Seyfert 1 galaxies.
8.5 The Photoionization Method
In the assumption that the BLR emission line gas is photoionized and not stratified, line ratios can be used to determine the average physical properties of the gas, in particular the density and the ionization parameter , i.e. ratio of the ionizing photon flux to the electron density (this ratio is normally divided by the speed of light, , in order to make dimensionless):
| (18) |
Here, is the monochromatic luminosity of the central source. In practice, these measurements suffer large uncertainties, and an average value of ends up being assumed for all objects. Once a value of is agreed upon, the radius of the BLR is simply inversely proportional (via the ionizing flux, knowing which requires UV spectra) to the square root of , and the central mass can then be derived under the virial assumption, just as in the case of reverberation mapping. BLR sizes derived using the photoionization method are in good agreement with reverberation mapping estimates (Wandel, Peterson & Malkan 1999). Indeed, using this method, Padovani, Burg & Edelson (1990) conducted the first study of SBH demographics in Seyfert 1 galaxies, and concluded that local AGNs cannot be the only repository of the SBHs residing in high redshift quasars, further justifying the search for SBHs in quiescent galaxies.
In contrast to reverberation mapping techniques, the photoionization method is completely independent of the assumed geometry of the BLR (for example it is insensitive to whether the gas is confined in many separate clouds or has a continuous distribution). The downside is, of course, that is not accurately known, although reasonable estimates can be obtained given high quality data. More importantly, the photoionization method relies on a single-zone approximation for the gas, which is certainly an oversimplification. Nevertheless, the method has appeal since it can have statistical validity when applied to large samples of objects.
Section 9 SCALING RELATIONS FOR SUPERMASSIVE BLACK HOLES.
If man were restricted to collecting facts, the sciences would only be a sterile nomenclature and he would never have known the great laws of nature. It is in comparing the phenomena with each other, in seeking to grasp their relationships, that he is led to discover these laws.
Pierre-Simon Laplace, in “Exposition du systeme du monde”
9.1 The Relation
Using the eight SBH detections available at the time, Kormendy & Richstone (1995) noticed that supermassive black hole masses correlate with the blue luminosity of the surrounding hot stellar component, this being the bulge of spiral galaxies, or the entire galaxy in the case of ellipticals. Whether the observed correlation was simply the upper envelope of a distribution which extends to smaller masses was unclear: while there should be no observational bias against detecting large SBHs in small bulges, a failed detection of a small SBH in a large system could have gone unreported at the time (but none has been reported since). Kormendy & Richstone point out that the existence of the correlation indicates that SBH and bulge formation are tightly connected or even, based on the claimed absence of a SBH in the bulge-less spiral M33, that the presence of a bulge might be essential for SBH formation.
Further SBH detections have confirmed the existence of a correlation. The most up-to-date relation, using all SBH detections for which the sphere of influence is resolved by the observations, is shown in Figure 32. A best fit, accounting for errors in both coordinates as well as intrinsic scatter gives:
| (19) |

The scatter in the relation is the subject of some debate. Using the 12 reliable SBH masses known at the time, Ferrarese & Merritt (2000) reported a reduced when the magnitudes are measured in the band, and a scatter of 0.6 dex in at any given luminosity. This result has not changed significantly in the past three years. The expanded sample shown in Figure 32 has a scatter around the best fit line of 0.79 dex in . McLure & Dunlop (2001) were the first to point out that if the sample is restricted to elliptical galaxies, the scatter is reduced significantly, down to 0.33 dex. This is comparable to the scatter in the relation to be discussed in the next section. Elliptical galaxies are distinguished from lenticulars and spirals in Figure 32, they indeed define a relation with significantly reduced scatter, 0.40 dex in in the updated sample presented in this review. This is only slightly larger than calculated by McLure & Dunlop, due to the addition of Cyg A (Tadhunter et al. 2003) and NGC 5845 (Gebhardt et al. 2003), both of which deviate (significantly in the case of Cyg A) from the best fit relation.
A natural question is whether the Hubble dependence of the scatter (and possibly characterization) of the relation is indicative of a SBH formation and/or evolution history which differs in elliptical and spiral galaxies. This seems unlikely for several reasons. First and foremost is the fact that the characterization of the relation, to be discussed in the next section, does not seem to depend on Hubble type. McLure & Dunlop note that disentangling the bulge from the disk light, especially in late type spirals, and especially in the band, is a difficult and uncertain process. For instance, Ferrarese & Merritt (2000) used the Simien & De Vaucouleurs relation (that is know to have large scatter) to estimate the fraction of total light contained in the bulge as a function of Hubble type. It is quite possible, therefore, that the overall larger scatter exhibited by spiral galaxies is simply due to an inaccurate determination of for the bulge component.
This conclusion is supported by the recent study of Marconi & Hunt (2003). The authors used band images from the recently released 2MASS database, and performed an accurate bulge/disk decomposition for the nearby quiescent spiral galaxies with dynamically measured masses. When only SBH masses based on data which resolved the sphere of influence are used, Marconi & Hunt find that the scatter in the band relation is very small (0.31 dex), comparable to the scatter in the relation, no matter whether spiral galaxies are included or not. This is not altogether surprising. Both the and relations betray the existence of a correlation between the mass of supermassive black holes, and the mass of the host bulge. Near IR magnitudes are a better tracer of mass than band magnitudes (and are also less sensitive to the disk component in spiral galaxies). If mass is the underlying fundamental parameter as Marconi & Hunt suggest, the scatter in the relation should depend on the photometric band in which the magnitudes are measured888It must however be pointed out that Marconi & Hunt measure a smaller scatter for the band relation than previously reported.. Marconi & Hunt reach a second noteable conclusion, namely that the scatter in the relation depends on the sample of galaxies used, increasing significantly (from 0.31 dex to 0.51 dex) when including galaxies for which the data do not resolve the SBH sphere of influence. This is a strong endorsement of the argument, first proposed by Ferrarese & Merritt (2000), that resolving the sphere of influence is a necessary condition for a reliable mass determination to be made.
9.2 The Relation
Bulge magnitudes and velocity dispersions are correlated through the Faber-Jackson relation. The relation, therefore, immediately entails a correlation between and . In spite of the ample attention devoted to the relation since 1995, five years went by before the first relation was published (Ferrarese & Merritt 2000; Gebhardt et al. 2000b). The reason for the long delay is easily understood. Figure 33 (bottom panels) shows the and correlations using all SBH masses, regardless of their accuracy, available in 2000. Both relations have large intrinsic scatter, and there doesn’t appear to be any obvious advantage in preferring one to the other. The breakthrough came with the realization that the scatter in the relation is significantly dependent on sample selection. The upper panels of Figure 33 only show SBH masses (as were available in 2000) derived from data which resolved the sphere of influence. While no significant changes (besides the obvious decrease in sample size) are noticeable in the relation, the scatter in the relation decreases significantly when the restricted sample is used. Based on these findings, Ferrarese & Merritt (2000) concluded that the reliability of the SBH mass depends critically on the spatial resolution of the data, and that the relation is tighter, and therefore more fundamental, than either the Faber-Jackson or the relation.
The latter conclusion was also reached by Gebhardt et al. (2000b), who more than doubled the sample used by Ferrarese & Merritt (2000) by including SBH masses for 13 additional galaxies (subsequently published in Gebhardt et al. 2003). There are some noticeable differences between the Ferrarese & Merritt and Gebhardt et al. study, besides the size of the sample. Gebhardt et al. use “luminosity-weighted line-of-sight [velocity] dispersions inside a radius R”, while Ferrarese & Merritt used central velocity dispersions normalized to an aperture of radius equal to 1/8 of the galaxy effective radius (Jorgensen et al. 1995, the same definition is used in studies of the fundamental plane of elliptical galaxies). Based on the fact that the measured by Gebhardt et al. (2000b) and those used by Ferrarese & Merritt (2000) differ slightly but systematically from each other, Tremaine et al. (2002) argue that the latter are flawed.
The original slope measured by Gebhardt et al. for the relation () was considerably flatter than the one measured by Ferrarese & Merritt (). The reasons were identified by Merritt & Ferrarese (2001b) in the different algorithm used to fit the data, the value adopted for the Milky Way, and the inclusion in the Gebhardt et al. sample of SBH masses for which the data did not resolve the sphere of influence. The first two issues were recognized and corrected in Tremaine et al. (2002), who unfortunately never addressed the third issue. Tremaine et al. (2002) propose a slope for the relation of , and trace the reason for the difference between their value and that of Ferrarese & Merritt to the aforementioned discrepancies in the adopted definition of the velocity dispersion. To date, there has been no reconciliation of the issue. Independent investigation of the (§ 9.1, Marconi & Hunt 2003) and relations (S 9.4, Graham et al. 2001) have led to the conclusion that resolving the SBH sphere of influence significantly affects the characterization and scatter of those relations, arguing that masses based on data with poor spatial sampling (several of which are included in the Tremaine et al. study) should not be used. On the other hand, Tremaine et al.’s claim needs to be pursued, if nothing else because central velocity dispersions are commonly used in studies of the fundamental plane of elliptical galaxies. Unfortunately, the data and procedure used by Gebhardt et al. (2000b) to measure what Tremaine et al. claim to be more reliable values of are to this date unpublished, and therefore not reproducible. It is unclear, for instance, if and how inclination and aperture corrections were accounted for.

Figure 32 shows the most current version of the relation, including only SBH for which the data resolved the sphere of influence (from Table LABEL:tab:allmasses, which now includes more galaxies than used in any previously published study of the relation), using published central values of the velocity dispersions, and the fitting routine from Akritas & Bershady (1996):
| (20) |
(using the fitting algorithm used in Tremaine et al. (2002) actually produces a slightly steeper slope, ). The reduced is 0.880, indicating that the intrinsic scatter of the relation is negligible. The scatter around the mean is only 0.34 dex in . Neither the scatter, slope or zero point of the relation depend on the Hubble type of the galaxies considered, as can be judged qualitatively from Figure 32.
It is, of course, a trivial exercise for anyone to produce their own fit to their preferred sample. Whatever the slope of the relation might turn out to be, there is one point on which there seems to be universal agreement: because of its negligible scatter, the relation is of fundamental relevance for many issues related to the studies of SBHs. In particular:
-
The relation allows one to infer SBH masses with 30% accuracy from a single measurement of the large scale bulge velocity dispersion. Through , it has therefore become possible to explore the role played by the SBH mass in driving the character of the nuclear activity, not only in individual galaxies (Barth et al. 2002), but also in different classes of AGNs (Marchesini, Ferrarese & Celotti 2004; Barth et al. 2003; Falomo et al. 2003).
-
Studies of SBH demographics (§ 10), both in quiescent (Merritt & Ferrarese 2001a; Ferrarese 2002a; Yu & Tremaine 2003; Aller & Richstone 2003; Whythe & Loeb 2002, 2003) and active galaxies (Ferrarese et al. 2001) have relied heavily on the relation.
-
The relation has become the litmus test of models of SBH formation and evolution. Reproducing its slope, normalization and, above all, scatter, and maintaining it in spite of the merger events which inevitably take place during galaxy evolution, is currently the biggest challenge faced by the models (Adams, Graff, & Richstone 2000; Monaco, Salucci & Danese 2000; Haehnelt, Natarajan, & Rees 1998; Silk & Rees 1998; Haehnelt & Kauffmann 2000; Cattaneo, Haehnelt & Rees 1999; Loeb & Rasio 1994).
Figure 34 shows the relation between black hole and bulge mass, where the latter has been derived , following Marconi & Hunt (2003), from which we also adopted the values of the effective radii, .
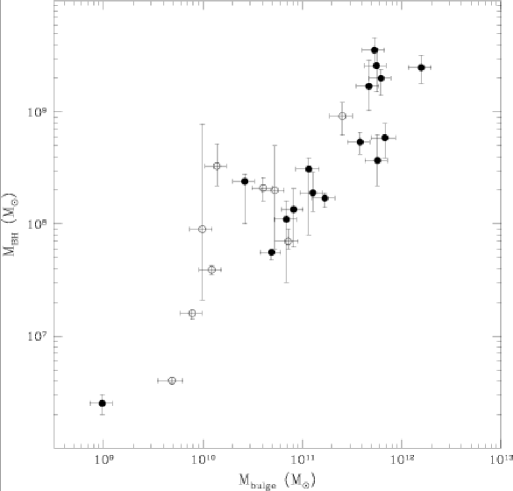
9.3 A Visual Comparison of the and Relation
Figures 35 and 36 are included as a way to assess, qualitatively, the scatter and character of the and relations as a function of Hubble Type and the ability of the data to spatially resolve the sphere of influence. The figures support the following conclusions, which can be rigorously proven by fitting the data given in Table LABEL:tab:allmasses: 1) the scatter in the band relation decreases when bulge, instead of total, magnitudes are used, as pointed out by Kormendy & Gebhardt (2001). 2) The scatter in the relation decreases when the sample is restricted to elliptical galaxies only, as first pointed out by McLure & Dunlop (2000). 3) The scatter further decreases if the sample is restricted to galaxies for which the sphere of influence is well resolved, independently on the Hubble Type of the galaxy considered. 4) For all samples, the scatter in the band relation is larger than in the relation (c.f. Marconi & Hunt 2003).
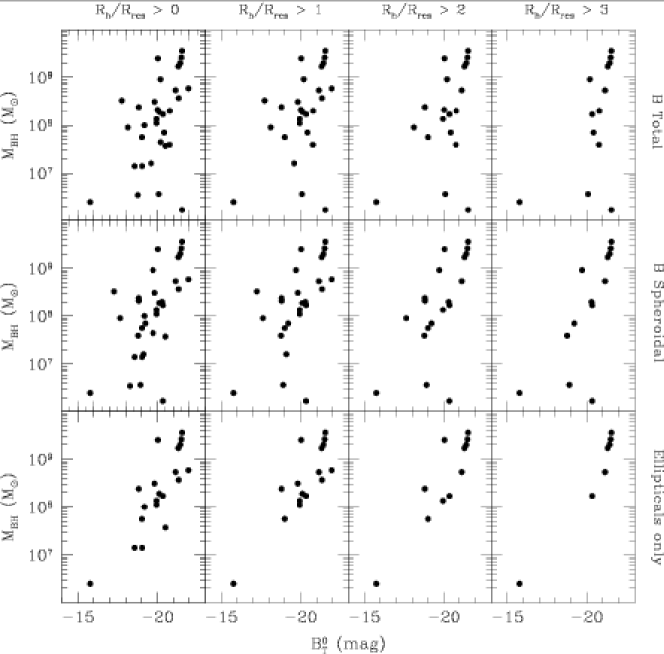
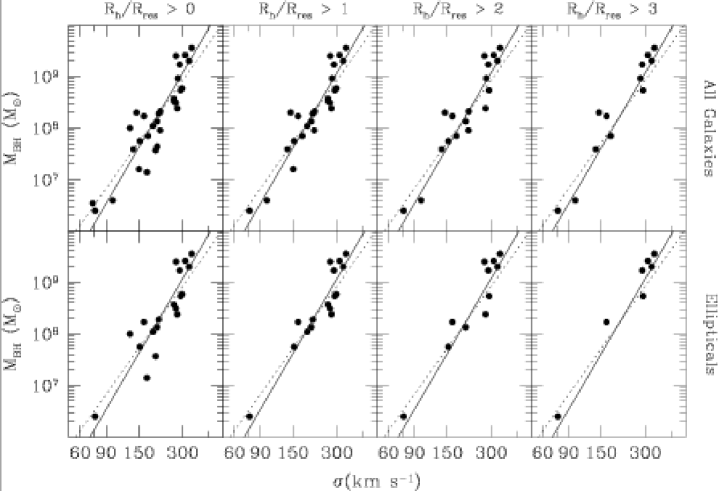
9.4 Black Hole Masses and Light Concentration
Graham et al. (2001) found a remarkably tight correlation between SBH masses and the concentration of bulge light, defined as the ratio of flux inside one-third of the half-light radius to the one within the entire half-light radius (Figure 37). The existence of the correlation is not entirely surprising. At least in ellipticals (which comprise most of the sample) the shape of the brightness profile correlates with galaxy luminosity (Ferrarese et al. 1994; Lauer et al. 1995; Rest et al. 2001). Larger and more luminous galaxies have shallower brightness profiles (larger radii enclosing of the light and thus less light concentration) and host more massive black holes. As is the case for the relation, however, what is surprising is the scatter, which appears to be negligible. As noticed by Ferrarese & Merritt (2000) for the relation and, later, by Marconi & Hunt for the relation, Graham et al. find that the scatter in the relation decreases significantly when only SBH masses derived from data which resolves the sphere of influence are used.
The and relations have the practical advantage of needing only imaging data, generally more readily available than the spectroscopic data necessary to measure . The relation is, however, dependent on a parametric characterization of the light profile (Graham et al. use a modified Sersic law) which might not prove to be a good fit for some galaxies. Graham et al. point out that cD and merging/interacting galaxies might be particularly problematic, and exclude NGC 6251 and (judging from their Figure 2) M87 and NGC 4374 from their analysis. It is interesting to notice that while outliers in the relation, these galaxies fit the relation.

Regrettably, there have not yet been theoretical studies targeting the relation specifically, although a number of authors have studied the effect of a SBH (or a SBH binary) on the density profile of the surrounding stellar population (Young 1980; Quinlan, Hernquist & Sigurdsson 1995; Lee & Goodman 1989; Cipollina & Bertin 1994; Sigurdsson, Hernquist & Quinlan 1995; Quinlan & Hernquist 1997; Nakano & Makino 1999, van der Marel 1999; Milosavljevic & Merritt 2001).
9.5 Black Hole Masses and Dark Matter Haloes
Kormendy & Richstone (1995) first pointed out that the existence of the relation indicates that SBH and bulge formation are tightly connected or even that the presence of a bulge might be a necessary condition for SBH formation. Six years later, based on the observation that the scatter in the relation increases mildly when total magnitude is substituted for bulge magnitude, Kormendy & Gebhardt (2001) argued that SBH masses do not correlate with total mass. These conclusions, however, can be questioned on several grounds. band observations are a poor tracer of mass, AGNs in bulge-less galaxies do exist (e.g. Filippenko & Ho 2003), and most self regulating theoretical models of SBH formation predict the fundamental connection to be between and the total gravitational mass of the host galaxy, rather than the bulge mass (Adams, Graff, & Richstone 2000; Monaco, Salucci, & Danese 2000; Haehnelt, Natarajan & Rees 1998; Silk & Rees 1998; Haehnelt & Kauffmann 2000; Cattaneo, Haehnelt & Rees 1999; Loeb & Rasio 1994). Unfortunately, finding observational support for the existence of a relation between SBHs and the total gravitational mass of the host galaxy is very difficult: measuring dark matter halo masses makes the measurement of look almost trivial!
Ferrarese (2002b) provided the first – albeit indirect – observational evidence that SBH and dark matter halos might be tightly connected. Figure 38 shows that in spiral galaxies as well as in ellipticals, the bulge velocity dispersion, which is typically measured within a radius of 0.5 kpc, and the large scale circular velocity, measured at radii which range from 10 to 50 kpc, are tightly connected. For the spirals, the disk circular velocity is measured directly from HI observations which extend beyond the optical radius of the galaxy, well within the region where the rotation velocity stabilizes into a flat rotation curve. For the elliptical galaxies, the circular velocity is derived from dynamical models applied to the stellar kinematics (Gerhard et al. 2001; Kronawitter et al. 2000). The best fit relation gives:
| (21) |
The existence of the relation, with virtually unchanged characterization, has since been confirmed using a larger sample of galaxies by Baes et al. (2003).
The interest of the relation reaches beyond the realm of SBHs. For instance, characterizing the slope and normalization of the relation might help in constraining theoretical models and numerical simulations following the formation and evolution of galaxies (e.g. Steinmetz & Muller 1995). For the purpose of this review, however, the relation clearly betrays a correlation between the masses of SBHs and those of the surrounding dark matter halos (Figure 38), although the exact characterization of such a relation remains to be explored. The velocity dispersion is easily transformed to using the relation but, unfortunately, the relation between circular velocity and dark matter halo mass is more uncertain. In a CDM-dominated universe, the dark matter halo mass is uniquely determined by the halo velocity measured at the virial radius. The latter is defined as the radius at which the mean density exceeds the mean universal density by a constant factor, generally referred to as the “virial overdensity”. Based on this definition, and by virtue of the virial theorem, it immediately follows that the halo mass must be proportional to the third power of the virial velocity, but unfortunately the constant of proportionality depends on the adopted cosmology and may vary with time (e.g., Bryan & Norman 1998; Navarro & Steinmetz 2000). To convert the relation to a relation, the virial velocity must also be related to the measured circular velocity, a step which entails further assumptions on the value and mass dependence of the halo concentration parameter. Using the relation, and the CDM cosmological simulations of Bullock et al. (2002), Ferrarese (2002b) derives
| (22) |
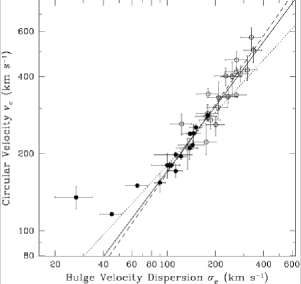
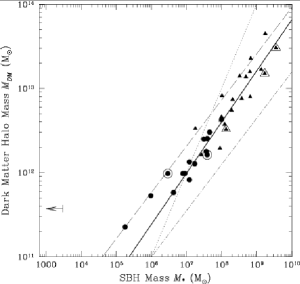
The dependence of on is not linear, a result that seems quite robust no matter what the details of the adopted cosmological model are. The ratio between SBH and halo mass decreases from at M⊙ to at M⊙, meaning that less massive halos seem less efficient in forming SBHs. Ferrarese (2002b) notes that this tendency becomes more pronounced for halos with M⊙, and further note that, since there is no direct evidence that SBH of masses smaller than M⊙ exist, SBH formation might only proceed in halos with a virial velocity larger than km s-1, in qualitative agreement with the formation scenario envisioned by Haehnelt et al. (1998) and Silk & Rees (1998).
Although there is no doubt that the relation implies that the formation of SBHs is controlled, perhaps indirectly, by the properties of the dark matter halos in which they reside, it is unclear at this time whether the connection between SBHs and dark matter halos is of a more fundamental nature than the one between SBHs and bulges, reflected in the relation. Ferrarese (2002b) notes that the scatter in the relation could be as small or perhaps even smaller than the one in the relation for a given choice of the dark matter density profile and cosmological parameters, although “secure conclusions will have to await an empirical characterization of the relation, with both and determined directly from observations”.
9.6 Black Hole Masses and Core Radio Power

One final correlation is worth mentioning. An early study by Franceschini, Vercellone & Fabian (1998) found a correlation between and both the core and total radio power (measured at 6cm) for the dozen nearby weakly active galaxies with measured available at the time. Subsequent studies have extended the correlation to high luminosity radio quasars, for which SBH masses are estimated from the H line width and the correlation discussed in § 8.4. These studies find either a looser correlation (Laor 2000; Lacy et al. 2001; Wu & Han 2001) or no correlation at all (Ho 2002; Oshlack et al. 2002; Woo & Urry 2002). This possibly indicates that other parameters (for instance the accretion rate) play a more fundamental role than in determining the radio properties. The most recent (and perhaps cleanest) investigation is that of Snellen et al. (2003), who estimated for a sample of powerful radio galaxies using the relation. Because the relation is tighter than the relation used in all other studies, the results are more easily interpretable. Snellen et al. find that a correlation between and core radio power exists for optically selected inactive galaxies only, but breaks down in powerful AGNs (Figure 39). The correlation between and radio power is clearly worth investigating further, not only because of its predictive power, at least in radio quiet galaxies, but also because it holds important clues as to the role played by the SBH mass and accretion rate in shaping the character of the nuclear activity.
Section 10 BLACK HOLE DEMOGRAPHICS
Tracing the mass function of SBHs from the quasar era to the present day can yield important clues about the formation and growth of SBHs. It is, however, a road that can prove treacherous, unless we are fully aware of the uncertainties associated with this process. For instance, in 1998, a widely cited study by Magorrian et al. led to a cumulative mass density recovered in local SBHs in excess, by a factor five, relative to the one required to power quasars during the optically bright phase (). Based on these findings, Richstone et al. (1998) suggested that “a large fraction of black hole growth may occur at radiative efficiencies significantly less than 0.1”. This possibility was also put forth by Haehnelt, Natarayan & Rees (1998), although the authors do mention alternative explanations, including the possibility that the Magorrian et al. (1998) local SBH mass density could have been “strongly overestimated”. The latter was shown to be the case by Ferrarese & Merritt (2000). Merritt & Ferrarese’s (2001a) reassesment of the local SBH mass density gave values in acceptable agreement with the SBH mass density at high redshifts. Today, the emerging picture is one in which the total cumulative SBH mass density does not seem to depend on look-back time, although the SBH mass function (the mass density per unit SBH mass interval) might. Again, much has been read into this (e.g. Yu & Tremaine 2002) although, as we will see, firm conclusions are still premature. In the following we will briefly discuss how SBH mass functions are derived, paying particular attention to potential systematic errors which might affect the results.
Lacking a dynamical way of measuring SBH masses in high redshift quasars, these have been inferred directly from quasar counts in the optical (Soltan 1982; Small & Blandford 1992; Chokshi & Turner 1992) and, most recently, X-rays. Andrzej Soltan (1982) first pointed out that under the assumption that the QSO luminosity is produced by gas accretion onto the central SBH, i.e. , the total cumulative SBH mass density can be derived directly from the mean comoving energy density in QSO light. Once a bolometric correction and a conversion efficiency of mass into energy are assumed, the latter is simply the integral, over luminosity, of the optical quasar luminosity function multiplied by luminosity. Based on these arguments, Soltan concluded that the SBHs powering high redshift () quasars comprise a total mass density of M⊙ Mpc-3, each SBH having a mass in the M⊙ range. It was Soltan’s argument which first lead to the inescapable conclusion that most, if not all, nearby galaxies must host dormant black holes in their nuclei. This realization has been the main driver for SBH searches in nearby quiescent galaxies and has kindled interest in the accretion crisis in nearby galactic nuclei (Fabian & Canizares 1988), ultimately leading to the revival of accretion mechanisms with low radiative efficiencies (Rees et al. 1982; Narayan & Yi 1995).
Small & Blandford (1992) proposed a different formalism to describe the time evolution of the SBH mass function, based on a continuity equation of the type:
| (23) |
where is the number density of SBHs per unit comoving volume and unit mass, is the mean growth rate of a SBH of mass , and is a source function. Under the assumption that during the optically bright phase quasars and bright AGNs accrete at an essentially constant , the mass accretion rate is related to the luminosity as , where is the fraction of the Eddington rate at which the SBH is accreting, and is the Salpeter time (equation 2). is related to the optical luminosity function as . is the QSO “duty cycle”, i.e. the fraction of the time which the QSO spends accreting from the surrounding medium, so that . Under the assumption that SBHs are originally in place with a minimum mass, and that subsequently no SBHs are formed or destroyed (for instance through merging processes), equation (23) can then be written as
| (24) |
which can be integrated for a given set of initial conditions (Small & Blandford 1992; Yu & Tremaine 2002; Ferrarese 2002a; Marconi & Salvati 2002; Marconi et al. 2004; Shankar et al. 2004).
The most recent application of these arguments is by Shankar et al. (2004). Starting from the 2dF QSO Survey from Croom et al. (2003), the authors find a total cumulative mass density in SBH accreted during the bright AGN phase of M⊙ Mpc-3 for a radiative efficiency (Figure 40). This value is consistent with several other estimates in the literature (see Table 10), although the exact value is sensitive to the bolometric correction that needs to be applied to the optical fluxes (uncertain by at least 30% and perhaps as much as a factor two, Elvis et al. 1994, Vestergaard 2003) and, to a lesser extent, the luminosity function used in the analysis. In this regard, it is worth pointing out that the magnitude limits of the 2dF (, Boyle et al. 2000, Croom et al. 2003) and Sloan QSO surveys (, Fan et al. 2001) correspond to Eddington limits on the SBHs masses of M⊙ and M⊙ respectively. This implies that, at in particular, QSO surveys probe only the most massive supermassive black holes, in sharp contrast with the local SBH sample (e.g. Figure 32), requiring a not necessarily trivial extrapolation to smaller masses. Furthermore, the QSO luminosity function is not sampled in the range. Extrapolating within this range is reasonable but not altogether satisfactory, and could produce an overestimate of the cumulative SBH mass density below of a factor of a few (Ferrarese 2002a)999While the extrapolation to of the mass density of the SDSS QSOs joins smoothly with those measured from the 2dF survey at the same redshift for M⊙, this is not true for smaller masses, where the SDSS mass density extrapolated to overpredicts the QSO mass density (per unit redshift) derived from the 2dF data by an order of magnitude..
SBH mass densities derived from optical surveys fail to account for the contribution from obscured populations of AGNs that are known to exist from X-ray observations. Early studies relied on spectral synthesis models of the X-ray background, the general consensus being that luminous X-ray absorbed AGNs, possibly showing a fast redshift evolution, are necessary to reproduce the keV integrated source spectrum (Fabian & Iwasawa 1999; Salucci et al. 1999; Gilli, Salvati & Hasinger 2001; Elvis et al. 2002). Without redshift measurements, estimates of the contribution of these obscured sources to the SBH mass density were necessarily based on the assumption that they share the same redshift evolution as their better studied, unobscured counterparts. Such estimates generally yielded values in excess, by a factor of several, of the mass density in SBH recovered locally in quiescent or weakly active galaxies (see below). For example, Barger et al. (2001), integrated the accretion rate density inferred from the bolometric luminosity of a sample of 69 hard X-ray sources to obtain a total cumulative mass density of SBHs of M⊙Mpc-3 (for ), a factor larger than recovered locally (Yu & Tremaine 2002; Ferrarese 2002a; Marconi & Salvati 2001).
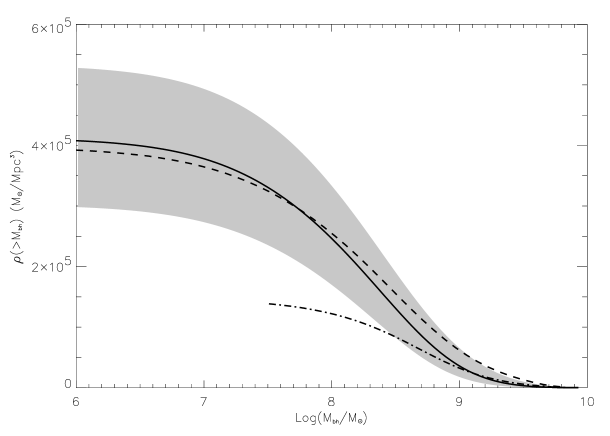
The launch of the Chandra and the XMM-Newton satellites has made it possible to resolve most of the X-ray background into individual sources; optical followups revealed that the bulk of the sources are at a redshift , which is significantly lower than the one which characterizes the optically bright phase of the quasars (Alexander et al. 2001; Barger et al. 2002; Hasinger 2002; Rosati et al. 2002; Cowie et al. 2003). The redshift distribution of the obscured sources affects both their intrinsic luminosity and the bolometric correction to the observed X-ray fluxes (which differs for high luminosity and low luminosity AGNs). Although accounting for this has led to a downward revision in the cumulative SBH mass density in obscured AGNs ( M⊙Mpc-3 according to Shankar et al. 2004, see also Table 10), the mass accreted could be enough to account for all SBH found locally if X-ray selected AGNs accrete with 10% radiative efficiency and radiate at 30% of the Eddington luminosity (Shankar et al. 2004). The current scenario is therefore of a population of unobscured, high luminosity quasars which dominate the accretion at high redshift, and a lower redshift population of obscured AGNs accreting at much lower rates101010For instance, Cowie et al. estimate that obscured AGNs accrete at no more than a few M⊙yr-1 Mpc-3., but possibly accounting for the bulk of the accreted mass.
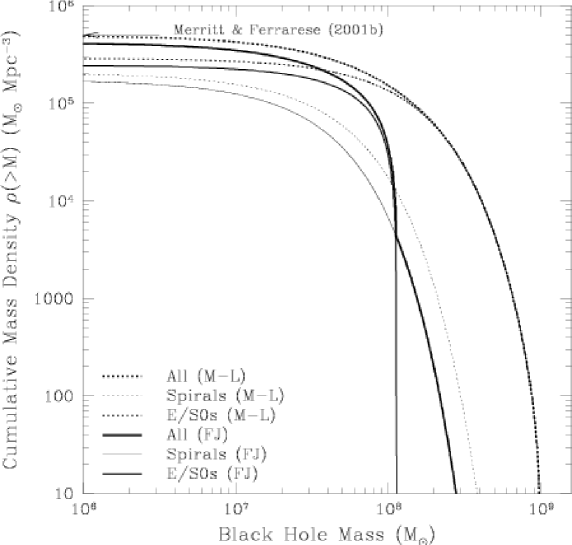
| Summary of SBH Mass Densities | |
|---|---|
| Reference | |
| (M⊙Mpc-3) | |
| Local Quiescent Galaxies () | |
| Wyithe & Loeb (2003) | |
| Aller & Richstone (2002) | |
| Yu & Tremaine (2002) | |
| McLure & Dunlop (2004) | |
| Shankar et al. (2004) | |
| Ferrarese (2002a) | |
| Marconi et al. (2004) | |
| Merritt & Ferrarese (2001a) | |
| Yu & Tremaine (2002) | |
| QSOs Optical Counts () | |
| Shankar et al. (2004) | |
| Fabian (2003) | |
| Yu & Tremaine (2004) | |
| Marconi et al. (2004) | |
| Ferrarese (2002a) | |
| AGN X-ray Counts () | |
| Fabian (2003) | |
| Shankar et al. (2004) | |
| Marconi et al. (2004) | |
The SBH mass function in local (), optically-selected AGNs has received considerably less attention for several reasons. Compared to QSOs, lower-luminosity AGNs have a small ratio of nuclear to stellar luminosity, making it difficult to assess what fraction of the total luminosity is due to accretion onto the central black hole. Furthermore, the past accretion history is not known, and it is quite likely that a significant fraction of the SBH mass predates the onset of the present nuclear activity. Finally, it is unlikely that lower luminosity AGNs are accreting at a constant fraction of the Eddington rate. Padovani, Burg & Edelson (1990) estimated a total cumulative mass density in local Seyfert 1 galaxies of M⊙Mpc-3, based on the photoionization method (§ 8.5) applied to the CfA magnitude limited sample. A recent revision of this result (Ferrarese 2002a), led to an estimate a factor larger (Figure 40). This notwithstanding, the main conclusion reached by Padovani et al. still holds: “the bulk of the mass related to the accretion processes connected with past QSO activity does not reside in Seyfert 1 nuclei. Instead, the remnants of past activity must be present in a much larger number of galaxies”. This is true even after correcting for the contribution of AGNs other than Seyfert 1 galaxies (in the local universe, the ratio of Seyfert 2 to Seyfert 1 galaxies is four, while LINERs are a factor of a few more numerous than Seyferts, e.g. Maiolino & Rieke 1995; Vila-Vilaro 2000).
Finally, in local quiescent galaxies - the necessary repository of the SBHs which powered quasar activity at high redshifts - the SBH mass function can be calculated from the or, preferably due to its smaller scatter, the relation. If the mean ratio between the mass of the SBH and that of the host bulge is known, the observed mass density of spheroids (e.g. Fukugita et al. 1998) can be easily transformed into a SBH mass density. This approach was adopted by Merritt & Ferrarese (2001a). The relation was used to estimate for a sample of 32 early type galaxies with a dynamical measurement of the total mass (from Magorrian et al. 1998). For this sample, the frequency function is well approximated by a Gaussian with and standard deviation . This implies or, when combined with the mass density in local spheroids from Fukugita et al. (1998), M⊙Mpc-3.
Alternatively, can be derived by combining the relation with the velocity function of galaxies. Compared to the previous method, this has the added bonus of producing an analytical representation of the cumulative SBH mass density as a function of . The process, however, can be rather involved. The velocity function is generally constructed starting from a galaxy luminosity function (e.g. Marzke et al. 1998; Bernardi et al. 2003). This needs to be converted to a bulge luminosity function, which entails the adoption of a ratio between total and bulge luminosity (e.g. from Fukugita et al. 1998). Both steps need to be carried out separately for galaxies of different Hubble types. The derived bulge luminosity function can be combined directly with the relation to give a SBH mass function, or it can first be transformed to a velocity dispersion function (through the Faber-Jackson relation, which again depends on the Hubble type), and then combined with the relation. Both approaches have drawbacks. The relation has significant (and possibly Hubble-type dependent) scatter, while the Faber-Jackson relation has large scatter and is ill defined, especially for bulges. The approach above was followed by Salucci et al. (1999), Marconi & Salvati (2001), Ferrarese (2002a), Yu & Tremaine (2002), Aller & Richstone (2002), Marconi et al. (2004) and Shankar et al. (2004). Figure 41 shows the cumulative SBH mass functions separately for the E/S0 and spiral populations, derived by Ferrarese (2002a) from the relation and the relation combined with the Faber-Jackson relations for ellipticals and spirals. While the two distributions differ in the details, there is little difference in the total mass density, which falls in the range M⊙Mpc-3.
Wyithe & Loeb (2003) and the Shankar et al. (2004) used yet another, more direct approach, and employed the velocity dispersion function directly measured by Sheth et al. (2003) from SDSS data. The only disadvantage of this approach is that the SDSS velocity dispersion function is defined only for early-type galaxies, and therefore incomplete below 200 km s-1, i.e. in the regime populated by spiral galaxies ( M⊙). The mass function derived by Wyithe & Loeb is shown in Figure 42. As pointed out by the authors, the mass function differs from the one derived using the methods described in the preceding paragraphs (e.g. Yu & Tremaine 2002), declining more gradually at the high mass end (where the velocity dispersion function is measured directly). By comparing the local mass function with that derived by combining the Press-Schechter (1974) halo mass function with the relation, Wyithe & Loeb find that SBHs with M⊙ formed during the peak of quasar activity (), while more massive black holes were already in place at higher redshifts, as high as for SBHs of a few M⊙. Integrating over , the total cumulative mass density is estimated to be M⊙ Mpc-3 (see also Shakar et al. 2004).
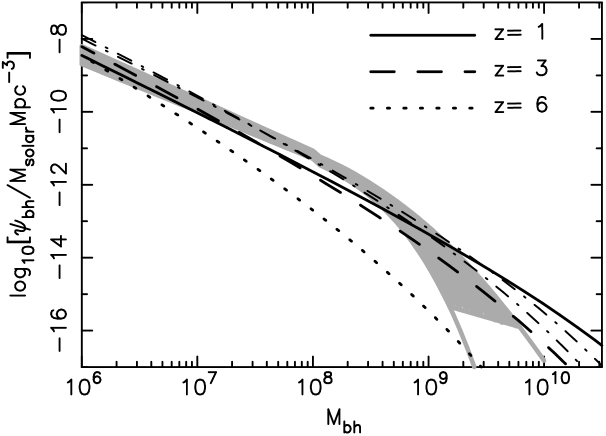
These results indicate, that, given the current uncertainties, the total cumulative mass function in SBHs hosted by local galaxies is of the correct order of magnitude to account for the AGNs energetics, although the relative contribution of high redshift optical QSOs and local obscured AGNs remains somewhat uncertain (Marconi et al. 2004; Shankar et al. 2004; Table 10). The fine details remain to be worked out. For instance, Yu & Tremaine (2002) claimed a larger fraction of very massive black holes, , in high redshift QSOs than have been recovered locally, although this result is not supported by more recent studies (Marconi et al. 2004, Shankar et al. 2004, see Figure 40). The case is complicated by the fact that, as noted by Wyithe & Loeb 2003 and Ferrarese 2002a, the local SBH mass function is not defined in the high ( M⊙) mass range . In this context, targeting SBHs in brightest cluster galaxies (§ 11), will be particularly illuminating.
Section 11 THE FUTURE OF SUPERMASSIVE BLACK HOLE STUDIES.
The past sections dealt with the measurements of SBH masses in a (relatively) large number of nearby galaxies, and the scaling relations which have ensued between SBH masses and the properties of their host galaxies or nuclei. A graphic summary is given in Figure 43. It is a remarkable fact that most of the information contained in the Figure has surfaced only in the past few years; even more remarkable to think that, in spite of the tremendous progress made, we are still only at the beginning of a long, fascinating journey. We have yet to find out, for instance, if SBHs spin and how fast, whether binary SBHs exist and how quickly they coalesce following galaxy mergers, what are the detailed modalities of accretion, and what controls the character and level of nuclear activity. We have not yet probed the morphology and kinematics of the gas within a few thousands of Schwarzschild radii from the central SBH. On a grander scale, we do not know how supermassive black holes form. We are, however, for the first time, in a position in which it does not appear hopelessly optimistic to think that answers will be found in the near future.
THIS FIGURE IS INCLUDED IN THE FULL VERSION OF THE
MANUSCRIPT AVAILABLE AT http://www.physics.rutgers.edu/ lff/publications.html.
We will conclude this review with a brief discussion of what observational breakthroughs are required to catalyse further progress. To this day, the field has been propelled forward largely by a single event, the launch of the Hubble Space Telescope in 1990. With (at the time) a 10-fold boost in spatial resolution compared to ground based optical telescopes, HST could resolve the sphere of influence of putative SBHs in a significant number of galaxies. HST also enabled the discovery of the nuclear, regular gas and dust disks which opened a new, unexpected, and ultimately very successful way to constrain the central potential (§ 7). It remains true that the case for a singularity is airtight only in the Galactic center and NGC 4258, both of which were studied using ground based facilities. However, proper motion studies are not feasible in extragalactic nuclei (although Galactic globular clusters might be promising targets), and though water masers hold great promise (Greenhill et al. 2003a), they have not yet and are unlikely to produce more than a few (albeit superlative, if NGC 4258 is any indication) more detections. The natural question to ask is therefore, what will be the role of HST in the years to come? The answer is, unfortunately, not as optimistic as one might hope, making it necessary to look elsewhere for new ways to boost our knowledge in this field.
To farther our understanding of SBH formation and evolution, it is imperative to target SBH environments as diverse and extreme as possible. For instance, if the evolution of SBHs follows a “merger tree” scenario, the very small and very large SBHs, the dwarf and brightest galaxies, occupy a precious niche in the parameter space, the former as the building blocks and the latter as the end results of the evolutionary chain. Dark matter dominated low surface brightness galaxies can tell us whether it is the bulge, or the dark matter halo that catalysizes the formation of SBHs (§ 9.2, 9.5). Unfortunately, not only have dwarf galaxies, brightest cluster galaxies and low surface brightness galaxies not been probed yet, the sample of galaxies listed in Table LABEL:tab:allmasses is uncomfortably homogeneous. Most are early type galaxies in small groups or clusters (M87 is the only cD) within 30 Mpc. Most detected SBHs are in the M⊙ range, there are no detections below M⊙ (the “building block” range) or above M⊙ (the brightest quasar range), and even the M⊙ range is very poorly sampled.
How much can HST broaden these horizons? Figure 44 shows (calculated using the relation, after transforming the total luminosity to bulge luminosity following Fukugita et al. 1998) against distance (for km s-1 Mpc-1) for all galaxies in the CfA redshift sample (Huchra et al. 1990). Exposure time requirements (HST’s mirror is rather small and the throughput is relatively low) are included in Figure 45, which is restricted, for simplicity, to early type galaxies only. Based on these two figures, it is clear HST can only (and pretty much has already) scrape the top of the iceberg. For instance, ironically, most of the very largest SBHs ( M⊙) are beyond the reach of HST, since the low surface brightness which characterizes giant ellipticals makes stellar dynamical studies prohibitively time consuming111111For instance, measuring in M87 ( Mpc) using stellar dynamics would require over 100 orbits of STIS time.. Similarly, the less massive SBHs, typically expected to be hosted in dwarf elliptical galaxies, are beyond HST capabilities: the stellar population in the nearest dwarfs – where HST can resolve the sphere of influence of a small, hundred thousand solar masses SBH, is resolved in individual stars, each too faint to be handled by HST’s small mirror121212For instance, a constraint on the central mass in NGC 147 ( kpc) would require several hundred orbits with STIS..
It seems unavoidable that a 10-meter class, diffraction limited (at 8500 Å) telescope131313This is a somewhat loose requirement, which is made by simply scaling the performance of HST/STIS to a telescope with larger collective area/resolution. It is possible that a ground based telescope with adaptive optics working at 8500 Å might prove sufficient - although more detailed modeling, accounting for the PSF shape, should be carried out to verify this point. will be needed to fully explore the incidence of SBHs as small as and as large as M⊙, or to target galaxies fully sampling the Hubble sequence. If one wishes to reach galaxies in the most nearby rich Abell clusters, and study the influence of environment on the formation and evolution of SBHs, the requirements are even more stringent, demanding a 30-meter class, diffraction limited telescope. While there are currently no plans to replace HST with a new optical space telescope (HST’s replacement, the James Webb Space Telescope, will operate at near and mid-infrared wavelengths), several ground based 10m class telescopes are already in operation (Keck, Gemini, VLT, Subaru, etc.). Designs for 30m (CELT - the California Extremely Large Telescope; GSMT - the Giant Segmented Mirror Telescope; VLOT - the Very Large Optical Telescope) and 100m (OWL - the Overwhelmingly Large Telescope) are at various stages of development. For all of these telescopes, diffraction limited performance in the near infrared using Adaptive Optics techniques is a priority, and will soon become routine operation. In the near infrared, stellar kinematics can be obtained through observations of the CO bandhead at 2.3 m; at these wavelengths, a ground based, AO-equipped, 8m-class telescope will have resolution comparable to the one HST achieves at the CaII triplet near 8500 Å. The availability of Integral Field Spectrographs (IFUs), several of which are either commissioned or in operation, is another important advantage of ground-based telescopes over HST, since a full kinematical map is critical to fully understand the dynamical structure of galactic cores (e.g. de Zeeuw 2003)
Multiple-conjugate adaptive optics (MCAO), producing diffraction limited images over wide field of views, are being developed at several existing observatories (e.g. Gemini and the VLT) in the near infrared. In the more distant future, the hope is that MCAO will become a reality in the optical as well. The increased sensitivity, combined with the critical increase in resolving power, will provide the perfect conditions for systematic and complete surveys of SBHs in the local universe.
THIS FIGURE IS INCLUDED IN THE FULL VERSION OF THE
MANUSCRIPT AVAILABLE AT http://www.physics.rutgers.edu/ lff/publications.html.
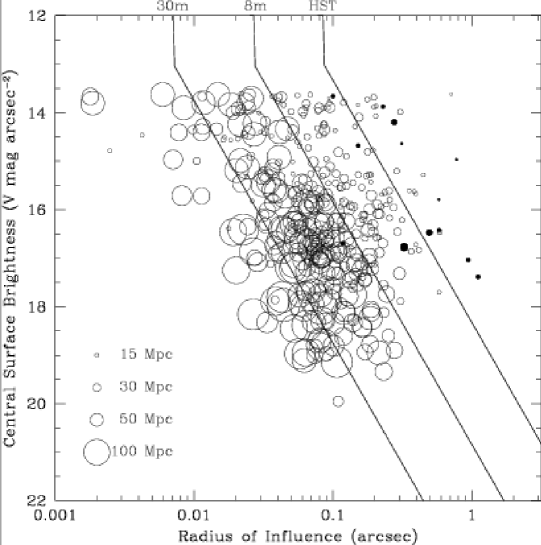
Until then, reverberation mapping (§ 8.3) is likely to replace traditional resolved dynamics as the method of choice to probe the very smallest, largest and most distant SBHs. The implementation of queue scheduling at some large ground based optical facilities (Gemini, SALT, and the VLT) will greatly increase the efficiency of the monitoring programs. The masses inferred from the time-delays will receive a final stamp of approval once the morphology and kinematics of the BLR are firmly established. The latter task, which requires multi-wavelengths monitoring with very stringent conditions for the time resolution and length of the program, will remain the prerogative of dedicated space missions (Peterson & Horne 2003; Peterson, Polidan & Robinson 2003). There are three dozen galaxies for which time delays have been measured to date, it doesn’t seem unreasonable to think that this sample could be doubled in the near future. Even then, studying the redshift evolution of SBH scaling relations will more realistically be done using secondary mass estimators tied to reverberation mapping (§ 8.4).
Detecting SBH binaries is another important goal for future research. The formation of SBH binaries following galaxy merging seems unavoidable (Begelman, Blandford & Rees 1980), and indeed the coalescence of binary SBHs has been called into action to account for the peculiar properties of the jets/lobes in some radio galaxies (Merritt & Ekers 2002; Liu, Wu & Cao 2003). The existence of a SBH binary has also recently been claimed in the radio galaxy 3C 66, based on the positional change of the radio core detected in VLBI observations (Sudou et al. 2003). The elliptical orbit traveled by the core in a year period (apparently not a result of the orbital motion of the Earth) is interpreted as due to a SBH binary with a separation of cm, and total mass in the neighborhood of M⊙(assuming that the radio core is associated with the least massive of the SBHs). The presence of two SBHs (about 1 kpc apart and therefore not strictly yet forming a binary system) in the Ultraluminous Infrared Galaxy NGC 6240 is betrayed by the Chandra X-ray detection of two optical/IR nuclei (Komossa et al. 2003). From a dynamical prespective, the evolution of a SBH binary is very uncertain (Ebisuzaki, Makino & Okumura 1991; Milosavljevic & Merritt 2002; Yu 2002), but current state-of-the-art simulations (Milosavljevic & Merritt 2002) predict the first stages of the evolution, leading to the formation of a hard binary with separation between a few hundredths to a few parsecs depending on the masses involved, to proceed very rapidly, within one Myr after galaxy merging. The subsequent evolution is dominated by the exchange of energy between the binary and nearby stars, reducing the binary separation to pc () before the hardening is stalled following the depletion of stars with which the binary can interact. Although on this scale the predicted stellar rotational velocity and velocity dispersion differ significantly from the case of a single SBH (Figure 46), resolving this region in the optical requires a 100m-class diffraction limited telescope even in the most nearby systems (Ferrarese 2003).

The ultimate proof of the existence of binary SBHs will likely not be made using traditional methods. Indeed, progress in this field will be tied to the most challenging, anticipated, and - in our view - exciting of all future developments: the launch of gravitational wave missions, such as the proposed Laser Interferometer Space Antenna (LISA, Phinney 2003). Such missions will prove (or disprove) the existence of black hole binaries by recording (or failing to record) their coalescence. They will do so by detecting the purely relativistic signature imprinted by the event on the fabric of space time, i.e. by observing the very signature of a strong field regime which has so far eluded all investigations. We started this review by identifying the “birth” of the modern era of BH studies with the 1915 publication of Albert Einstein’s theory of general relativity. It seems only fitting that we should return to Einstein’s contribution in our concluding remarks.
In 1916 Einstein predicted that accelerating masses will emit gravitational waves that are manifested as ripples (changes in the curvature) propagating through the fabric of spacetime. Because the gravitational wave draws its energy from the energy of the binary, the objects in the binary will spiral in with an ever-decreasing orbital period, and will eventually coalesce. Because spacetime is very “stiff”, the amplitude of the ripples, and the corresponding stretching and compression of objects imbedded in spacetime, is exceedingly small and difficult to detect. A neutron star (NS) binary system at 300 Mpc produces a spacetime strain (Thorne 1994; Barish 2000), where the change in length by compression and stretching is given by . The amplitude of the wave that produces the strain is directly proportional to the mass of the accelerating object, and, in contrast to electromagnetic radiation, inversely proportional to the distance to the source (e.g. de Araujo, Miranda, & Aguiar 2001). A gravitational wave with a strain of moving through the solar system will change the mean Earth-Moon separation by microns! The endeavors to measure gravitation waves are testimonies to the ingenuity, sophistication, and boldness of physicists. The payoff from the formidable task of detecting gravitational waves will be an unprecedented opportunity to observe and study general relativistic phenomena in extremis.
A worldwide network of terrestrial gravitational wave observatories is already at work; the American LIGO (Barish 2000; Abbott, B. 2004), the British-German GEO600 detector (Danzmann, K. 1995; Willke et al. 2002; Abbott et al. 2004), the French-Italian VIRGO detector (Acernese et al. 2002), the Japanese TAMA300 detector (Ando et al. 2002), and five resonant-bar detectors (Allen et al. 2000). These experiments are designed to detect the characteristic “chirp” (rapid increase in frequency) produced by the merger of neutron stars (NS), stellar black holes, and by the formation of black holes in asymmetrical supernova explosions within tens of Mpc (Abbott, B. et al. 2003). For instance, LIGO, which consists of two independent optical laser interferometers each with two equal 4-km long (1-m diameter) evacuated arms in an L-configuration (Barish 2000; Abbott, B. 2004), has a design sensitivity (equivalent RMS strain amplitude spectral density) for the strain (differential fractional change in the length of the two arms) induced by gravitational waves with frequencies between 30 Hz and 7000 Hz (Abbott et al. 2004). Depending on the uncertain rate of NS/NS and BH/BH mergers in galaxies (Lipunov, Postnov, & Prokhorov 1997; Kalogera et al. 2001), LIGO will be able to detect NS/NS mergers out to 20 Mpc (Abbott et al. 2004) when it achieves its design sensitivity. LIGO’s first data run in 2002, which lasted for 17 days, was sensitive to binary inspiral events at maximum distances between 30 and 180 Kpc, depending on the instrument configurations during the run. The run established an upper limit events per year per equivalent Milky Way Galaxy (Abbott et al. 2003).
Below 10 Hz, the critical range where gravitational waves from the coalescence of SBH binaries are emitted, ground-based gravitational wave observatories are crippled by the seismic noise floor. Space, once again, represents the answer. The next extraordinarily ambitious step in gravitational wave astronomy is the proposed joint NASA/ESA mission to launch a Laser Interferometer Space Antenna (LISA) in 2015. LISA will consist of three spacecraft at the corners of an equilateral triangle with km arms in an orbit that trails the earth by 20 degrees (Danzmann 2000). The angle between the plane of the triangle and the ecliptic will be 60∘. Each spacecraft has two interferometers in a Y-shaped arm that send/receive a laser beam to/from each of the other spacecraft. The remarkable return mirror in each of the interferometer arms is a highly polished, free-flying 4-cm platinum-gold cube. The cubes within their vacuum enclosures are maintained in a drag-free inertial orbit by sensing the cubes positions relative to the spacecraft and moving the spacecraft with micro-newton field emission thrusters to follow the cubes. The spacecraft must follow the orbits of the reference cubes with an accuracy of 10 nanometers, and measure the distance between the spacecraft with an accuracy of microns. When these challenges are met, LISA will be able to measure strains of (SNR = 5) at frequencies from Hz to 1 Hz with a year of observations (Danzmann 2000).
LISA then will be able to observe the formation and merger of SBHs throughout the Universe. With persistence and sustained funding, gravitational wave observatories will usher in a new era in relativistic astrophysics that will allow us to observe the most extreme and most energetic events in the Universe.
References
- Abbott, B., et al. 2003, arXiv:grqc/ 0308069 v1 21 Aug 2003
- Abbott, B., et al. 2004, NIMPA, 517, 154
- Acernese, F., et al. 2002, CQGra, 19, 1421
- Adams, F. C., Graff, D. S., & Richstone, D. 2000, ApJ, 551, L31
- Akritas, M. G., & Bershady, M. A. 1996, ApJ, 470, 706
- Alexander, D.M., et al. 2001, ApJ, 122, 2156
- Allen, C.R., etal. 1962, MNRAS, 124, 477
- Allen, Z.A., et al. 2000, PhRvL, 85, 5046
- Alonso-Herrero, A., Ivanov, V.D., Jayawardhana, R., & Hosokawa, T. 2002, ApJ, 571, L1
- Ando, M., et al. 2002, CQGra, 19, 1409
- Antonucci, R.R.J. 1993, ARA&A, 31, 473
- Antonucci, R.R.J., & Miller, J.S. 1985, ApJ, 297, 621.
- Arav, N., Barlow, T.A., Laor, A., & Blandford, R.D. 1997, MNRAS, 288, 1015
- Arav, N., Barlow, T.A., Laor, A., Sargent, W.L.W., & Blandford, R.D. 1998, MNRAS, 297, 990
- Baade, W., & Minkowski, R. 1954, ApJ, 119, 206
- Baade, W. 1955 ApJ, 123, 550
- Bacon, R., Emsellem, E., Combes, F., Copin, Y., Monnet, G., & Martin, P. 2001, A&A, 371, 409
- Baes, M., Buyle, P., Hau, G.K.T., & Dejonghe, H. 2003, MNRAS, 341, L44
- Balick, B., & Brown, R.L. 1974, ApJ, 194, 264
- Bao, G., & Abramowicz, M.A. 1996, ApJ, 465, 646
- Barger, A. J. et al. 2001, AJ, 122, 2177
- Barger, A. J. et al. 2002, AJ, 124, 1839
- Barish, B.C. 2000, AdSpR, 25, 1165
- Barth, A. et al. 2001, ApJ, 555, 685
- Barth, A., Ho, L.C., & Sargent, W.L.W. 2002, ApJ, 566, L13
- Barth, A., Ho, L.C., & Sargent, W.L.W. 2003, ApJ, 583, 134
- Begelman, M. C., Blandford, R. D., & Rees, M. J. 1980, Nature, 287, 307
- Begelman, M.C. 2001, ApJ, 551, 897
- Belloni, T., & Hasinger, G. 1990, A&A, 227, L33
- Bernardi M., et al., 2003, AJ, 125, 1817
- Bian, W.-H., & Zhao, Y.-H. 2003, PASJ, 55, 143
- Binney, J., & Mamon, G.A. 1982, MNRAS, 200, 361
- Binney, J. & Tremaine, S. 1987 Galactic Dynamics, Princeton University Press (Princeton)
- Blandford, R.D., & McKee, C.F. 1982, ApJ, 255, 419 R.D., & Begelman, M.C. 1999, MNRAS, 303, L1
- Blandford, R. D., & Begelman, M. C. 1999, MNRAS, 303, L1
- Blumenthal, G.R., & Mathews, W.G. 1975, ApJ, 198, 517
- Bolton, C.T. 1972, Nature, 235, 271
- Boroson, T.A. 2002, ApJ, 565, 78
- Bottorff, M., Korista, K.T., Shlosman, I., & Blandfrod, R.D. 1997, ApJ, 479, 200
- Boyle, B.J., et al. , 2000, MNRAS, 317, 1014
- Bower, G., et al. 1998, ApJ, 492, L111
- Braatz, J.A., Wilson, A.S., & Henkel, C. 1994, ApJ, 437, L99
- Braatz, J.A., Wilson, A.S., & Henkel, C. 1996, ApJS, 106, 51
- Braatz, J.A., Wilson, A.S., & Henkel, C. 1997, ApJS, 110, 321
- Brucato, R.J., & Kristian, J. 1972, ApJ, 173, 105
- Bryan, G. L., & Norman, M. L. 1998, ApJ, 495, 80
- Bullock, J.S., et al. 2001, MNRAS, 321, 559
- Burbidge, G.R. 1962, in ‘Problems of Extra-Galactic Research’ Proceedings from IAU Symposium no. 15. Eds George Cunliffe McVittie. Macmillan Press, New York, p.258
- Cappellari, M. et al. 2002, 578, 787
- Cattaneo, A., Haehnelt, M. G., & Rees, M. J. 1999, MNRAS, 308, 77
- Cecil, G., Wilson, A.S., & Tully, R.B. 1992, ApJ, 390, 365
- Cecil, G., et al. 2000, ApJ, 536, 675
- Chandrasekhar, S. 1931, ApJ, 74, 81
- Chandrasekhar, S. 1935, MNRAS, 95, 226
- Cheung, et al. 1969, Nature, 221, 626
- Chiang, J., & Murray, N. 1996, ApJ, 466, 704
- Chokshi, A. & Turner, E. L., 1992, MNRAS, 259, 421
- Cipollina, M., & Bertin, G. 1994, A&A, 288, 43
- Claussen, M.J., Hellingman, G.M., & Lo, K.Y., 1984, Nature, 310, 298
- Claussen, M.J., & Lo, K.Y., 1986, ApJ, 308, 592
- Collin-Souffrin, S., Dyson, J.E., McDowell, J.C., Perry, J.J. 1988, MNRAS, 232, 539
- Cowie, L.L., et al. 2003, ApJ, 584, L57
- Crane, P., et al. 1993, AJ, 106, 1371
- Crawford, M. K., Genzel, R., Harris, A. I., Jaffe, D. T., Lugten, J. B., Serabyn, E., Townes, C. H., & Lacy, J. H. 1985, Nature, 315, 467
- Cretton, N., & van den Bosch, F.C. 1999, ApJ, 514, 704
- Croom S. M., et al., 2003, astroph/0403040
- Curtis, H.D. 1918, Pub.Lick.Obs., 13, 31
- Dabrowski, Y., Fabian, A.C., Iwasawa, K., Lasenby, A.N., Reynolds, C.S. 1997, MNRAS, 288, L11
- Danzmann, K. 1995, GEO600 - A 600-m Laser Interferometric Gravitational Wave Antenna, in First Edoardo Amaldi Conference on gravitational wave experiments E. Coccia, G. Pizella and F. Ronga, eds., (World Scientific, Singapore), p.100-111
- Danzmann, K. 2000, AdSpR, 25, 1129
- de Araujo, J.C.N., Miranda, O.D, & Aguiar, O.D. 2001, ApJ, 550, 368
- Dettmar, R.-J., & Koribalski, B. 1990, A&A, 240, 15
- de Vaucouleurs, G., de Vaucouleurs, A., Corwin, H. G., Jr., Buta, R. J., Pasturel, G., & Fouqué, P. 1991, Third Reference Catalogue of Bright Galaxies (New York: Springer)
- Devereux, N., Ford, H.C., Tsvetanov, Z., & Jacoby, G. 2003, AJ, 125, 1226
- de Zeeuw, T. 2003, in ”Hubble Science Legacy: Future Optical/Ultraviolet Astronomy from Space”, eds. K.R.Sembach, J.C.Blades, G.D.Illingworth, & R.C. Kennicutt, ASPC Conference Series, vol. 291, P. 205.
- Dietrich, M., Wagner, S.J., Courvoisier, T.J.-L., Bock, H., & North, P. 1999, A&A, 351, 31
- di Matteo, T., Fabian, A.C., Rees, M.J., Carilli, C.L., & Ivison, R.J. 1999, MNRAS, 305, 492
- Doeleman, S.S., et al. 2001, AJ, 121, 2610
- Done, C., & Krolik, J.H. 1996, ApJ, 463, 144
- Done, C., Madejski, G.M., & Zycki, P.T. 2000, ApJ, 536, 213
- dos Santos, P.M. and Lepine, J.R.D. 1979, Nature, 278, 34
- Ebisuzaki, T., Makino, J., & Okumura, S. K. 1991, Nature,354, 212
- Eckart, A., Genzel, R., Hofmann, R., Sams, B. J., Tacconi-Garman, L. E. 1993, ApJ, 407, L77
- Eddington, A.S. 1930, ‘The internal Constitution of Stars’, Cambridge University Press, Cambridge, England
- Edelson, R., & Nandra, K. 1999, ApJ, 514, 682
- Einstein, A. 1915, Sitzungsberichte der Deutschen Akademie der Wissenschaften zu Berlin, Klasse fur Mathematik, Physik, und Technik, 844
- Eisenhauer, F., Schödel, R., Genzel, R., Ott, T., Tecza, M., Abuter, R., Eckart, A., & Alexander, T. 2003, ApJ, 597, L121
- Ekers, R. D., Goss, W. M., Schwarz, U. J., Downes, D., & Rogstad, D. H. 1975, A&A, 43, 159
- Elvis M., et al. 1994, ApJS, 95, 1
- Elvis, M., Risaliti, G., & Zamorani, G. 2002, ApJ, 565, 75
- Emmering, R.T., Blandford, R.D., & Schlosman, I. 1992, ApJ, 385, 460
- Emsellem, E., et al. 1999, MNRAS, 303, 495
- Faber, S. M., et al. 1989, ApJS, 69, 763
- Fabian, A.C., & Canizares, C.A 1988, Nature, 333, 829
- Fabian, A.C., Rees, M.J., Stella, L., & White, N. 1989, MNRAS, 238, 729
- Fabian, A.C., et al. 1995, MNRAS, 277, L11
- Fabian, A. C. & Iwasawa, K. 1999, MNRAS, 303, L34, 121, 662
- Fabian, A.C., Iwasawa, K., Reynolds, C.S., & Young, A.J. 2000, PASP, 112, 1145
- Fabian, A.C. 2003, Astron.Nach., 324, 4
- Falcke, H., Henkel, Chr., Peck, A. B., Hagiwara, Y., Almudena Prieto, M., & Gallimore, J. F. 2000, A&A, 358, L17
- Falomo, R., Kotilainen, J.K., Carangelo, N., & Treves, A. 2003, ApJ, 595, 624
- Fan, X., et al. , AJ, 2001, 121, 54
- Ferland, G.J., Peterson, B.M., Horne, K., Welsh, W.F., & Nahar, S.N. 1992, ApJ, 387, 95
- Ferrarese, L.. van den Bosch, F.C.. Ford, H.C., Jaffe, W. & O’Connell, R.W. 1994, AJ, 108, 1598
- Ferrarese, L., Ford, H.C., & Jaffe, W. 1996, ApJ, 470, 444
- Ferrarese, L., & Ford, H.C. 1999, ApJ, 515, 583
- Ferrarese, L. & Merritt, D., 2000, ApJ, 539 L9
- Ferrarese, L., Pogge, R.W., Peterson, B.M., Merritt, D., Wandel, A. & Joseph, C.M. 2001, ApJ, 555, L79
- Ferrarese, L. 2002a, in ‘Current high-energy emission around black holes’ Proceedings of the 2nd KIAS Astrophysics Workshop, Eds Chang-Hwan Lee and Heon-Young Chang. Singapore: World Scientific Publishing, p.3
- Ferrarese, L. 2002b, ApJ, 578, 90
- Ferrarese, L. 2003, in ”Hubble Science Legacy: Future Optical/Ultraviolet Astronomy from Space”, eds. K.R.Sembach, J.C.Blades, G.D.Illingworth, & R.C. Kennicutt, ASPC Conference Series, vol. 291, P. 196.
- Field, G.B., 1964, ApJ, 140, 1434
- Filippenko, A.V., & Ho, L.C. 2003, ApJ, 588, L13
- Ford, H.C., Dahari, O., Jacoby, G.H., Crane, P.C., & Ciardullo, R. 1986, ApJ, 311, L7.
- Ford, H.C., et al. 1994, ApJ, 435, L27
- Fowler, R.H. 1926, MNRAS, 87, 114
- Franceschini, A., Vercellone, S., & Fabian, A.C. 1998, MNRAS, 297, 817
- Fukugita, M., Hogan, C.J., & Peebles, P.J.E. 1998, ApJ, 503, 518
- Gallimore, J.F., Baum, S.A., O’Dea, C.P., & Pedlar, A. 1996a, ApJ, 458, 136
- Gallimore, J.F., Baum, S.A., O’Dea, C.P., Brinks, E., & Pedlar, A. 1996b, ApJ, 462, 740
- Gallimore,J.F., Baum, S.A., & O’Dea, C.P. 1996c, ApJ, 464, 198
- Gallimore,J.F., Baum, S.A., & O’Dea, C.P. 1997, Ap&SS, 248, 253
- Gardner, F.F., & Whiteoak, J.B. 1982, MNRAS, 201, 13
- Gebhardt, K., et al. 2000a, AJ, 119, 1157
- Gebhardt, K., et al. , 2000b, ApJ, 539, L13
- Gebhardt, K., et al. , 2000c, ApJ, 543, L5
- Gebhardt, K., et al. , 2003, ApJ, 583, 92
- Genzel, R., & Townes, C. H. 1987, ARA&A, 25, 377
- George, I.M., & Fabian, A.C. 1991, MNRAS, 249, 352
- Gerhard, O. 1993, MNRAS, 265, 213
- Gerhard, O., Kronawitter, A., Saglia, R. P., & Bender, R. 2001, AJ, 121, 1936
- Ghez, A. M., Klein, B. L., Morris, M., & Becklin, E. E. 1998, ApJ, 509, 678
- Ghez, A. M., Morris, M., Becklin, E. E., Tanner, A., & Kremenek, T. 2000, Nature, 407, 349
- Ghez, A.M., et al. 2003, ApJ, 586, L127
- Gilli, G.M., Salviati, M., & Hasinger, G., 2001, A&A, 366, 407
- Gondoin, P., Barr, P., Lumb, D., Oosterbroek, T., Orr, A., Parmar, A.N. 2001a, A&A 378, 806
- Gondoin, P., Lumb, D., Siddiqui, H., Guainazzi, M., Schartel, N., 2001b, A&A 373, 805
- Graham, A.W., Erwin, P., Caon, N., & Trujillo, I. 2001, ApJ, 563, L11
- Greenhill, L.J., Jiang, D.R., Moran, J.M., Reid, M.J., Lo, K.Y., & Claussen, M. J. 1995a, ApJ, 440, 619
- Greenhill, L.J., Henkel, C., Becker, R., Wilson, T.L., & Wouterloot, J.G.A. 1995b, A&A, 304, 21
- Greenhill, L.J., Gwinn, C.R., Antonucci, R., & Barvainis, R. 1996, ApJ, 472, L21
- Greenhill, L.J. & Gwinn, C.R. 1997, Astrophysics and Space Science, v. 248, 261
- Greenhill, L.J., Moran, J.M., & Herrnstein, J.R. 1997, ApJ, 481, L23
- Greenhill, L., et al. 1997, ApJ, 486, L15
- Greenhill, L., et al. 2002, ApJ, 565, 836
- Greenhill, L., et al. 2003a, ApJ, 582, L11
- Greenhill, L., et al. 2003b, ApJ, 590, 162
- Greenstein, J.L., & Schmidt, M. 1964, ApJ, 140, 1
- Haardt, F., & Maraschi, L. 1991, ApJ, 380, L51
- Haardt, F., & Maraschi, L. 1993, ApJ, 413, 507
- Haehnelt, M. G., Natarajan, P., & Rees, M. J. 1998, MNRAS, 300, 817
- Haehnelt, M. G., & Kauffmann, G. 2000, MNRAS, 318, L35
- Hagiwara, Y., Henkel, C., Menten, K.,M., & Nakai, N. 2001a, ApJ, 560, L37
- Hagiwara, Y., Diamond, P.J., Nakai, N., & Kawabe, R. 2001b, ApJ, 560, 119
- Hagiwara, Y., Diamond, P. J., & Miyoshi, M. 2002, A&A, 383, 65
- Harms, R.J., et al. 1994, ApJ, 435, L35
- Harrower, G.A. 1960, ApJ, 132, 22
- Harwit, M. 1998, “Astrophysical concepts”, New York: Springer.
- Haschick, A.D., & Baan, W.A. 1990, ApJ, 355, L23
- Haschick, A.D., Baan, W.A., & Peng, E.W. 1994, ApJ, 437, L35
- Hasinger, G. 2002, in “X-ray astronomy in the new millennium”, R. D. Blandford, A. C. Fabian and K. Pounds eds. Roy Soc of London Phil Tr A, vol. 360, Issue 1798, p.2077
- Hazard, MacKay & Shimmins 1965, in “ Quasi-Stellar Sources and Gravitational Collapse”, Proceedings of the 1st Texas Symposium on Relativistic Astrophysics. Ivor Robinson, Alfred Schild and E.L. Schucking eds. Chicago: University of Chicago Press, p.448
- Henkel, C., Guesten, R., Downes, D., Thum, C., Wilson, T.L., & Biermann, P. 1984, A&A, 141, L1
- Henkel, C., Braatz, J.A., Greenhill, L.J., & Wilson, A.S. 2002, A&A, 394, L23
- Heraudean, Ph., Simien, F. 1998 A&AS 133, 317
- Herrnstein, J.R., Greenhill, L.J., & Moran, J.M. 1996, ApJ, 468, L17
- Herrnstein, J.R., et al. 1999, Nature, 400, 539
- Ho, L. C. 1999, in Observational Evidence for Black Holes in the Universe, eds. S. K. Chakrabarti (Dordrecht: Reidel), p. 157
- Ho, L.C. 2002, ApJ, 564, 120
- Hoyle, F., & Fowler, W.A. 1963, MNRAS, 125, 169
- Hubeny, I., Agol, E., Blaes, O., & Krolik, J.H. 2000, ApJ, 533, 710
- Huchra, J. P., Geller, M. J., de Lapparent, V., & Corwin, H. G., Jr. 1990, ApJS, 72, 433
- Illingworth, G. 1977, ApJ, 218, L43
- Ishihara, Y., Nakai, N., Iyomoto, N., Makishima, K., Diamond, P., & Hall, P. 2001, PASJ 53, 215
- Iwasawa, K., et al. 1996, MNRAS, 281, L41
- Jaffe, W., Ford, H.C., Ferrarese, L., van den Bosch, F., & O’Connell, R.W. 1993, Nature, 364, 213
- Jennison, R.C., & Das Gupta M.K. 1953, Nature, 172, 996
- Jones, D.L., Wehrle, A.E., Meier, D.L., & Piner, B.G. 2000, ApJ, 534, 165
- Jorgensen, I., Franx, M., & Kjaergaard 1995, MNRAS, 276, 1371
- Kalogera, V., R. Narayan, R., Spergel, D.N. & Taylor, J.H. 2001, Astrophys. J. 556, 340
- Kaspi, S., Smith, P.S., Netzer, H., Maoz, D., Jannuzi, B.T., & Giveon, U. 2000, ApJ, 533, 631
- Kollatschny, W. 2003, A&A, 407, 461
- Komossa, S. et al. 2003, ApJ, 582, L15
- Koratkar, A. P., & Gaskell, C. M. 1991, ApJ, 370, L71
- Kormendy, J., et al. 1988, ApJ, 335, 40
- Kormendy, J., & Richstone, D. 1992, ApJ, 393, 559
- Kormendy, J., & Richstone, D., 1995, ARA&A, 581
- Kormendy, J., & Gebhardt, K. 2001, in AIP Conf. Proc. 586, The 20th Texas Symposium on Relativistic Astrophysics, ed. J. C. Wheeler & H. Martel (Melville: AIP), 363
- Krolik, J.H. 1998, in ”Theory of Black Hole Accretion Disks”, eds. Marek A. Abramowicz, Gunnlaugur Bjornsson, and James E. Pringle. Cambridge University Press, p.134
- Krolik, J.H. 2001, ApJ, 551, 72
- Kronawitter, A., Saglia, R. P., Gerhard, O., & Bender, R. 2000, A&AS, 144, 53
- Lacy, J. H., Townes, C. H., Geballe, T. R., & Hollenbach, D. J. 1980, ApJ, 241, 132
- Lacy, J. H., Townes, C. H., & Hollenbach, D. J. 1982, ApJ, 262, 120
- Lacy, M. et al. 2001, ApJ, 551, L17
- Landau, L. D. 1932, Phys. Z. Sowjetunion, 1, 285
- Laor, A. 1991, ApJ, 376, 90
- Laor, A. 2000, ApJ, 543, L111
- Lauer, T.R. 1995, AJ, 110, 2622
- Lee, M./H., & Goodman, J. 1989, ApJ, 343, 594
- Lipunov, V.M., Postnov, K.A., & Prokhorov, M.E. 1997, NewA., 2, 43
- Liu, F. K., Wu, X.-B., & Cao, S.L. 2003, MNRAS, 340, 411
- Loeb, A., & Rasio, F. 1994, ApJ, 432, L52
- Lynden-Bell, D. 1969, Nature, 223, 690Mauder, H. 1973, A&A, 28, 473
- Macchetto, D.F., et al. 1997, ApJ, 489, 579
- Maciejewski, W., & Binney, J. 2001, MNRAS, 323, 831
- Magorrian, J., et al. 1998, AJ, 115, 2285
- Maiolino, R., & Rieke, G.H. 1995, ApJ, 454, 95
- Malkan, M.A., & Sargent, W.L.W. 1982, ApJ, 254, 22
- Malkan, M.A. 1983, ApJ, 268, 582
- Maoz, E. 1998, ApJL, 494, 181
- Marchesini, D., Ferrarese, L. & Celotti, A., 2004, MNRAS, in press
- Marconi, A., et al. 2001, ApJ, 549, 915
- Marconi, A., & Salvati, M. 2002, in ”Issues in Unification of AGNs”, R. Maiolino, A. Marconi and N. Nagar eds., ASP Conf. Series
- Marconi, A., & Hunt, L.K. 2003, ApJ, 589, L21
- Marconi, A., et al. 2003, ApJ, 586, 868
- Marconi A., Risaliti G., Gilli R., Hunt L. K., Maiolino R., & Salvati M., 2004, MNRAS, 351, 169
- Martocchia, A., & Matt, G. 1996, MNRAS, 282, L53
- Marzke, R.O., et al. 1998, ApJ, 503, 617
- Matt, G., Perola, G.C., & Piro, L. 1991, A&A 247, 25
- Matt, G., Perola, G.C., Piro, L., & Stella, L. 1992, A&A 257, 63
- Mathur, S. 2000, NewAR, 44, 469
- Mauder, H. 1973, A&A, 28, 473
- McHardy, I., 1988, Mem.Soc.Astr.It, 59, 239
- McLure, R.J., & Dunlop, J.S. 2000, MNRAS, 317, 249
- McLure, R.J., & Dunlop, J.S. 2001, MNRAS, 327, 199
- McLure, R.J., & Jarvis, M.J. 2002, MNRAS, 337, 109
- McLure R. J., Dunlop. J. S., 2004, MNRAS, in press
- Melia, F., & Falcke, H. 2001, ARA&A, 39 309
- Merritt, D., & Ferrarese, L. 2001a, MNRAS, 320, L30
- Merritt, D., & Ferrarese, L. 2001b, ApJ, 547, 140
- Merritt, D., & Ferrarese, L. 2001c, in “The Central Kiloparsec of Starbursts and AGN: The La Palma Connection”, ASP Conference Proceedings Vol. 249. J. H. Knapen, J. E. Beckman, I. Shlosman, and T. J. Mahoney eds. San Francisco: Astronomical Society of the Pacific, p. 335.
- Merritt, D., & Ekers, R.D. 2003, Science, 297, 1310
- Mezger, P. G., & Wink, J. E. 1986, A&A, 157, 252
- Miller, M.C., & Colbert, E.J.M. 2004, Int.J.Mod.Phys., 13, 1
- Milosavljevic, M., & Merritt, D. 2001, ApJ, 563, 34
- Miyoshi, M., Moran, J., Herrnstein, J., Greenhill, L., Nakai, N., Diamond, P., & Inoue, M. 1995, Nature, 373, 127
- Monaco, P., Salucci, P., & Danese, L. 2000, MNRAS, 311, 279
- Moran, J., Greenhill, L., Herrnstein, J., Diamond, P., Miyoshi, M., Nakai, N., & Inoue 1995, in ”Quasars and AGN: High Resolution Imaging,” Proceedings of the National Academy of Sciences, Volume 92, Issue 25, pp. 11427
- Moran, J., Greenhill, L., & Herrnstein, J. 1999, J. Astroph. Astr., 20, 165
- Murray, N., Chiang, J., Grossman, S.A., & Voit, G.M. 1995, ApJ, 451, 498
- Murray, N., & Chiang, J. 1997, ApJ, 474, 91
- Mushotzky, R.F., Done, C., & Pounds, K.A. 1993, ARA&A, 31, 717
- Nakai, N., Inoue, M., & Miyoshi, M., 1993, Nature, 361, 45
- Nakai, N., Inoue, M., Miyazawa, K., Miyoski, M., & Hall, P. 1995, PASJ, 47, 771
- Nakano, T., & Makino, J. 1999, ApJ, 510, 155
- Nandra, K., Pounds, K.A., Stewart, G.C., Fabian, A.C., & Rees, M.J. 1989, MNRAS, 236, 39
- Nandra, K., George, I.M., Mushotzky, R.F., Turner, T.J., & Yaqoob, T. 1997, ApJ, 477, 602
- Nandra, K., George, I. M., Mushotzky, R. F., Turner, T. J., & Yaqoob, T. 1999, ApJ, 523, L17
- Narayan, R., & Yi, I, 1994, ApJ, 428, L13
- Navarro, J. F., & Steinmetz, M. 2000, ApJ, 538, 477
- Nelson, C. H., & Whittle, M. 1996, ApJ, 465, 96
- Netzer, H. 2003, ApJ, 583, L5
- Neufeld, D.A., & Melnick 1991, ApJ, 368, 215
- Neufeld, D.A., Maloney, P.R., & Conger, 1994 ApJ, 436, L127
- Neufeld, D.A., & Maloney, P.R. 1995 ApJ, 447, L17
- O’Brien, P. T., et al. 1998, ApJ, 509, 163
- Onken, C.A., & Peterson, B.M. 2002, ApJ, 572, 746
- Onken, C.A., Peterson, B.M., Dietrich, M., Robinson, A., & Salamanca, I.M., 2003, ApJ, 585, 121
- Onken, C.A., et al., 2004, ApJ, in press
- Oppenheimer, J.R., & Snyder, H. 1939, PhRv, 56, 455O
- Oppenheimer, J.R., & Volkoff, G.M. 1938, Phys. Rev., 55, 374
- Oshlack, A.Y.K.N., Webster, R.L., & Whiting, M.T. 2002, ApJ, 576, 81
- Padovani, P., Burg, R., & Edelson, R.A., 1990, 353, 438
- Peebles, P. J. E. 1972, Gen. Relativ. Gravitation, 3, 63
- Pelletier, G., & Pudritz, R.E. 1992, ApJ, 394, 117
- Peterson, B.M., 1993, PASP, 105, 247
- Peterson, B.M. 1999, in ”Structure and Kinematics of Quasar Broad Line Regions”, ASP Conference Series, Vol. 175. Eds. C. M. Gaskell, W. N. Brandt, M. Dietrich, D. Dultzin-Hacyan, and M. Eracleous. p.49
- Peterson, B.M., & Wandel, A. 2000, ApJ, 540, L13
- Peterson, B.M., et al. 2000, ApJ, 542, 161
- Peterson, B.M., et al. 2002, ApJ, 581, 197
- Peterson, B.M., 2002, in ”Advanced Lectures on the Starburst-AGN Connection”, 2001 (Singapore:World Scientific), p.3
- Peterson, B.M., 2003 in ”Future EUV/UV and Visible Space Astrophysics Missions and Instrumentation”. Eds J. Chris Blades, Oswald H. W. Siegmund. Proceedings of the SPIE, Volume 4854, p. 311
- Peterson, B.M., & Horne, K. 2003 in ”Astrotomography, 25th meeting of the IAU”.
- Peterson, B.M., Polidan, R.S., & Robinson, E.L. 2003, in ‘Future EUV/UV and Visible Space Astrophysics Missions and Instrumentation’. Eds J. Chris Blades, Oswald H. W. Siegmund. Vol. 4854, pp. 311-318
- Peterson, B.M. 2004, in “The Interplay Among Black Holes, Stars, and the ISM in Galactic Nuclei”, IAU Coll.222, eds. T. Storchi-Bergmann, L. Ho, and H.R. Schmitt, in press.
- Phinney, E.S., 2003, HEAD, 35, 2703
- Piro, L., Yamauchi, M., & Matsuoka, M. 1990, ApJ, 360, L35
- Pogge, R.W. 1989, ApJS, 71, 433
- Press, W.H., & Schechter, P. 1974, ApJ, 187, 425
- Quinlan, G. D., Hernquist, L., & Sigurdsson, S. 1995, ApJ, 440, 554
- Quinlan, G. D., & Hernquist, L. 1997, NewA, 2, 533
- Rees, M.J., Phinney, E.S., Begelman, M.C., & Blandford, R.D. 1982, Nature, 295, 17
- Rees, M.J. 1984, ARA&A, 22, 471
- Reid, M. J., Menten, K. M., Genzel, R., Ott, T., Schödel, R., & Eckart, A. 2003, ApJ, 587, 208
- Rest, A., et al. 2001, AJ, 121, 2431
- Reunanen, J., Kotilainen, J.K., & Prieto, M.A. 2003, MNRAS, 343, 192
- Reynolds, C.S. 1996, PhD Thesis, University of Cambridge.
- Reynolds, C.S. 1997, MNRAS, 286, 513
- Reynolds, C.S., & Nowak, M.A., 2003, Phys.Rept., 377, 389
- Rhoades, C. E., & Ruffini, R. 1974, Phys. Rev. Lett., 32, 324
- Richstone, D.O., & Schmidt, M. 1980, ApJ, 235, 361
- Richstone, D.O., & Tremaine, S. 1985, ApJ, 286, 370
- Richstone, D. O. et al. 1998, Nature, 395, A14
- Robinson, I., Schild, A., & Schucking, E.L., Proceedings of the 1st Texas Symposium on Relativistic Astrophysics, Chicago: University of Chicago Press, 1965
- Rosati, P., et al. 2002, ApJ, 566, 667
- Ross, R.R., Fabian, A.C., & Mineshige, S. 1992, MNRAS, 258, 189
- Salpeter, E.E. 1964, ApJ, 140, 796
- Salucci, P. et al. 1999, MNRAS, 307, 637
- Sandage, A. 1964, ApJ, 139, 416
- Sargent, W.L.W., et al. 1978, ApJ, 221, 731
- Sarzi, M., et al. 2001, ApJ, 550, 65
- Schlegel, D. J., Finkbeiner, D. P., & Davis, M. 1998, ApJ, 500, 525
- Schödel, R., Ott, T., Genzel, R., Eckart, A., Mouawad, N., & Alexander, T. 2003, ApJ, 596, 1015
- Schwarzschild, K. (1916a), 1916, Sitzungsberichte der Deutschen Akademie der Wissenschaften zu Berlin, Klasse fur Mathematik, Physik, und Technik, 189
- Schwarzschild, K. (1916b), 1916, Sitzungsberichte der Deutschen Akademie der Wissenschaften zu Berlin, Klasse fur Mathematik, Physik, und Technik, 424
- Schwarzschild, M. 1979 ApJ, 232, 236
- Scorza, C., & Bender, R. 1995, A&A, 293, 20
- Serabyn, E., & Lacy, J. H. 1985, ApJ, 293, 445
- Sergeev, S.G., Pronik, V.I., Peterson, B.M., Sergeeva, E.A., & Zheng, W. 2002, ApJ, 576, 660
- Seyfert, C.K. 1943, ApJ, 97, 28
- Shankar, F., Salucci, P., Granato, G.L., De Zotti, G., & Danese, L. 2004, MNRAS, in press
- Sheth, R.K., et al. 2003, ApJ, 594, 225
- Shields, G.A. 1978, Nature, 272, 706
- Shields, G.A. et al. 2003, ApJ, 583, 124
- Shklovski, I.S. 1954, Doklady Akad.Nauk., 98, 353
- Sigurdsson, S., Hernquist, L., & Quinlan, G. D. 1995, ApJ, 446, 75
- Siemiginowska, A., Kuhn, O., Elvis, M., Fiore, F., McDowell, J., & Wilkes, B.J. 1995, ApJ, 454, 77
- Silk, J., & Rees, M. J. 1998, A&A, 331, L1
- Simien, F., & de Vaucouleurs, G. 1986, ApJ, 302, 564
- Sincell, M.W., & Krolik, J.H. 1998, ApJ, 496, 737
- Smith, H.J., & Hoffleit, D. 1963, AJ, 68, 292
- Smith, M.D., & Raine, D.J. 1985, MNRAS, 212, 425
- Smith, M. D., & Raine, D. J. 1988, MNRAS, 234, 297
- Small, T., & Blandford, R.D. 1992, MNRAS, 259, 725
- Snellen, I.A.G., Lehnert, M.D., Bremer, M.N., & Schilizzi, R.T. 2003, MNRAS, 342, 889
- Sofue, Y., & Irwin, J.A. 1992, PASJ, 44, 353
- Soltan, A. 1982, MNRAS, 200, 115
- Steinmetz, M., & Muller, E. 1995, MNRAS, 276, 549
- Stern, B.E., Poutanen, J., Svensson, R., Sikora, M., & Begelman, M.C. 1995, ApJ, 449, L13
- Stirpe, G.M., et al. 1994, A&A, 285, 857
- Sudou, H., Iguchi, S., Murata, Y., & Taniguchi, Y. 2003, Science, 300, 1263
- Sun, W.-H, & Malkan, M.A. 1989, ApJ, 346, 68
- Sunyaev, R.A., & Truemper, J.1979, Nature, 279, 506
- Szuszkiewicz, E., Malkan, M.A., & Abramowicz, M.A. 1996, ApJ, 458, 474
- Tadhunter, C., Marconi, A., Axon, D., Wills, K., Robinson, T. G., & Jackson, N. 2003, MNRAS, 342, 861
- Takahashi, K., Inoue, H., & Dotani, T. 2002, PASJ, 54, 373
- Tanaka, Y., et al. 1995, Nature, 375, 659
- Thatte, N., Quirrenbach, A., Genzel, R., Maiolino, R., & Tecza 1997, ApJ, 490, 238
- Thorne, K.S., & Price, R. H. 1975, ApJ, 195, 101
- Thorne, K.S. 1994, Black Holes and Time Warps, Einstein’s Outrageous Legacy, W W Norton & Company, New York and London
- Tonry, J.L. et al. 2001, ApJ, 546, 681
- Tran, H.D., et al. 2001, AJ, 121, 2928
- Tremaine, S., et al. 2002, ApJ, 574, 740
- Trotter, A.S., et al. 1998, ApJ, 495, 740
- Turler, M., et al. 1999, A&AS, 134, 89
- Turner, J.L., & Ho, P.T.P. 1994, ApJ, 421, 122
- Ulrich, M.-H., & Horne, K. 1996, MNRAS, 283, 748
- Urry, C.M., & Padovani, P. 1995, PASP, 107, 803
- Valluri, M., Merritt, D., & Emsellem, E. 2004, ApJ, 602, 66
- van de Ven, G., Hunter, C., Verolme, E.K., & de Zeeuw, P.T. 2003, MNRAS, 342, 1056
- van den Bosch, F. C., & de Zeeuw, P. T. 1996, MNRAS, 283, 381
- van den Bosch, F. C., Jaffe, W., & van der Marel, R. P. 1998, MNRAS, 293, 343
- van der Kruit, P.C., Oort, J.H., Mathewson, D.S. 1972, A&A, 21, 169
- van der Marel, R.P., Franx, M.1993, ApJ, 407, 525
- van der Marel, R.P. 1994, MNRAS, 270, 271
- van der Marel, R.P., & van den Bosch, F.C. 1998, AJ, 116, 2220
- van der Marel, R.P. 1999, AJ, 117, 744
- Verolme, E.K., et al. 2002, MNRAS, 335, 517
- Vestergaard, M., Wilkes, B.J., & Barthel, P.D. 2000, ApJ, 538, L103
- Vestergaard, M. 2002, ApJ, 571, 733
- Vestergaard M. 2004, ApJ, 601, 676
- Vila-Vilaro, B. 2000, PASPJ, 52, 305
- Walker, R.C., Matsakis, D.N., and Garcia-Barreto, J.A. 1982, ApJ, 255, 128.
- Wandel A., 1999, ApJ, 519, 39
- Wandel, A., Peterson, B.M., & Malkan, M.A. 1999, ApJ, 526, 579
- Wandel, A. 2002, ApJ, 565, 762
- Wanders, I., & Horne, K. 1994, A&A, 289, 76
- Wanders, I., et al. 1995, ApJ, 453, L87
- Wanders, I., & Peterson, B. M. 1996, ApJ, 466, 174
- Wanders, I., et al. 1997, ApJS, 113, 69
- Wang, J.-M., Szuszkiewicz, E., Lu, F.-J., & Zhou, Y.-Y. 1999, ApJ, 522, 839
- Wang, J.-X., Wang, T.-G., & Zhou, Y.-Y. 2001, ApJ, 549, 891
- Watanabe, M., et al. 2003, ApJ, 591, 714
- Watson, W.D., & Wallin, B.K. 1994, ApJ, 432, L35
- Wyithe, J.S.B., & Loeb, A. 2002, ApJ, 581, 886
- Wyithe, J.S.B., & Loeb, A. 2003, ApJ, 595, 614
- Willke, B., et al. 2002, CQGra, 19, 1377
- Wilms, et al. 2001 MNRAS, 328, L27
- Wollman, E. R., Geballe, T. R., Lacy, J. H., Townes, C. H., & Rank, D. M. 1977, ApJ, 218, L103
- Woo, J.-H., & Urry, C. M. 2002a, ApJ, 579, 530
- Woo, J.-H., Urry, C. M. 2002b, ApJ, 581, L5
- Wu, X.-B., & Han, J.L. 2001, A&A, 380, 31
- Young, P. J. 1980, ApJ, 242, 1232
- Young, J.S., Claussen, M.J., & Scoville, N.Z. 1988, ApJ, 324, 115
- Young, A.J., & Reynolds, C.S. 2000, ApJ, 529, 101
- Yu, Q. 2002, MNRAS, 331, 935
- Yu, Q., & Tremaine, S. 2002, MNRAS, 335, 965
- Zdziarski, A.A., et al. 1994, MNRAS, 269, L55
- Zel’dovich, Y. B., & Novikov, I. D. 1964, Sov. Phys. Dokl., 158, 811