Abstract
New hydrodynamic models with feedback show that feedback driven turbulence and subsequent relaxation can drive recurrent starbursts, though most of these bursts fizzle due to premature, asymmetric ignition. Strong bursts are terminated when the turbulence inflates the multiphase central disk. The period between bursts is about twice a free-fall time onto the central disk. Transient spirals and bars are common through the burst cycle.
keywords:
Starburst galaxies, winds, numerical hydrodynamicsThe Recurrent Nature of Central Starbursts
There has been much discussion at this meeting on triggering mechanisms for starbursts. This topic is especially interesting when galaxy interactions, bar-driven inflows and other obvious sources of triggering are absent. Two other interesting questions are what turns off starbursts, and are starbursts naturally recurrent given an adequate gas supply? And finally, if they are recurrent, is the process deterministic or stochastic?
There are many candidate mechanisms for terminating bursts (see review of Leitherer, 2001), including 1) gas consumption, 2) gas loss to the wind, 3) conversion of cold gas to warm/hot phases, and 4) inflation of the central disk without total conversion to hot phases (as in dwarf galaxy models). The last two of these allow recurrence, the first two don’t. Since there are many complex processes involved, with incomplete sampling in any one observational waveband, it is hard to assemble a complete picture. Many models have been made of particular parts of the coupled starburst + wind phenomena.
Although models for all the thermo-hydrodynamic aspects of the starburst/wind phenomena are not possible, exploratory models of some the important couplings can shed light on the questions above. As a step towards that goal, I present here some preliminary results of numerical hydrodynamical models. These are N-body/SPH models carried out with the Hydra3.0 code of Couchman, Thomas, and Pearce (1995), which includes optically thin radiative cooling (Sutherland and Dopita) for temperatures above . The model galaxies consist of three components: a dark matter halo (10,000 collisionless particles), stellar disk (9550 collisionless particles), and a gas disk (9550 SPH particles). The mass per particle is , and the total galaxy mass is .
A feedback prescription was also added to the Hydra code. A gas particle is marked as star-forming in this prescription when its temperature is less than a threshold value of about , its density is above a threshold value of about , and these thresholds are not re-crossed during a time of about . The latter condition is a computationally cheap way of insuring that the cold, dense region is likely bound. The small value of the density threshold is a symptom of the modest particle resolution; regions that are much denser are rarely resolved, but we assume they exist within the densest regions.
Once the heating is initiated it is maintained for , and the particle internal energy is increased by 10% in each timestep (typically about ) until a maximum temperature of about is reached. This corresponds to an energy input of per star-forming particle. (This feedback formulation is discussed in more detail, and compared to others Smith, 2001.)
If we assume that a typical supernova injects about into the gas, then about 1100 SN are needed to generate this feedback energy. If we assume that the mass of a typical SN is about , and adopt a Salpeter mass function over a range of , then about 10% of the stars are SN progenitors, and we need to form a star cluster of mass to obtain the needed energy. This is about 2% of the gas particle mass. Gas consumption is not included in these models, or equivalently we assume instant replenishment of the (small) losses.
These energy estimates do not include losses due to cooling (until the heating is terminated). However, the feedback heating should not be directly equated to thermal energy. It is also an algorithm for inducing increased kinetic energy and mass motions via local pressure effects, which begin at a ”sub-grid” scale. Once the heating is turned off, the affected particles can cool rapidly due to both adiabatic expansion and radiative cooling. The net pressure generated by the feedback, and its affects on surrounding particles seem generally realistic, even if the thermal details are unresolved. In the future, these details must be resolved to determine quantities like the mass fractions and scale heights of different thermal phases.
The first result is that with sufficient gas supply, and reasonable feedback parameter values, the models are intrinsically bursty at a moderate level, see Figure 1. The initial model was allowed to relax with an adiabatic equation of state plus cooling, but without feedback. The feedback was turned on at the start of these runs, which resulted in some large amplitude bursts. After that the models settled down to a more ”steady, bursty” character with the following characteristic properties. 1) The largest bursts are roughly periodic, with a period of a bit less than 100 Myr. This period is much longer than the time delays of the feedback model. 2) The amplitude of the largest bursts varies substantially. The horizontal line in the figure serves as a useful guide. The case shown by the dashed curve has about an equal number of burst peaks above this line and just below it. The case shown by the solid curve has bursts that peak significantly below the line for most of a Gyr, then several bursts that peak above it, including the double burst between the vertical lines. 3) The burst durations are typically about 10 Myr (like the feedback time delay), but double or multiple echo bursts are not uncommon.
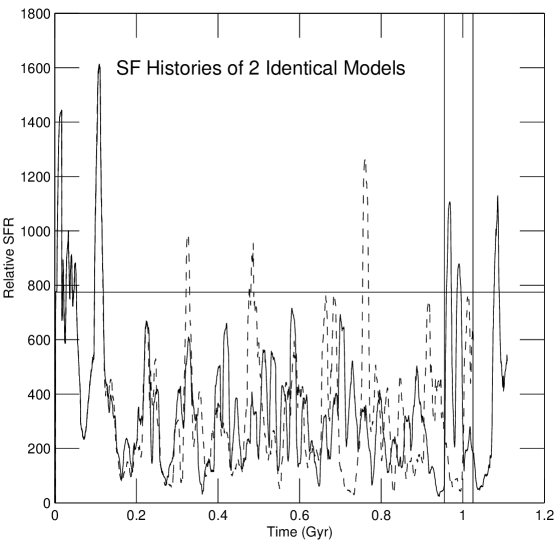
I have analyzed the bursts that peak above the horizontal line, but excluding the initial transients, in more detail. Adopting the star formation (SF) mass per particle and IMF described above, the stellar mass produced in these bursts ranges from , with a mean of . The corresponding SFR ranges from . These seem to be fairly reasonable values for an isolated core starburst in a late-type, and so support the parameter values used in the feedback algorithm. However, a number of questions remain.
What determines the burst period? The burst period is slightly less than twice the free-fall time of a particle at 2-3 kpc above the disk plane, or the time for a boosted gas particle to travel to the top of its trajectory and return to the plane, as observed in the models.
Why do the burst peaks vary so much? Viewed from above, the nuclear disk gas is usually found to be concentrated in flocculent spirals, and transient, rather irregular bars. After a starburst large bubbles and voids often appear, and the spirals and bars are disrupted or rearranged. A great deal of turbulence is generated. The next burst is more likely to be of large amplitude if these waves reform symmetrically and transfer a relatively large amount of gas to the center. More frequently, these waves develop asymmetrically, and an off-center gas concentration triggers a SF hot spot prematurely. This often leads to some propagating SF, but destroys the chance for a large burst. In the case, shown by the solid curve in Fig. 1, successive “fizzles” extend the time between large bursts to nearly 1.0 Gyr.
Where’s the wind? Observations indicate that the wind mass is roughly equal to the mass of stars produced in the burst (see Strickland, 2004). The hot wind is not resolved in these models. The models do suggest that the SF that generates it occurs in patchy concentrations. Thus, the wind is probably a sum of local gusts. This seems in accord with recent observations of M82 and Arp 284 presented at this meeting and observations of other starburst galaxies.
What about all the gas boosted out of the plane? First of all, there is observational evidence indicating that substantial masses of gas are kicked out over kpc distances by bursts. This evidence includes large HI scale heights in M82 and NGC 2403 (Fraternali et al. 2004), extended dust distributions in edge-on galaxies like NGC 891 (Howk & Savage 2000), evidence that molecular clouds are broken down but not destroyed in starburst regions (Gao & Solomon, 2004), and the small filling factor of the hot gas in wind galaxies (Strickland, 2004). The high latitude gas in the models has a wide range of thermal phases.
In sum, the simulations suggest a mosaic model for core starbursts, with the following properties. 1) Star clusters form in the densest regions, create hot spots, which may eventually break out as wind gusts. 2) Hot spots also drive turbulence over a wider area, and can propagate the SF. 3) Eventually, central regions become so turbulently stirred, shredded and puffed up that SF crashes. 4) If not too much gas is consumed or blow out, clouds reform and generate recurrent bursts. The models suggest that starbursts are naturally recurrent. We have not yet undertaken models of bursts driven by rapid mass transfer or merging, but it seems likely that they can overcome the fizzle-effect and drive large burst amplitudes.
References
- [1] Couchman, H., Thomas, P., & Pearce, F. 1995, ApJ, 452, 797
- [2] Fraternali, F., Oosterloo, T., & Sancisi, R. 2004, A&A, 424, 485
- [3] Gao, Y., & Solomon, P. M. 2004, ApJ, 606, 271
- [4] Howk, J. C., & Savage, B. D. 2000, AJ, 119, 644 Leitherer, C. 2001, in Astrophysical Ages and Timescales, ASP Conf. Series 245, eds. T. von Hippel, C. Simpson, & N. Manset, San Francisco: ASP
- [5] Smith, D. C. 2001, Ph.D. thesis, Iowa State
- [6] Strickland, D. K. 2004, in The Interplay among Black Holes, Stars, and the ISM in Galactic Nuclei, Proceedings I.A.U. Symp. 222, eds. L. C. Ho & H. R. Schmitt, San Francisco: ASP.
- [7] Sutherland, R. S., & Dopita, M. A., 1993, ApJS, 88, 253 \chapappendixSupporting Figures and Text (for CD-ROM) In this appendix I describe two figures that illustrate the effects of a starburst on the central disk hydrodynamics. The first figure (A.1) shows face-on views of the central disk (20 x 20 kpc frames) at 6 times within the range indicated by vertical lines in Figure 1. The model used was the one corresponding to the solid curve in Figure 1, and which has a double burst during this period. Figure A.1 also shows gas particles that are currently experiencing heating from young stars as described above. These star-forming particles are marked by green plus signs. The two SF burst peaks occur near the times shown in the second and fourth frames of Figure A.1. The figure shows that the first burst is very concentrated in the disk center, while the second burst is concentrated in a spiral on one side of the center. Flocculent spirals are common, as are large holes in the gas distribution away from the center. At other times, or in other models, transient bar-like structures can also be seen.
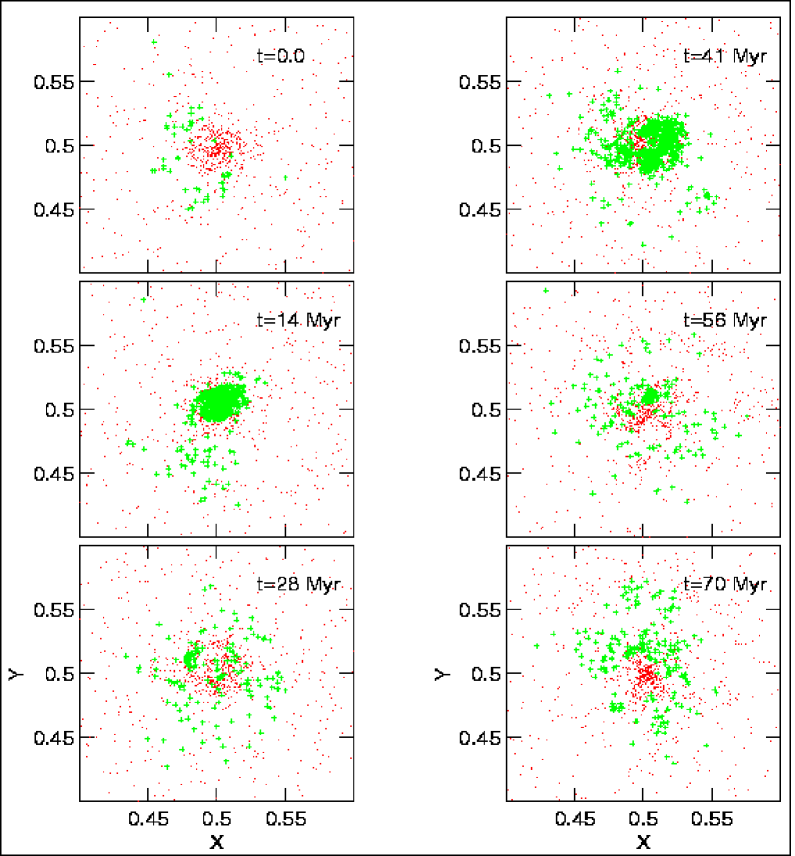
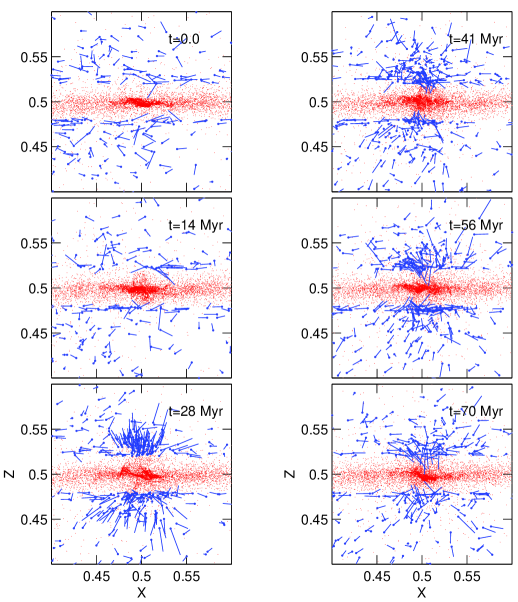
Figure A.2 shows views orthogonal to the disk plane (x-z) at the same six times, and on the same length scale. The inflation of the central gas disk by the starbursts can be seen in this sequence. I also show velocity vectors of selected particles as described in the figure caption.
Before the onset of the double burst the central disk had experienced a period of unusually low SF. This is illustrated by the relatively small number of gas particles at any significant distance from the disk plane in the first two frames of Figure A.2.
By the time of the third frame the initial core burst has ended, but large numbers of gas particles are moving away from the plane with high velocities. Despite the second burst the coherent outward motion seems to stall by the time of the fourth and fifth frames, and infall dominates the sixth frame.
The ineffectiveness of the second burst my be partly due to the fact that it is off-center, and can dump some of its energy to nearby holes or voids within the disk. Off-center or hot spot bursts are more common than central bursts in these models, and deserve much more study.