11email: ostlin@astro.su.se 22institutetext: School of Physics and Astronomy, University of Nottingham, Nottingham NG7 2RD 33institutetext: Observatoire Astronomique de Strasbourg (UMR 7550), 11, rue de l’Université, 67000 Strasbourg, France
The new infra red view of evolved stars in I Zw 18 ††thanks: Based on observations with the NASA/ESA Hubble Space Telescope, obtained at the Space Telescope Science Institute, which is operated by the association of Universities for Research in Astronomy, Inc., under NASA contract NAS5-26555.
We report results from near-infrared imaging of I Zw 18, the most metal-poor galaxy in the local universe with NICMOS on board the Hubble Space Telescope (HST). Observations were obtained in the broad F205W filter ( K) and in the medium-wide bands F171M and F180M, the latter which cover strong molecular absorption features in cool stars. The new data, together with previously obtained HST/NICMOS images in the F110W ( J) and F160W ( H) filters, provide a census of the cool stellar population in this chemically unevolved galaxy. We find that stars as old as Gyr are required to explain the observed colour-magnitude diagrams. Combining broad and medium-wide band photometry, we have classified the observed stars. The observed stellar populations, to the depth of our data, are dominated by luminous red supergiant stars. However, an intermediate-age component is also present. We have identified carbon star candidates, and show that they dominate the stellar content for intermediate mass and age. We show that low metallicity intermediate-age stars have, for a given colour, a F110W ( J-band) excess compared to local carbon stars. The carbon stars identified in I Zw 18 are the most distant (more than 10 Mpc) resolved examples yet discovered.
Key Words.:
Galaxies: dwarf – galaxies: compact – galaxies: stellar content – galaxies: individual: IZw18 – Stars: carbon1 Introduction
There has been a strong interest in blue compact galaxies ever since the pioneering study of I Zw 18 by Searle & Sargent (ss72 (1972)). The global properties of I Zw 18, i.e., extremely low nebular oxygen abundance, (Izotov and Thuan it99 (1999); just a few percent of the solar abundance), very blue colours, and a large Hi reservoir, have been interpreted as evidence that this galaxy may be genuinely young, presently forming its very first generation of stars. If its star formation history really is restricted to the last few 10 Myr, the existence of I Zw 18 demonstrates that the formation of galaxies may be continuing also at the present cosmic epoch. Speaking against the youth hypothesis is the discovery of a population of faint red stars in I Zw 18, both in the optical (Aloisi et al. aloisi (1999)) and in the near-infrared (Östlin ostlin2000 (2000)). These stars have probable ages in the range from 100 Myr to a few Gyr, and most of these are expected to be stars on the asymptotic giant branch (hereafter AGB).
The upper AGB is populated with oxygen-rich and carbon-rich stars (i.e., AGB stars with C/O ratio smaller or larger than unity by number, respectively). It has been established observationally and theoretically that carbon star formation is more efficient in low metallicity environments. The number ratio of carbon stars to M stars anti-correlates with the metallicity (Cook et al. 1986, Groenewegen groenewegen (1999), Mouhcine & Lançon 2003). I Zw 18 has the lowest ever measured ionised gas phase metallicity in a galaxy (Kunth & Östlin kunth (2000)). Thus, if there is an intermediate-age stellar population present in I Zw 18, one might expect it to be dominated by carbon stars. In the same context, the carbon-star content of I Zw 18 could provide insights into stellar evolution at low metallicity.
AGB star spectra are dominated by broad molecular absorption bands. Spectra of oxygen-rich stars are dominated by metal oxide bands such as TiO, VO, and H2O. Optical and near-IR spectra of carbon stars have little in common with those of oxygen-rich AGB stars apart from the CO absorption in K-band. They are dominated by bands of CN and the Phillips & Ballik-Ramsay C2 systems (Barnbaum et al. 1996, Joyce 1998). Because of their high luminosity and distinctive spectra, carbon stars can in principle be identified out to great distances. It has been argued that carbon stars have, in general, redder broad band colours than oxygen-rich stars. This statement is not entirely true. For AGB stars with low mass loss rate, i.e., stars with optically thin circumstellar shells, carbon stars display a wide range of colours, similar to the colour range spanned by M-stars (Alvarez et al. 2000). Due to CN and C2 absorption in the J-band, the colour distribution of carbon stars extends to redder colours than M-stars, i.e., (Loup et al. 1998). Applying a sharp cutoff to separate carbon stars from oxygen-rich stars may miss warm carbon stars, and misclassify extreme oxygen-rich optically selected or dust-enshrouded stars as carbon stars. Thus, optical/near-IR colours are insufficient, by themselves, to discriminate carbon stars from oxygen-rich stars.
A more successful strategy to find carbon stars is to make use of spectral features that uniquely identify such stars. Different indices, corresponding to different spectral features, have been proposed in the literature (Wing 1967, Aaronson et al. 1982). The NICMOS instrument on the Hubble Space Telescope (HST) has a set of medium-wide filters. One of these, F180M in the NIC2 camera, coincides with a C2 band head at m (Ballik-Ramsay series, ). Together with the adjacent continuum filter F171M, it can be used to probe the strength of the C2 band head (Alvarez et al. 2000).
In this paper, we report the results from HST/NICMOS medium-wide (F171M and F180M) and broad (F205W, K) band imaging of I Zw 18, which we use to investigate the nature of red stars and the upper AGB population. The observations and the data reductions are described in Sect. 2. In addition we use previously obtained NICMOS data in the F110W ( J) and F160W ( H) filters. In Sect. 3, we discuss the surface photometry. The nature of the red and cool stellar content of I Zw 18 identified using colour-magnitude and colour-colour diagrams is discussed in Sect. 4. Conclusions are summarised in Sect. 5.
| Filter | Total exposure time | Zero Point | |
| object | sky | ||
| (s) | (s) | ||
| F171M | 4629.47 | 3086.32 | 19.956 |
| F180M | 6172.63 | 4115.09 | 19.844 |
| F205W | 4629.47 | 3086.32 | 21.960 |
2 Observations and point source photometry
The observations were acquired using the NIC2 camera of HST/NICMOS under HST general observer programmes 7461 and 7880. For a description of the NICMOS instrument, see Thompson et al. (thompson (1997)). The observations for programme 7461 consisted of a total of 2560 s exposures in the F110W filter and 5120 s in F160W, and are described in Östlin (ostlin2000 (2000)) together with details on the reduction and data analysis.
The observations for programme 7880 were carried out during 10 orbits and are summarised in Table 1. Due to the long wavelengths of the filters, the observations were obtained by using “chopping”, i.e. separate sky frames were obtained in between each exposure on target. The observations employed the spiral-dith-chop pattern in the multiaccum mode and the exposure sampling sequence used was mif512. Hence, for each orbit, five 512-second exposures were obtained, three on the primary target and two on adjacent sky positions. In order to improve the spatial sampling and photometric accuracy, small (1.5″) offsets were made in between the individual exposures for both the target and sky positions. Some images suffered from the so called pedestal effect, which was removed using the Pedestal Estimation and Quadrant Equalization Software, developed by R.P. van der Marel.
Before combining the target images, the background was subtracted using the sky frames. Best results were obtained by first combining all sky frames to a master sky which was then subtracted. The sky-subtracted target frames were finally combined and rebinned to a finer pixel grid using the drizzle package (Fruchter & Hook, fruchter (1998)).
Point source photometry was performed using the daophot package (Stetson et al. stetson (1990)). Aperture corrections to convert our daophot magnitudes to total NICMOS magnitudes111NICMOS total magnitudes are defined as the magnitude within an 0.5″ radius aperture plus mag.; see www.stsci.edu/instruments/nicmos were determined by performing photometry of synthetic NICMOS PSFs generated with the Tiny Tim software (Krist & Hook krist (1997)).
The observations were acquired at a different spacecraft roll angle compared to programme 7461, and the astrometry of point sources for the two different programs were combined with the xy2rd task in stsdas. In matching the photometry catalogues in different filters, a tolerance of 0″.0375 was applied for the centre coordinates. Compared to Östlin (2000), we detect somewhat fewer stars due to the narrower band passes of the F171M and F180M filters, and higher background in F205W. The zero points are given in Table 1 and are in the Vegamag system. We will denote magnitudes in the different filters simply by their name, e.g. .


| Colour | Model | Filament | Blob | |
|---|---|---|---|---|
| stars | stars+gas | |||
| F110W–F160W | ||||
| F110W–F205W | ||||
| F160W–F205W | ||||
3 Extended and nebular emission
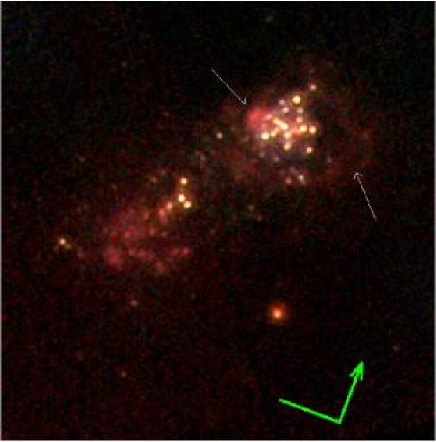
The galaxy consists of two main star-forming complexes: The bright north-west (NW) and the more diffuse south-east (SE) regions, which are embedded in a faint irregular envelope. When analysing the F205W (K) vs the F110W (J) and F160W (H) images some features become evident (see Fig. 1). To the west of the NW region there is a filament, and approximately 1″ to the east of the centre of the NW complex there is a “blob” with size . Both features are bright in the F205W filter but rather faint in both F110W and F160W. Their colours are given in Table 2.
These features, and other larger filaments have also been seen in optical H images (Dufour and Hester dufour (1990), Hunter and Thronson hunter (1995), Östlin et al. ostlin1996 (1996), Cannon et al. cannon (2002)). The filament corresponds to the regions NW D4 and NW D5 in the nomenclature of Cannon et al. (cannon (2002)), and the blob to NW 1, all of which have very small reddening.
The effect of nebular emission on the NICMOS colours has been computed for a stellar population including nebular emission using the models of Zackrisson et al. (2001). The realistic treatment of the nebular emission and the use of the HST+NIC2 throughput curves make these models suitable for our current purposes (see Östlin et al. 2003). We assumed a Salpeter initial mass function with mass range 0.08 to 120 , , , a hydrogen density of 100 cm-3, a filling factor of 0.1 and a gas covering factor of unity. Since the near-IR spectrum is completely dominated by nebular emission (line and continuum) for ages less than a few Myr (see e.g. Bergvall & Östlin 2002) the composite stellar+gaseous spectrum is a good approximation to a pure nebular spectrum. The model colours with and without gas emission for an age of Myr and constant star formation rate are given in Table 2. Given the photometric uncertainties, the colours of the filament and the blob are consistent with pure nebular emission. The high H surface brightness suggest that the blob is ionised from inside by a cluster of young stars, or alternatively could be a supernova remnant. The effects of nebular emission on the colours for I Zw 18 have also been discussed in Izotov et al. (2001), Papaderos et. al. (2002) and Hunt et al. (2003).
The possible contamination of point source photometry by patchy nebular emission has been assessed by comparing the spatial locations of our stars with the H maps in Cannon et al. (cannon (2002)). None of our carbon star candidates (see Sect. 4) with available F171M and F180M photometry are located near H sources or regions with high H equivalent width. Of the AGB star candidates without F171M and F180M photometry that are classified solely based on the F110W, F160W and F205W colours, about five are located near, but not coincident with, H sources in the SE complex. Hence, we do not expect our point source photometry to be contaminated by nebular emission. As discussed in Sect. 4.1, if contamination by nebular emission was an issue, the effect would be that the intermediate-age population would be older than it now appears. Moreover, nebular gas with the metallicity of I Zw 18 has medium wide band colours , and , incompatible with the colours of our carbon star candidates that we discuss below.
As described in Sect. 4, carbon star candidates in I Zw 18 are characterised by their location in the F171M–F160W vs F180M–F171M colour–colour diagram. To test whether we could see any evidence for carbon stars with luminosity below our limiting magnitude for PSF photometry, we investigated the distribution of individual pixels in these colours. This was done after binning the image to the original pixel scale of NIC2 (0.075″) and applying a lower flux limit of magnitudes per binned pixel in F171M and F180M, in order to omit too uncertain pixels. Pixels containing stars already described by the single star PSF photometry were also omitted. In the crowded NW region, most pixels are contaminated with light from bright stars, but in the SE region we see tentative evidence for carbon stars below our point source detection limit (see Fig. 7 and Sect. 4.5).
4 Discussion: the nature of infrared-detected stars in I Zw 18
In the following subsections we will discuss the results of the resolved star photometry. By comparing with model isochrones and empirical data of evolved late type stars, we constrain the nature of of the faint red stars in I Zw 18.
4.1 Colour–magnitude diagrams and model isochrones
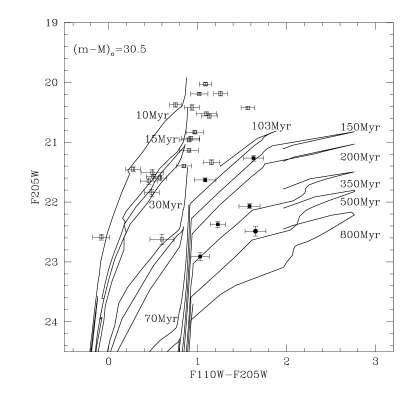
In Figure 2 we show the F205W vs. F110W–F205W, and F205W vs. F160W–F205W colour-magnitude diagrams (hereafter CMDs). Similar to what was found by Östlin (2000), the CMDs display two main features: The first feature consists of bright () stars with relatively blue colours (, ). The second feature consists of faint () stars with red colours ( and ). This suggests that the star formation history of I Zw 18 has involved two separate (in time) events or has been continuous over a longer time.
A means for interpreting the observed CMDs is provided by isochrones calculated from the stellar population models by Mouhcine (2002) and Mouhcine & Lançon (2002), which include the evolution of stars through the upper AGB phase. The theoretical predictions of these stellar population models have been extensively and successfully compared to a variety of observational constraints. In order to constrain the stellar content of I Zw 18, a set of isochrones with a metallicity of were calculated. For a detailed discussion of the models, their ingredients and limitations, the reader is referred to the papers cited above. An advantage of these models is the inclusion of carbon stars in a self-consistent manner, accounting for the dependence of mass loss and the sensitivity of carbon star formation to the stellar mass and abundance. This is of crucial relevance here as our aim is to identify carbon star candidates. To transform the theoretical luminosity–effective temperature diagram to a colour–magnitude diagram, we used the library of Lançon & Mouhcine (2002) for AGB stars, and the compilation of Lejeune et al. (1998) for all other types of stars. The former library contains spectra of both oxygen-rich stars and carbon stars. The isochrones have been calculated for the HST/NICMOS photometric system, with the aid of the NIC2 throughput curves.
To compare the predicted isochrones to the observed colour-magnitude diagram, a distance to I Zw 18 is needed. This is still a matter of debate, varying according to different authors from 10 Mpc to 20 Mpc. Hereafter, we will adopt a distance modulus of for I Zw 18 (see Östlin 2000 for a discussion of the choice of this distance). Internal reddening by dust has been found to be very low (Cannon et al. cannon (2002)), and has been neglected. As a word of caution we note that even if the average dust content is low, there are regions with a locally higher extinction ( mag). These are however not spatially coincident with the sources of primary interest in this paper and moreover, the effect on the infrared colour indices under study here are marginal (for instance mag corresponds to ).
Figure 2 shows a set of isochrones, with ages noted in each panel, superposed on the observed CMDs. The isochrones show that once AGB stars appear in a stellar population, at ages older than Myr, a red tail develops in the CMD and extends to quite extreme colours. As a consequence of high carbon star formation efficiency at low metallicities, AGB stars turn into carbon stars almost immediately after they enter the red tail. The extent of the red tail, and particularly the carbon star sequence, depends on the calibration(s) used to transform the fundamental stellar properties of the AGB sub-population stellar to observed quantities. Using the stellar library of Lançon & Mouhcine (2002), the portion of isochrones with colour redder than and are occupied by carbon stars.
For a distance modulus of , the observed bright plume with its relatively blue colours, is consistent with a young stellar population in the age range 10-30 Myr, corresponding to the age of turn-off stars with masses in the range of 21-10 M⊙. The fainter end of the this plume corresponds to a slightly older population, with age Myr and a turn-off mass . To account for the faint and red sequence, stars in the age interval 100-800 Myr are required. Changing the distance to the galaxy within a reasonable range can not alleviate the need for stars older than 100 Myr. All the isochrones of stellar populations younger than a 100 Myr predict a plume of stars with colours bluer than and . To occupy regions in the CMDs with redder colours than these limits requires the presence of intermediate-age stars with turn off masses in the range 5–2 evolving through the thermally pulsating AGB phase. This suggests that I Zw 18 started forming stars at least 0.5 Gyr prior to the current star formation event. Stars that are located in the CMD regions occupied by faint and red stars are, according to the isochrones, mostly carbon stars.
A comparison with the theoretical isochrones shows that while the intermediate-age stars in I Zw 18 span a similar range in F160W–F205W to the models their F110W–F205W colours are on average bluer. This cannot be fully explained by the effect of a low initial metallicity of intermediate-age progenitors on the effective temperature, as this would make both colours bluer.
One possibility is that the colours of intermediate-age stars have been contaminated by nebular emission in the neighbourhood. The effect of adding nebular emission is to make the F110W–F160W colour appear bluer than its intrinsic value, whereas the effect is much smaller for F160W–F205W since for this colour index, nebular gas and AGB stars have similar colours. However, as discussed in Sect. 3, only a small fraction of the stars are located near H sources, and we do not believe that this could be the main mechanism, but if it was, the net effect would be to make the intermediate-age population in I Zw 18 older than it now appears.
In figure 3 we compare the near-IR colours of stars in I Zw 18, to a local sample of evolved stars from Lançon and Wood (lw (2000)). A striking feature of the intermediate-age stars in I Zw 18 is that while they span a similar range in F160W–F205W, their F110W–F160W colours are bluer compared to the local AGB star sample. (see also Fig. 5, and Sect. 4.2 for more details.). The observed difference between the stars in I Zw 18 and the local counterparts demonstrates that the low-metallicity stars with intermediate mass and age, in I Zw 18, have a F110W flux excess compared to local stars. On the other hand, young stars in I Zw 18 show bluer colours than the local sample for both colours, and their location in the F110W–F160W vs. F160W–F205W diagram is a continuation of the local oxygen-rich star sequence, reflecting the known effect of metallicity on stellar effective temperature and broad-band photometry.

4.2 Photometric properties of metal-poor stars of intermediate age and mass
A caveat when modelling the near-IR CMDs of low-metallicity stellar systems, and for the identification of carbon star candidates, is the lack of representative spectra for metal-poor evolved stars in the stellar library used to transform the fundamental stellar parameters to observed quantities. The stellar library we have used is based on spectra of nearby stars, and is by construction biased toward metallicities consistent with the chemical evolution of our own Galaxy. The observed difference in F110W–F205W colours between stars of intermediate age and mass in I Zw 18 and their local counterparts may imply that the carbon star sequence in metal-poor systems would not be tightly constrained by a direct comparison with isochrones based on stellar libraries of local stars. In a metal-poor environment carbon stars are expected to appear at higher temperature compared to a metal-rich environment, and the progenitors of carbon stars will have higher effective temperature than their counterparts in the Large Magellanic Cloud (hereafter LMC) and the Milky Way. In addition, the convective dredge-up that enriches the stellar atmosphere with carbon, is triggered earlier and is more efficient at low metallicity (see Mouhcine & Lançon 2003 for a detailed discussion of these issues). However it is not an easy task to predict the distribution of carbon star colours. For Galactic and LMC carbon stars, colours become redder as the C2 band strength, increase (Cohen et al. 1981). On the other hand, theoretical models show that the C2 band head is sensitive to the carbon-to-oxygen ratio (Gautshy-Loidl 2001). Synthetic evolutionary models for AGB stars predict that the final carbon-to-oxygen ratio increases as the initial stellar metallicity decreases (Mouhcine & Lançon 2002, Marigo et al. 2002). Observationally, Matsuura et al. (2002) have shown that the equivalent widths of molecular absorption bands are systematically larger for carbon stars in the LMC than for carbon stars in the solar neighbourhood. They argue that the carbon-to-oxygen ratio is systematically larger in LMC carbon stars. The extent of line blanketing, responsible for the distinction between carbon stars and oxygen-rich stars, is related to the amount of carbon in the atmosphere. Thus, even if the progenitors of carbon stars are hotter at low metallicities, their spectrophotometric properties might be unaffected by the lower metallicity as long as the opacity in the atmosphere is dominated by molecules based on carbon and other elements whose abundances are not drastically affected by the low initial metallicity.
Red F110W–F160W colours of local carbon stars are due to the effect of molecular blanketing, i.e., CN and C2 absorption bands. Atmospheric carbon abundance is larger at low metallicity, which may enhance the C2 and CN absorption bands. On the other hand, as a consequence of the extremely low abundance of nitrogen in I Zw 18 (, in solar units, Izotov and Thuan 1999), the abundance of molecules that contain nitrogen may be lower in the atmosphere of AGB stars in I Zw 18 than in their local counterparts, lowering the CN-dominated opacity in F110W filter, but increasing the opacity in both the F160W and F205W filter wavelength intervals, where C2 dominates. This could give rise to the observed blue F110W–F160W and F110W–F205W colours.
The occurrence of hot bottom burning in massive AGB stars, which convert a fraction of the newly dredged-up carbon into nitrogen via the CNO cycle, affects the abundance of both carbon and nitrogen in the atmosphere of such stars. It would be hard to derive any meaningful constraints on the properties of the hot bottom burning at low metallicity on the basis of the small number of stars in our sample. Deeper observations of I Zw 18, and/or other low-metallicity systems, as well as detailed modelling of AGB stars, are needed to address this question.
These findings illustrate that I Zw 18 constitutes an important laboratory for understanding stellar physics and evolution at low metallicity. This is not only true for AGB stars – the discovery of Wolf-Rayet features in I Zw 18 a few years ago came as a surprise in view of the very low metallicity (Izotov et al. izotov1997 (1997), Legrand et al.legrand (1997), Brown et al. brown (2002)).


4.3 Carbon star classification through medium-wide band photometry
An alternative empirical approach to determine the nature of intermediate-age stars is to compare equivalent data for stars with known classification. In this subsection we try to classify the stars in I Zw 18 by comparing their photometric properties to those of a local sample from Lançon & Wood (2000) that includes AGB stars (both oxygen-rich stars and carbon stars), red giants, and supergiants.
The F180M–F171M index is a measure of the C2 band strength for carbon stars or the H2O band strength for oxygen rich stars. It is able to separate between evolved AGB stars and other types of evolved stars, but it cannot separate the two sub-populations of AGB stars (Alvarez et al. 2000). Fortunately, combining this index with other information can do a good job in separating both AGB sub-populations. Indeed, local carbon stars split from the rest of the local sample in the F180M–F171M vs. F171M–F160W diagram. The F171M–F160W index measures the slope of the spectrum between the centre and the edge of the F160W filter. It has a numerically larger for oxygen-rich stars than for carbon stars as a consequence of the presence of broad H2O absorption band, while for carbon stars the flux at the edge of the filter is larger than in the centre. As the spectral features of carbon stars are not strongly sensitive to stellar temperature (Lançon & Mouhcine 2002), the behaviour of carbon stars in the (F180M–F171M) vs. (F171M–F160W) diagram should in principle be independent of metallicity. To identify carbon star candidates, we consider stars that are classified as intermediate-age stars in the near-IR CMDs (Fig. 2), i.e., older than 100 Myr. Six of these have available F180M and F171M photometry.
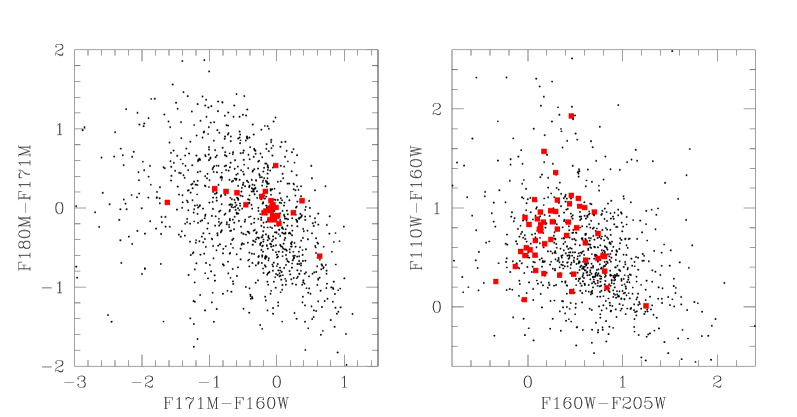
In the upper left panel of Fig. 4, filled squares show the distribution of intermediate-age I Zw 18 stars in the F180M–F171M vs. F171M–F160W diagram, compared to the Lançon & Wood (2000) local sample, where triangles show carbon stars, and circles show all other oxygen rich stellar types, i.e. giants, supergiants, and oxygen-rich AGB stars. As the diagram shows, the combination of F180M–F171M and F171M–F160W indices can efficiently separate spectroscopically identified oxygen-rich and carbon stars, as the carbon stars have systematically smaller F171M–F160W at a given F180M–F171M. The six intermediate-age stars in I Zw 18 fall into two groups in this diagram: Five stars, generally with positive F180M–F171M index, fall close to, or to the left of, the local carbon stars. Only one intermediate-age star in I Zw 18 falls close to the location occupied by local supergiant and oxygen-rich AGB stars. The other I Zw 18 stars in this region have too blue broad band colours and/or are too bright to be classified as intermediate-age stars, although there are two borderline cases. Bright stars with tend to have , while fainter stars span a larger range in F171W–F160W. There seems to be a anti-correlation between the F180M–F171M and F171M–F160W indices for intermediate-age I Zw 18 stars: the former index gets stronger on average as the latter index get weaker, and the same trend is seen for local/LMC carbon stars. Hence, according to the upper left panel of Fig. 4, the stars in I Zw 18 that are located in the region occupied by local carbon stars are likely carbon stars. The single intermediate-age star located close to oxygen-rich stars is likely an oxygen-rich AGB star. Below, we use additional diagnostic diagrams to confirm this classification. Note that, as discussed in Sect. 3, this classification is completely insensitive to any possible contamination of nebular emission.
The upper right panel of Figure 4 shows the F180M–F171M vs. F110W–F205W diagram for stars in I Zw 18. The figure shows again the dichotomy between intermediate-age/mass stars and young/massive stars. For stars redder than , intermediate-mass stars tend to have positive F180M–F171M index, while supergiant stars have in average negative F180M–F171M index. Only two supergiants (with ) have a positive F180M–F171M index, including the most luminous star in the sample, and of all the young stars, only 6 out of 22 have . The figure shows also the inability of the F180M–F171M index alone, to separate between oxygen-rich and carbon stars. The 180M–171M index, as expected for intermediate-mass stars, gets stronger on average as the stars get fainter as shown in the bottom left panel of Fig. 4.
In the bottom right panel of Fig. 4, we show that carbon star candidates tend to have redder F160W–F205W colour at a given F110W–F160W colour, similar to what is seen for LMC/Galactic carbon stars (Fig. 3). In principle, nebular contamination would give a similar behaviour, but this explanation is unlikely since the stars with the most deviant colours are the carbon star candidates which are not located near any H sources. This rather supports the molecular blanketing interpretation, as opposed to a simple effective temperature effect. Other stars that show slightly redder F160W–F205W colours at a given F110W–F160W, but not classified as carbon stars, are too blue and/or too luminous to be intermediate-mass stars. Fig. 5 shows the same CMDs as in Fig. 2, but restricted to stars that have been detected in medium-wide filters. It is clear that almost all stars older than Myr are carbon stars. This is consistent with the theoretical models that predict that carbon stars dominate intermediate-age stellar populations at low metallicities.
We have shown that the F171M–F160W vs. F180M–F171M diagram can separate probable carbon stars from other late type stars. If we relax the requirement of having photometry in both the F171M and F180M filters, and look also at stars accurately detected in F171M only, the sample is increased with four more stars. Two of these are faint and blue and most probably young stars, whereas two have broad band photometry consistent with intermediate-age stars. The two latter stars have F171M–F160W and , hence most consistent with local O-rich stars. However, without F180M–F171M photometry, this classification becomes tentative. Whereas our five carbon star candidates separate well from the rest of the stars in a F171M–F160W vs. F160W–F205W diagram this is not true for carbon stars in general as can be understood from the upper left of Fig. 4.
4.4 Spatial location of stars in I Zw 18
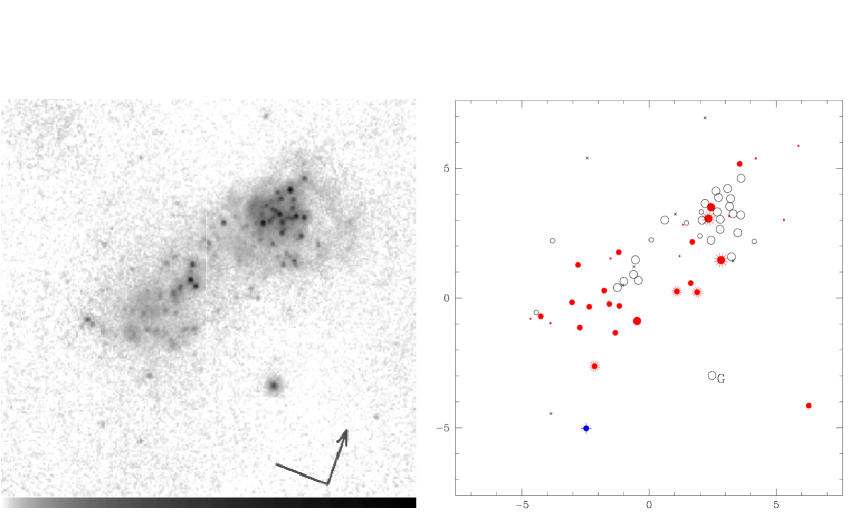
The spatial location of both young supergiant stars and intermediate-age stars are shown in Fig. 6. Open circles show young stars, and filled circles show intermediate-age stars. Carbon stars candidates and the candidate AGB oxygen-rich star are highlighted. The figure shows that luminous supergiants are concentrated to the NW and SE regions, where the star formation is active, while AGB stars are more uniformly distributed.
4.5 Pixel photometry of unresolved stars
As described in Sect. 3 we have analysed the colours of individual pixels in the SE region. The result for a 30 arcsec2 area is shown in Fig. 7 (noisy pixels and pixels contaminated by detected stars have been excluded, for details see Sect. 3), together with the photometry of the stars discussed above. The region is approximately quadratic with a centre at in the coordinate system of Fig. 6.
We have seen that the F171M–F160W vs F180M–F171M colour-colour diagram is an efficient tool for discriminating carbon stars and other class of objects. Pixels that occupy the location of spectroscopically identified carbon stars in this diagram are then considered to be dominated by carbon stars. Figure 7 shows that individual pixels have a broad range of colours indicating that the unresolved stellar population contains both young and intermediate-age stars. Interestingly, the carbon star region (see upper left of Fig. 4) is well populated. The integrated colours for pixels in the carbon star region are F171M–F160W and F180M–F171M, and have a total F160W magnitude of . For single stars detected in all 5 passbands, the limiting magnitude is F160W meaning that the unresolved pixels could correspond to, on the order of 10 carbon stars with F160W, or .
Taking the area of I Zw 18 to be (the angular size at mag/arcsec2, Papaderos et al. papaderos (2002)), the surface density of detected carbon stars in I Zw 18 as a whole is per kpc2. The SE region has an area which is of the total assumed area and contains one of the 5 identified carbon stars. If the SE region is assumed to be representative for the total AGB population of I Zw 18, the pixel photometry of this region suggests that the surface density may be on the order of 100 per kpc2, and the total number of carbon stars on the order of 50, but of course this sensitively depends on the assumed luminosity function of carbon stars. This would mean that I Zw 18 has a carbon star surface density rather typical for faint metal-poor dwarf galaxies (see Groenewegen groenewegen (1999)). The absolute magnitude of I Zw 18 is , but this is boosted by the presence of many young stars. Assuming that the average metallicity of I Zw 18 stellar content is similar to its gas phase metallicity, i.e., , I Zw 18 falls on the correlations of the total number of carbon stars against galaxy luminosity, and the normalised number of carbon stars to galaxy luminosity against galaxy metallicity respectively, as defined by Local Group galaxies (Groenewegen groenewegen (1999)). Consequently carbon star content of I Zw 18 appears to be similar to these observed for metal-poor Local Group dwarf galaxies. Given the significant difference between the luminosity-weighted ages of the Local Group dwarf galaxies and I Zw 18, this may indicate that the scaling correlations that regulate the properties of carbon star content in galaxies could be metallicity rather than age.
5 Conclusions
We have presented new broad and medium-wide band HST/NICMOS imaging of the very metal-poor blue compact galaxy I Zw 18. The data indicate that an intermediate-age stellar component is indeed present, and that the galaxy was not formed during the last 100 Myr. We emphasise the usefulness of combined broad- and medium-wide band near-IR photometry for detecting and identifying evolved intermediate-age stars whose energy distribution peak in the near-IR.
Based on comparison with isochrones and on empirical matching of stars in I Zw 18 to morphological features of known stellar populations in different diagnostic diagrams we have identified carbon star candidates. Out of the stars classified as intermediate-age through F110W (J), F160W (H), and F205W (K) photometry, six have available medium-wide band photometry in the F171M and F180M filters, and five of these are probable carbon stars. This suggests that the bright AGB star population in I Zw 18 is dominated by carbon stars. At a distance of more than 10 Mpc, these are the most distant resolved carbon stars discovered as yet. Investigating the broad and medium-wide band photometry for pixels in the south-east region we find support for more carbon stars lurking behind the single star detection threshold.
We find that intermediate-age stars in I Zw 18 show relatively blue F110W–F160W colours compared to local AGB stars. The opacity source in AGB stars for the wavelength region covered by the F110W filter is dominated by the CN molecule, and we speculate that the blue colours may be due to the very low nitrogen abundance in I Zw 18.
Acknowledgements.
We are indebted to A. Lançon for very useful and enlightening discussions, and to E. Zackrisson and N. Bergvall for computing a model with nebular emission for IZw18 and adopting it to the HST/NICMOS filter system. H. Olofsson is thanked for comments on a draft manuscript, and G. Olofsson and K. Eriksson for useful discussions. Thanks also to S. Nasoudi-Shoar for some practical assistance, and to R. Cumming for help with improving the language. Finally, the referee is thanked for a thorough report with many useful suggestions. In this paper, we have made use of the Pedestal Estimation and Quadrant Equalization Software developed by Roeland P. van der Marel. This work was supported by the Swedish Research Council and the Swedish National Space Board.References
- (1) Aaronson, M., Liebert, J., Stocke, J., 1982, ApJ, 254, 507
- (2) Aloisi, A., Tosi, M., & Greggio, L. 1999, AJ 118, 302
- (3) Alvarez, R., Lançon, A., Plez, B., Wood, P.R., 2000, A&A, 353, 322
- (4) Barnbaum, C., Stone, R.P.S., Keenan, P.C., 1996, ApJS, 105, 419
- (5) Brown T.M., Heap S.R., Hubeny I., Lanz T., Lindler D., ApJ 579, L75
- (6) Cannon J.M., Skillman E.D., Garnett D.R., Dufour R.J., 2002, ApJ 565, 931
- (7) Cohen, J.G., Persson, S.E., Elias, J.H., Frogel, J.A., 1981, ApJ, 249, 481
- (8) Cook, K.H., Aaronson, M, Norris, J., 1986, 305, 634
- (9) Dufour R.J., Hester J.J., ApJ 350, 149
- (10) Fruchter, A.S., & Hook, R.N. 2002, PASP, 114, 144
- (11) Gautschy-Loidl R., 2001, Ph.D. Thesis, University of Vienna, Austria
- (12) Groenewegen M.A.T., 1999, in “Asymptotic Giant Branch Stars”, Eds. Le Bertre T., Lèbre, and Waelkens C., IAU symposium No. 191, p. 535
- (13) Hunt L.K., Thuan T.X., Izotov Y.I., 2003 ApJ 588, 281
- (14) Hunter D.A., Thronson H.A. Jr., 1995 ApJ 452, 238
- (15) Izotov Y.I., Thuan T.X., 1999, ApJ 511, 639
- (16) Izotov Y.I., Foltz C.B., Green R.F., Guseva N.G., Thuan T.X., 1997, ApJ 487, L37
- (17) Izotov Y.I., Chaffee F.H., Foltz C.B., Thuan T.X., Green R.F., Papaderos P., Fricke K.J., Guseva N.G., 2001, ApJ 560, 222
- (18) Joyce, R.R., 1998, AJ, 115, 2059
- (19) Krist, J., & Hook, R. 1997, the Tiny Tim users guide v4.4
- (20) Kunth D., Östlin G., 2000, A&ARev 10, 1
- (21) Lançon, A., Wood, P., 2000, A&AS 146, 217
- (22) Lançon, A., Mouhcine, M., 2002, A&A, 393, 167
- (23) Legrand F., Kunth D., Roy J.-R., Mas-Hesse J.M., Walsh J.R., 1997, A&A 362, L17
- (24) Lejeune, T., Cuisinier, F., Buser, R., 1998, 1998, A&AS, 130, 65
- (25) Loup, C., Duc P.A., Fouqué P., Bertin E., Epchtein N., 1998, In: N. Epchtein (ed.) The Impact of Near-Infrared Surveys on Galactic and Extragalactic Astronomy, Kluwer, Dordrecht, p. 115
- (26) Marigo, P., Girardi, L., Chiosi, C., 2002, A&A,
- (27) Matsuura, M., Zijlstra, A.A., van Loon, J.Th., Yamamura, I., Markwick, A.J., Woods, P.M., Waters, L.B.F.M., 2002, ApJ, 580L, 133
- (28) Mouhcine M., Lançon A., 2002, A&A, 393, 149
- (29) Mouhcine M., 2002, A&A, 394, 125
- (30) Mouhcine M., Lançon A., 2003, MNRAS, 338, 572
- (31) Östlin G., Bergvall N., Rönnback J., 1996, in “The interplay between massive star formation, the ISM and galaxy evolution”, Eds. Kunth D., Guiderdoni B., Heydari-Malayeri M., Thuan T.X., Edition Frontieres, Gif-sur-Yvette, p. 605
- (32) Östlin G., 2000, ApJ 535, L99
- (33) Östlin G., Zackrisson, E., Bergvall, Rönnback A&A 408, 887
- (34) Papaderos P., Izotov Y.I., Thuan T.X., Noeske K.G., Fricke K.J., Guseva N.G., Green R.F., 2002, A&A 393, 461
- (35) Searle, L., Sargent, W.L.W., 1972, ApJ, 173, 25
- (36) Stetson, P.B., Davis, L.E., & Crabtree, D.R. 1990, in ASP Conf. Ser. 8, CCDs in Astronomy, ed. G.H. Jacoby (San Francisco: ASP), 289
- (37) Thompson, R.I., Rieke, M., Schneider, G., Hines, D.C., & Corbin, M.R. 1998, ApJ 492, L95
- (38) Wing R.F., 1967, PhD Thesis, University of California, Berkeley
- (39) Zackrisson, E., Bergvall, N., Olofsson, K., & Siebert, A. 2001, A&A 375, 814