Present address: ]Center for Gravitational Wave Physics, Pennsylvania State University, University Park, PA 16802.
Search for Correlated High Energy Cosmic Ray Events with CHICOS
Abstract
We present the results of a search for time correlations in high energy cosmic ray data (primary eV) collected by the California HIgh school Cosmic ray ObServatory (CHICOS) array. Data from 60 detector sites spread over an area of 400 km2 were studied for evidence of isolated events separated by more than 1 km with coincidence times ranging from 1 sec up to 1 second. The results are consistent with the absence of excess coincidences except for a excess observed for coincidence times less than 10 sec. We report upper limits for the coincidence probability as a function of coincidence time.
pacs:
96.40.-z, 96.40.Pq, 98.70.SaThe spectrum of cosmic rays above eV has been studied up to energies of eV by observing the large extensive air showers created by the primary incident particles nagano . Below eV there have been direct measurements via instruments flown in satellites or as balloon payloads direct . The energy spectrum falls steeply with a power law for energies up to the “knee” at eV, and even more steeply, , beyond the knee. Shock acceleration in supernovae provides a successful explanation up to the knee, while the source of particles beyond the knee region is speculative. Above eV, extra-galactic protons should interact with the cosmic microwave background (CMB) and thereby lose energy, resulting in a sharp decrease in the number of cosmic rays with energies above the Greisen-Zatsepin-Kuzmin (GZK) limit of eV greisen . Experimental data regarding the existence of the GZK cutoff are inconclusive at this point AGASA ; HiRes .
Correlations between cosmic rays would indicate that the particles have some common history. Such correlations could provide information about the source of the cosmic rays, the number or distribution of sources, or about the propagation of cosmic rays. For example, a recent study of ultra-high energy cosmic rays by AGASA agasaclustering indicates clustering of the directions of origin in the sky.
This paper addresses the possibility that isolated cosmic ray events separated by km arrive in time coincidence. Such correlated cosmic ray events could result, for example, from the photodisintegration of heavy nuclei (i.e., iron) by solar photons photodisintegration . A previous study, carrelmartin , indicated episodic evidence for time correlations up to s in events separated by km. A more recent search for correlated events LAAS at large distance scales, km, found a few candidate events but these were consistent with interpretation as accidental coincidences between uncorrelated events. We have studied 17 months of data obtained with the CHICOS array during January 2003 through July 2004 and searched for evidence of correlated air shower events separated by km with energy threshold eV. This paper reports the results of that search.
CHICOS
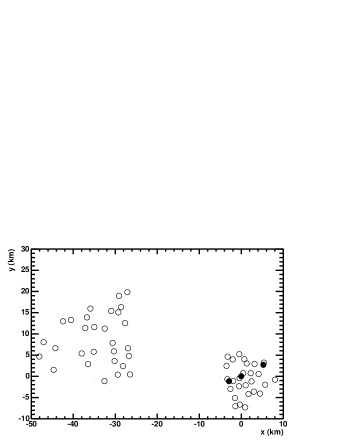
The California HIgh school Cosmic ray ObServatory (CHICOS) observes cosmic ray induced air showers with an array of detector sites located on school roofs in the Los Angeles area (Lat. , Long. , average 245 m above sea level). The sites are separated by distances of typically kilometers, with the overall array covering an area of km2. As shown in Fig. 1, the detector sites are located in two major groups in the San Gabriel and San Fernando valleys, separated by km. These 60 sites contain four pairs separated by less than 1 km, and all other pairs of sites have larger separations. During the period corresponding to the dataset reported in this paper, the number of operational sites increased from 31 to 60.
Every detector site contains two plastic scintillator detectors, separated by meters, with each detector having m2 area and cm thickness. Photomultipler signals are processed by a custom-built time-over-threshold discriminator circuit. Timing of the detector signals and the GPS receiver signals is facilitated by use of National Instruments 6602 80MHz timer/counter cards. We have verified that the GPS receiver, either Motorola UT+ or M12, provides relative timing accuracy of nsec. Pulse heights, determined from the time-over-threshold measurements, are calibrated and continuously monitored using the high flux ( Hz per detector) of incident throughgoing muons. The discriminator threshold is set at of the observed muon peak.
Data are stored on local hard disk and automatically transferred to Caltech via internet every night by the computer located at each site. “Trigger” events are defined as those where both detectors at a site record signals greater than 2 single vertical particles. Each site generates about 1000 trigger events per day. These “trigger” events and all “match” hits (single-detector hits within sec of any trigger elsewhere in the array) are transferred to Caltech. Shower-building software on our server then analyzes these data every morning and constructs files of built showers for further analysis.
Extensive air showers generate coincidences among several sites. However, the core of the air shower that will generate trigger events is generally much smaller than the spacing between CHICOS sites. Therefore, a typical air shower event involves one trigger with “match” events at the neighboring sites. The trigger events are used to locate the cores of potential air showers, where the particle density is relatively high. Showers that trigger one site with matching hits at several neighboring sites must have extremely high energies of eV. We do observe such large air shower events with the CHICOS array, presently at a rate of about one per month. The arrival times and intensities of detector signals provide the information necessary to reconstruct the incident direction and energy of the primary particle that created the air shower.
Most trigger events are isolated single events (i.e., no nearby matches) which are generated by much more frequent lower energy showers with a threshold of about eV. The rate of these triggers is comparable to expectations based on the previously measured flux nagano and computer simulations of air showers with the AIRES code AIRES . In this paper we study double trigger events where two sites separated by more than 1 km both record trigger events within a certain coincidence time.
In a separate study, we deployed 4 additional sites (not shown in Fig. 1) separated by m on the Caltech campus to provide us with a more abundant sample ( per day) of lower energy showers in the range eV. These data give us confidence that the CHICOS equipment functions as expected, exhibiting the correlated data that should result from air showers. In particular, the shower properties can be reconstructed and the events are well described by single air showers. These data are under analysis and will be reported in a future publication. We note that in this dataset, double triggers are not uncommon features of larger air showers with a core size capable of generating triggers at two sites separated by m. The rate of these double triggers falls steeply with distance between sites, and is well described by AIRES simulations. In this paper we are studying the possibility of double triggers at sites separated by km, so data from these additional 4 sites on the Caltech campus are not used in the analysis in this paper.
Correlation Analysis
The main focus of this analysis has been the trigger data sequence, which forms a complete record of all the events detected by the array with sufficient energy to trigger a single site. In order to examine these data for time correlations, a randomized data set was constructed directly from the real data, as in carrelmartin , by offsetting the sequence of triggers at each site by some integer number of seconds relative to the other sites. Since a shift of several seconds is small compared to the time for drift in the average trigger rate, the randomized data should reproduce all aspects of the real data associated with accidental coincidences. Deviations of correlations observed in the real data relative to the randomized data could be indications of real correlations (i.e., not accidental) in the data.
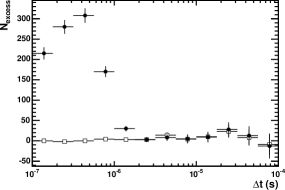
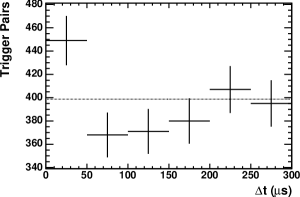
During the 17 month period, trigger events were selected (according to criteria described below) and analyzed for time correlations. The distribution of time differences between consecutive triggers falls exponentially as expected, but does not follow an exact exponential distribution due to the varying number of operating detector sites. For a coincidence time interval we count the number of consecutive trigger pairs with time separation less than and subtract the corresponding number of pairs in the randomized data to form an excess , which may be positive or negative. If both members of a successive pair are from the same site, that pair is not counted (to eliminate instrumental effects such as PMT afterpulsing). Fig. 2 shows as a function of the coincidence time . The large signal corresponding to real air showers is evident at short time intervals s. If 3 of the 60 sites are omitted (see Fig. 1), all pairs with separation 1 km or less are removed from the data set and the air shower signal disappears. In the following, we select sites so that relative distances are always greater than 1 km.
In order to search for correlations on any time scale less than 1 second, we compute the probability of an excess coincidence per site for the cumulative time interval according to
| (1) |
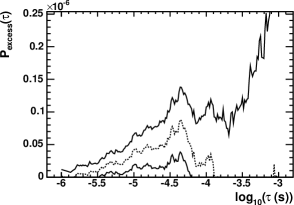
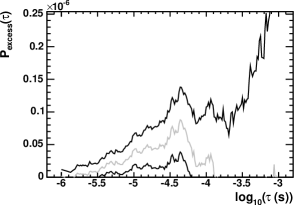
in which is the average number of operational sites and is the total number of trigger pairs. We compute a 90% confidence interval for using the method in feldmancousins , and interpret the upper limit as the 90% confidence level upper limit for the excess probability per site for the interval . The results are shown in Fig. 3.
The upper curve in Fig. 3 should grow as the , and it does increase in a fashion that is consistent with expectations. One expects that the lower 90% C.L. should behave in a symmetric manner, and remain negative or close to zero. However, Fig. 3 indicates a rather substantial excess at time scales of order s, or s. The excess heals itself at larger as we add much more data that shows (apparently) no correlations. A less significant excess is perhaps evident at s.
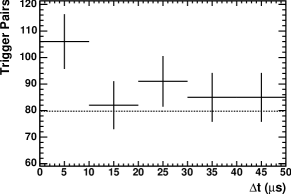
A histogram of time differences for real data is plotted along with random expectations for short time scales in Fig. 4, which indeed shows an excess in the s bin as one might expect from Fig. 3. The random data are averaged over 1 ms and plotted as a constant line to improve the statistics. The excess in the first bin is over the expectation, significant at 99.26% C.L.
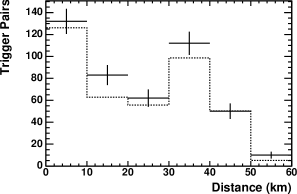
In Fig. 5 we display the data for the first bin of Fig. 4, i.e., s. Although there is a preference for shorter time differences s, no clustering at short distances is evident in the spatial distribution, indicating the excess events are likely not due to single air shower events. The excess in the first bin at s is significant at 99.70% C.L.
The excess coincident trigger events (relative to random coincidence expectation) within the s time bin appear to be distributed over distances larger than km. The average separation distance for events in the s time bin is km, compared to km for the randomized distribution. Thus the apparent excess events exhibit an average separation distance of km, consistent with . In contrast, we note that single air showers generated by primary cosmic rays near vertical incidence are much smaller, extending only over several km, and should exhibit a very steeply falling distribution in separation distance.
Since the apparent excess in our data is associated with average coincidence time and km these events would be consistent with rather vertical incidence for the primaries (or pairs of primaries). Highly inclined or horizontally incident single-shower events would imply much longer average s than indicated by the data in Fig. 4.
Finally, we note that we also attempted to find correlations of single isolated “match” events with distant trigger events. Due to the high rate of accidental “match” hits in that analysis, the results were much less sensitive and so are not reported here.
Summary and Conclusion
A search for time correlations in cosmic ray data collected by the CHICOS project has been performed. The results are generally consistent with a lack of any real correlation between isolated events, except for trigger events ( eV) with coincidence times s where an excess number of coincidences with a significance of is observed. This excess is distributed uniformly over the 17 month data period, and the events are randomly distributed over the array sites within the 400 km2 area of the CHICOS array. For smaller times s the data indicate an even more significant excess of . We know of no previous cosmic ray experiment that would be sensitive to correlated shower events at these energies separated by km. The LAAS experiment LAAS has only 8 sites at much larger distances ( km) and would have seen event given the rate we observe (assuming the correlations persist to those larger distance scales).
If the apparent excess of correlated trigger events at s is interpreted as a real signal, then we observe a coincidence probability of per site for each trigger signal. This low probability implies that observing triple coincidences is extremely unlikely. However, normalizing for the aperture of the detector arrangement at each site, one would then infer that a substantial fraction, perhaps or more, of high energy cosmic rays come in pairs or multiplets within a km2 area. However, this interpretation is strongly energy dependent, and since we have not measured the event energies this could be true over any subset of energies in the range eV.
Correlated events at km separations would probably result from rather local events, on the distance scale of the solar system. Sources at galactic distance scales (or greater) might generate correlated events over much larger distance scales, but it is extremely unlikely that particles could be reliably propagated at such short transverse distances over km. The photodisintegration of heavy nuclei (i.e., iron) by solar photons is a possibility that has been previously considered photodisintegration , but the predicted fluxes are extremely low. Based on the estimates in photodisintegration , we expect that about of the incident cosmic rays at eV will arrive as pairs within the size of the CHICOS array due to photodisintegration. These pairs would typically consist of a heavy nucleus along with a eV nucleon. The rate of these pairs within the 400 km2 area of CHICOS would be about 1 per year. The efficiency for the eV nucleon to generate a trigger at any of the 60 CHICOS sites is quite small, , so the apparent excess coincidence rate ( events per year) is about times greater than the expected rate for this process. Thus if we maintain that the correlations originate in the solar system, we probably need either anomalous interactions with the solar wind or with solar photons.
The distance distribution of excess events in Fig. 5 yields an average separation distance km, much larger than extensive air showers from single primary particles near vertical incidence. Although it seems unlikely, it may be that the excess coincidences are associated with subtle unknown properties of large air shower events. It may be possible to explore such a possibility by generating unthinned simulations with high spatial resolution ( m) of air showers over a large km2 area. Although this is a formidable computational task for present simulation programs such as AIRES AIRES , we will attempt to address this issue in the near future. Another unlikely possibility is that the generation of correlated shower events in the upper atmosphere separated by km at ground level could signal the onset of exotic new phenomena.
It is clearly desirable to obtain more data to improve the statistical precision and attempt to verify or refute this observation. We hope to continue to expand and operate the CHICOS array to obtain a larger data set over the next few years. In addition, it may be possible for the Auger observatory to search for such correlated events. Further simulation studies of the properties of extensive air showers at large distances would also be helpful in the interpretation of these data.
Acknowledgements
We are grateful for the generous support of Caltech and the Weingart Foundation in initiating the CHICOS project. The donation of the detectors by the CYGNUS collaboration is gratefully acknowledged. Support from the NSF (grants PHY-0244899 and PHY-0102502) and the donation of computers for the project by IBM Corporation are also acknowledged. The volunteer efforts of many high school and middle school teachers 111http://www.chicos.caltech.edu/collaboration/collaboration-list.html have been essential in the deployment and operation of the CHICOS array, and we are delighted to acknowledge their participation. Assistance from M. Takeda and S. Ho in generating AIRES simulations is gratefully acknowledged.
References
- (1) M. Nagano and A. Watson, Rev. Mod. Phys. 72, (2000) 698.
- (2) Y. Takahashi, et al., Nucl. Phys. B60B, (1998) 83; A. V. Apanasenko et al., Proc. 27th Int. Cosmic Ray Conf., Hamburg 5 (2001) 1622; I. P. Ivanenko et al., Proc. 23rd Int. Cosmic Rays Conf., Calgary 2 (1993) 17.
- (3) K. Greisen, Phys. Rev. Lett. 16 (1966) 748; G. T. Zatsepin and V. A. Kuz’min, Zh. Eksp. Teor. Fiz. 4, (1966) 114 [JETP Lett. 4, (1966) 78].
- (4) M. Takeda, et al., Phys. Rev. Lett. 81, 1163 (1998).
- (5) R. U. Abbasi, et al., Phys. Rev. Lett. 92, 151101 (2004).
- (6) M. Takeda et al., Astrophys. Journ. 522, (1999) 225.
- (7) G. A. Medina-Tanco and A. A. Watson, Astropart. Phys. 10, (1999) 157.
- (8) O. Carrel and M. Martin, Physics Letters B325, (1994) 526.
- (9) N. Ochi, et al., J. Phys. G.: Nucl. Part. Phys. 29 (2003) 1169.
-
(10)
AIRES Webpage:
http://www.fisica.unlp.edu.ar/auger/aires/ - (11) G. Feldman and R. Cousins, Phys. Rev. D57, (1998) 3873.