2MASS Constraints on the Local Large-Scale Structure: A Challenge to CDM?
Abstract
We investigate the large-scale structure of the local galaxy distribution using the recently completed 2 Micron All Sky Survey (2MASS) via three techniques. First, we determine the -band number counts over the 4000 deg2 APM survey area where evidence for a large-scale ‘local hole’ has previously been detected and compare them to a homogeneous prediction. Considering a CDM form for the 2-point angular correlation function, the observed deficiency represents a 5 fluctuation in the galaxy distribution. We check the model normalisation using faint -band data compiled from the literature; the normalisation used in this paper is in excellent agreement, and the observed counts over the APM survey area would require the model to be lowered by 3.8. However, the issue is complicated by the 20∘ and -20∘ 2MASS counts which lie below the best-fit model normalisation. Second, since the -band counts over the APM survey area continue to suggest the possible presence of excess clustering over the CDM prediction, we next probe the power at large scales by comparing the 2MASS and CDM mock galaxy angular power spectra. We find a excess in the 2MASS catalogue over the CDM prediction at large scales (). However, this excess is not enough to account for the low counts over the APM survey area. Finally, in order to probe more directly whether the CDM mocks can reproduce observed features in the galaxy distribution at large scales, we apply a counts in cells analysis to the 2MASS data and mock catalogues; on the assumption that the 2MASS catalogue at is representative, we find excellent agreement between the biased CDM mocks and the 2MASS catalogue to . The crux of the interpretation of these results appears to be whether the 2MASS volume is yet big enough to constitute a fair sample of the Universe. The number count models based on fainter counts suggest that it may not be, although normalisation uncertainties remain. It is also the case that the 2MASS depth remains comparable to the possible size of large-scale inhomogeneities. Analyses which assume the 2MASS average density is a fair sample, such as counts in cells and to a lesser extent, power spectral analysis, may return results which see less contradiction with CDM than the number count analysis in the APM survey area. Further progress on assessing the significance of the local hole and thus the consistency of the local galaxy distribution with CDM will require deeper all-sky number counts and redshift surveys in both the optical and the infrared.
keywords:
surveys - galaxies: photometry - cosmology: observations - large-scale structure of the Universe - infrared: galaxies1 Introduction
The counting of galaxies as a function of apparent magnitude is one of the most powerful tools in observational cosmology. Not only can this simple statistic form strong constraints on the level of evolution at the faint end, but also on the large-scale structure and the scales to which the cosmological principle can be said to hold from bright magnitude counts.
The APM galaxy survey (Maddox et al., 1990) produced number counts which are unexpectedly low for the solid angle surveyed (4000 deg2). The question then arises: To what extent are these steep counts due to real clustering in the galaxy distribution, and do errors in the photomotery or strong evolution at low redshifts contribute significantly to the observed deficiency? If the counts were exclusively due to an under-density in the Southern Galactic Cap (SGC), it would be unexpectedly large and deep for our present understanding of large-scale structure. However, to invoke galaxy evolution alone is also problematic as it requires an extended tail in the which is not apparent.
The presence of a large under-density in the SGC has been confirmed by large galaxy redshift surveys. The 2dF Galaxy Redshift Survey (2dFGRS; Colless et al., 2001) has taken spectra for galaxies brightward of 19.45 over a solid angle of 600 deg2 in the SGC. The indicates remarkable structure in the local galaxy distribution with a large deficit to 0.1. Large deficiencies in the are also indicated by other redshift surveys in the SGC (Ratcliffe et al., 1998; Shectman et al., 1996; Vettolani et al., 1997).
Possible errors in the APM photometry have also been detected. Using CCD photometry, Metcalfe et al. (1995) found a small residual scale error in the APM survey zero-points for 17. The corrected counts fainter than 17.5 were now in good agreement with the expected homogeneous trend. However, a deficit in the counts of 50 per cent at 16 remained. More recently, Busswell et al. (2004) have provided -band CCD photometry over 337 square degrees in the SGC to a limiting magnitude of =20.5. The photometric zero-point is in excellent agreement with other CCD data such as the Millennium Galaxy Catalogue (MGC; Driver, 2003) and the Sloan Digital Sky Survey (SDSS; Yasuda et al., 2001) Early Data Release. However, a comparison with the APM Bright Galaxy Catalogue suggests a large zero-point offset of 0.31 magnitudes for 17.35. Applying this correction to the bright APM photometry, Busswell et al. (2004) found that the APM survey counts now indicated a 25 per cent deficit at 16, consistent with a 25 per cent deficiency in the galaxy distribution to =0.1 over the entire APM survey area. The implied significance using several possible forms for the real-space correlation function indicated that such a large local hole in the galaxy distribution required excess power at large scales over the CDM prediction.
In conjunction with the work of Busswell et al. (2004), Frith et al. (2003) investigated the number counts in the -band from the 2 Micron All Sky Survey (2MASS) second incremental release (Jarrett et al., 2000). They found good agreement both with the optical number counts, and the expected trend defined by the 2dFGRS , suggesting that the number counts in the 2dFGRS strips are caused by real features in the galaxy distribution, and are consistent with an absence of strong, low-redshift galaxy evolution. However, due to incompleteness in the 2MASS second incremental release, a comparison with the optical APM survey counts could not be made, although the steeper than Euclidean counts over the partially surveyed galactic caps indicated the possible presence of large under-densities in both the Southern Northern Galactic Caps to 300Mpc. This was supported by mapped 2MASS counts, showing the variations of counts over the sky in 55∘ bins, and indicating huge regions of underdensity 100∘ across in both hemispheres.
Here, we probe the large-scale structure of the local galxy distribution with the recently completed 2MASS survey using three techniques. First, we compare the -band 2MASS counts over the APM survey area with model predictions. We calculate the significance with respect to these models considering a CDM form for the 2-point angular correlation function. Secondly, since the form of the local hole as suggested by Busswell et al. (2004) requires the presence of excess power at large scales over the CDM prediction, we compute the 2MASS angular power spectrum and compare with a CDM prediction constructed from the CDM Hubble Volume simulation. Finally, we investigate the local galaxy distribution more directly by using a counts in cells analysis on the 2MASS and CDM mock catalogues.
In section 2, we present details of the datasets used. In section 3, the number counts are presented. The clustering at large scales is investigated through a determination of the 2MASS and CDM mock angular power spectra in section 4. In section 5 we present the counts in cells analysis. The discussion and conclusions follow in section 6.
2 Data
2.1 The 2MASS Extended Source Catalogue
The 2 Micron All Sky Survey (2MASS) extended source catalogue has now released , and -band photometry for over 1.6106 extended sources over the entire sky with high completeness to =13.5 (Jarrett et al., 2000). Since the second incremental release, much of the photometry has been revised (Jarrett - priv. comm.) and the default aperture magnitudes used in Cole et al. (2001) have been abandoned. Cole et al. (2001) compared the second incremental release -band photometry with the -band photometry of Loveday (2000). The Loveday photometry had better signal-to-noise and resolution than the 2MASS scans and so enabled more accurate 2MASS magnitudes to be determined. Here, we use a similar magnitude estimator to that of Cole et al. (2001). We take the -band extrapolated magnitudes, colour- corrected to the -band using the and -band fiducial elliptical magnitudes; this magnitude estimator provides the best fit to the Loveday (2000) zeropoint as described in Frith et al. (2004b). An extinction correction is applied using the Schlegel et al. (1998) dust maps.
2.2 The 2dF Galaxy Redshift Survey
The 2dF Galaxy Redshift Survey (2dFGRS) is selected in the photographic -band using the APM survey and subsequent alterations and extensions to it (Colless et al., 2001) for two declination strips in the northern and southern galactic caps, as well as 99 randomly selected 2∘ fields scattered over the APM survey area. The final release data has provided spectra for 220,000 galaxies (for a quality flag of Q3) over 1500 square degrees to a mean magnitude limit of =19.45.
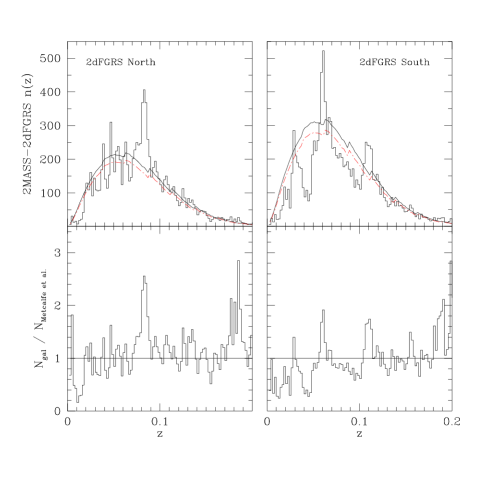
In this paper, we investigate the galaxy distribution in the -band. We have therefore formed a 2MASS-2dFGRS catalogue, matched over the Northern and Southern 2dFGRS declination strips, using the -band magnitude estimator described above. Fig. 1 shows the -band selected and radial density functions, i.e. the observed over the predicted, for the 2dFGRS declination strips with an applied limiting magnitude of =13.5.
2.3 The CDM Hubble Volume Simulation
The Hubble Volume catalogues represent the largest N-body simulations of the Universe to date. The CDM simulation follows the evolution of 109 dark matter particles from 50 over a volume of 3000Mpc3. The associated cosmological parameters are =0.3, =0.04, =0.7, =0.9 (Jenkins et al., 1998).
In this work, we construct mock 2MASS catalogues from the CDM Hubble Volume simulation. We divide the total volume into 27 virtually independent spherical volumes of Mpc. These are subjected to the 2MASS selection function:
| (1) |
(Baugh & Efstathiou, 1993; Maller et al., 2003a) where is determined from the 2MASS-2dFGRS matched sample described in section 2.2. Equation 1 is normalised to match the total number of observed 2MASS galaxies for 20∘. Due to the volume of the 27 mock 2MASS catalogues, the selection function is artificially truncated for the 13.5 mocks at 0.156. However, this has a negligible effect on the work in this paper; at this redshift, 95 per cent of the galaxies are sampled for 13.5.
For the counts in cells analysis, it is necessary to more accurately mimic the galaxy sample. We therefore use a bias prescription:
| (2) |
(Cole et al., 1998) where is a bias probability based on the density field and is the number of standard deviations of the density away from the mean. For the counts in cells analysis we use magnitude-limited data of 12.5. We use parameters of =0.6 and =-0.15 to match the 12.5 angular correlation function at small scales ( 10∘).
3 Number Counts
3.1 Model Normalisation
The issue of the local hole rests critically on the model number count normalisation. In the -band, the number count predictions for passively-evolving galaxies are in remarkable agreement with the observations to 23 (McCracken et al., 2000). The predicted number below 18 is also fairly insensitive to the evolutionary model or the assumed cosmology. Therefore, the -band number counts are a particularly useful probe of the local Universe since the model predictions can be constrained at fainter magnitudes with few concerns over uncertainties in the amount of evolution or the cosmology.
In this work, we use a non-evolving -band model computed from the luminosity function parameters of Metcalfe et al. (2001) and the -corrections of Bruzual & Charlot (1993). Comparing the number count predictions in the fitting range 1418 to the faint counts used in McCracken et al. (2000) as well as other data (Vaisanen et al., 2000; Szokoly et al., 1998; Huang et al., 1997, 2001; Kummel & Wagner, 2000; Martini, 2000; McLeod et al., 1995), we find that the Metcalfe et al. (2001) model provides a good fit to the observations with =0.960.06 (where =1 represents the Metcalfe et al. (2001) normalisation).
In order to test for the presence of strong evolution at low redshifts and zero-point offsets in the 2MASS data, we also construct model predictions for the number counts from the Metcalfe et al. (2001) homogeneous prediction described above and the observed (Frith et al., 2003). These are determined by varying the luminosity function normalisation as a function of the redshift; the luminosity function parameter is multiplied by the relative density (Fig. 1, lower panels). These variable models therefore provide a simple prediction for the number counts for a given galaxy distribution, assuming that there is no significant effect from strong galaxy evolution at low redshifts.
3.2 Results
In order to verify the consistency of bright number counts with the corresponding (Frith et al., 2003), we compare the -band number counts extracted from the 2dFGRS strips with the corresponding variable models, using the newly-completed 2dFGRS and 2MASS catalogues (Fig. 2). The -band number counts extracted from the 2dFGRS fields are in reasonable agreement with the corresponding variable models. This suggests that the form of the bright number counts is exclusively due to features in the local galaxy distribution and is consistent with an absence of strong galaxy evolution at low redshifts. The agreement between the counts and the variable models is independent of the model normalisation, since any change in the number count models also alters the model normalisation and therefore the implied deficiency to the same degree.
Having confirmed the consistency between the number counts and the underlying large-scale structure in the 2dFGRS strips, we are now in a position to examine the number counts over the APM survey area. Fig. 3 shows the -band 2MASS counts extracted for the 4000 deg2 field. We also show the 2dFGRS Southern variable model for reference.


.
There is a surprisingly good agreement between the -band counts and the 2dFGRS Southern variable model. This suggests that the local galaxy distribution in the APM survey area may be similar to that of the much smaller 2dFGRS Southern strip. This is supported by similar deficiencies observed in the Durham-UKST redshift survey (Ratcliffe et al., 1998), the Las Campanas Redshift Survey (Shectman et al., 1996) and the ESO Slice Project (Vettolani et al., 1997), which are all situated within the APM survey area, and also the optical number counts and corresponding variable models (Frith et al., 2004a, 2003; Busswell et al., 2004). The degree of under-density may therefore be inferred from the observed 2MASS-2dFGRS redshift distribution and the model normalisation. Taking the Metcalfe et al. (2001) -band model normalisation and the 2MASS-2dFGRS matched (Fig. 1) implies a 24 per cent under-density to =0.1. If we take the lower limit for the best fit -band model normalisation detailed in section 3.1, the implied under-density over the APM survey area to =0.1 is 15 per cent.
In order to see whether this structure persists to even larger scales than the APM survey area, we have determined the 2MASS -band counts over the entire 20∘ galactic caps (Fig. 3). The counts are very low with respect to the model normalisations used previously, but are in good agreement with each other. This may indicate that the normalisation of the Metcalfe et al. (2001) model should be even lower, 2.5 below the best fit to the -band counts at 1418. Alternatively, it might also indicate the presence of a zero-point offset between the 2MASS photometry and the -band model of 0.15 magnitudes; any alteration to the 2MASS zero-point would compromise the agreement between the -band 2dFGRS strip counts and the corresponding variable models, and also with the Loveday (2000) photometry zero-point with which the 2MASS magnitudes are compared. If the low counts over the galactic caps were due to real features in the galaxy distribution, this would imply that the local Universe is globally under-dense, and that even surveying over 25,000 deg2 to 150Mpc does not constitute a fair sample of the Universe.
3.3 Determining the Significance
| Model Normalisation | Deficiency | Significance | |
|---|---|---|---|
| Metcalfe et al. | 1.00 | 26.9 per cent | 5.0 |
| Best fit | 0.96 | 23.9 per cent | 4.5 |
| 1 lower limit | 0.90 | 18.8 per cent | 3.5 |
| 0.80 | 9.7 per cent | 1.8 |
Using assumed forms to the galaxy correlation function at large scales, it is possible to determine the associated significance of features in the galaxy distribution. Busswell et al. (2004) considered various forms to the real-space correlation function to calculate the significance of an assumed 3-dimensional form to the local hole. Here, we use the 2-dimensional analogue to determine the significance implied by the deficiency in the number counts with respect to various normalisations of the Metcalfe et al. (2001) model using the angular correlation function:
| (3) |
(Peebles, 1980) where is the value of the two-point angular correlation function between two area elements and . is the total solid angle of the survey, is the mean galaxy density such that is the total number of galaxies in the survey area. A power law form of the correlation function is assumed such that .
In Table 1, we apply this technique to the observed deficiency over the APM survey area in the 2MASS -band counts for 12.5 with respect to the Metcalfe et al. (2001) model, the best fit and the 1 lower limit best fit normalisations of this model described in section 3.1, and the observed mean 2MASS number count for (see Fig. 3). This magnitude limit is chosen such that the peak in the selection function lies within the redshift range of interest; at 12.5 the peaks at 0.05, and so this magnitude limit preferentially samples the mean depth of the possible local hole in the APM survey area. We consider a CDM form for the angular correlation function determined from fits to the mock 2MASS catalogues (see section 4.3).
Both the Metcalfe et al. (2001) model and the best fit normalisation appear to imply that the observed 2MASS number counts over the APM survey area represent either an extremely rare fluctuation in the galaxy density or a challenge to the large-scale clustering predicted by the CDM Hubble Volume simulation. Even lowering the normalisation to the 1 best fit lower limit yields a significance of . Only if the Metcalfe et al. (2001) model is lowered by to the mean 2MASS number density at 12.5 for () , do the counts become more consistent with the CDM prediction. To remove any discrepancy in the 12.5 counts over the APM survey area requires the model normalisation to be lowered by 3.8. Combining the error on the normalisation and the significance estimate for the best fit normalisation in quadrature yields a significance of 3.0. Clearly, unless the faint -band counts are systematically too high, then the 2MASS counts over the APM survey area suggest the presence of excess power at large scales over the CDM prediction.
4 The 2MASS Angular Power Spectrum
The large local hole in the APM survey area, as suggested by Busswell et al. (2004) (a 25 per cent deficiency to =0.1 over 4000 deg2) and the 12.5 2MASS number counts, appear to imply the presence of excess power at large scales over the CDM prediction. In order to investigate this possible presence of excess power at large scales, we compute the angular power spectrum for 20∘ 2MASS galaxies and 2MASS N-body mocks constructed from the CDM Hubble Volume mock catalogue. An examination of the implied cosmological parameters and of various possible sources of systematic error as well as a more detailed description of the method can be found in Frith et al. (2004b).
4.1 Method
Following the usual method (e.g. Peebles, 1973; Peebles & Hauser, 1973, 1974; Scharf et al., 1992), the angular power is estimated through a spherical harmonic expansion of the surface density of galaxies. The coefficients of this expansion are determined over the observed solid angle :
| (4) |
where = is the observed number of galaxies per steradian. The angular power is then determined as the ratio of the observed signal to the expected Poisson fluctuation, :
| (5) |
such that =1 corresponds to a random distribution for all-sky coverage. This is described in more detail in Frith et al. (2004b).
4.2 Results
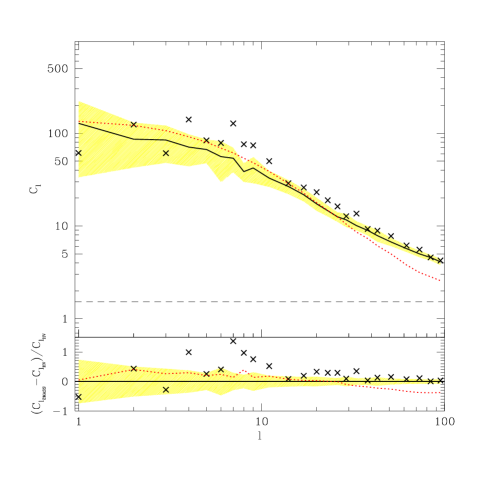
The 2MASS angular power spectrum for 120,000 , 20∘ galaxies is presented in Fig. 4. We also show the mean and 1 spread determined from 27 mock 2MASS catalogues described in section 2.4. The linear model corresponding to the CDM Hubble Volume mock catalogue input parameters, corrected for the window, is indicated by the dotted line.
The 2MASS angular power spectrum is in reasonable agreement with the mock 2MASS angular power spectra although the 2MASS angular power spectrum slope is steeper and there is some discrepancy with the mock catalogue in an unbiased scenario. Therefore it appears that either there is an excess of power in the 2MASS catalogue over the CDM Hubble Volume or there exists a scale-dependent bias within the scales shown. Clearly, the issue of bias is critical in determining the level of disagreement at large scales. Taking a reasonable value of the -band bias of =1.1 (Maller et al., 2003a), the disagreement at large scales (30; this corresponds to 30Mpc at the mean depth of the 12.5 sample) is at the 3 level.
4.3 The relevance for a large local hole
Using equation 3, we can determine whether the possible excess of power observed at large scales in the 2MASS angular power spectrum over the CDM prediction can account for a large local hole in the APM survey area, via a transform of the angular power spectrum to the angular correlation function. For this we use a Bessel function transform (Efstathiou, 1990):
| (6) |
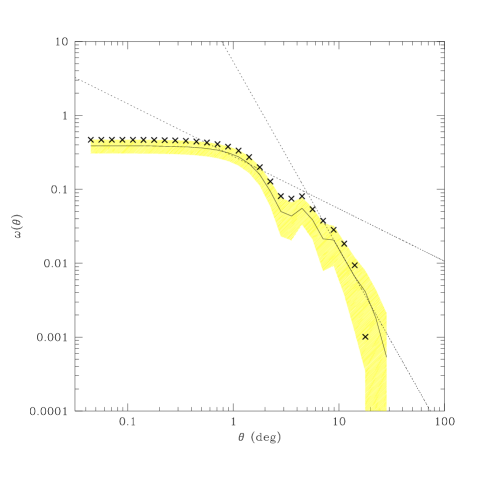
In Fig. 5, we present the transformation of the 2MASS and CDM mock 2MASS power spectra shown in Fig. 4 to the angular correlation function, together with the best fit power laws used in section 3.3. Both the 2MASS and mock 2MASS angular correlation functions are in good agreement with the Maller et al. (2003a) best fit slope at ; at smaller scales, the transformation becomes unreliable due to the lack of angular power spectrum information beyond =100.
The 2MASS angular correlation function is in good agreement with the mock 2MASS catalogues at large scales, although there is a small difference in slope. Computing the significance as in Equation 3 using a new best fit power law to the 2MASS angular correlation at large scales () does slightly reduce the significance; the significance estimates in Table 1 are reduced by 0.5 in each case.
Since the significance estimates detailed in Table 1 are only marginally effected by this change in the large-scale slope of the angular correlation function, it appears that the discrepancy found between the 2MASS angular power spectrum and the CDM mock 2MASS power spectra at large scales is not able to account for the large local hole in the galaxy distribution described in section 3. The only way in which this local hole and the lack of excess large-scale power over the CDM prediction can be reconciled is if the whole local sample is significantly biased by the local galaxy distribution in the APM survey area and therefore that the 2MASS catalogue is not a fair sample of the Universe. This is further discussed in section 6.
5 Counts in Cells
Our third technique to investigate the local large-scale structure is a counts in cells analysis of the 2MASS sample. At one level this is simply a check of the significance calculation used in section 3.3. However, it is also interesting to investigate how higher order moments in the galaxy clustering may effect the large-scale structure, and also whether the Hubble Volume simulation is able to reproduce the observed structure over cosmologically significant volumes.
5.1 Method
We sample the 2MASS survey area with a large number of randomly placed circular cells with an angular radius . The Count Probability Distribution Function (CPDF) is defined as the probability of finding an exact number of galaxies, , in a particular cell as a function of the cell size (e.g. Croton et al., 2004). Here, we determine the CPDFs for =0, 2, 6 and 20 sampling scales of 3∘. We therefore limit the area over which the cells are placed to 20∘ and the 2MASS 12.5 sample to 10∘ to remove spurious edge effects. This magnitude limit is chosen in order that the peak in the selection function lies within the redshift range of interest; at 12.5 the peaks at 0.05, and so this magnitude limit preferentially samples the mean depth of the possible local hole in the APM survey area.
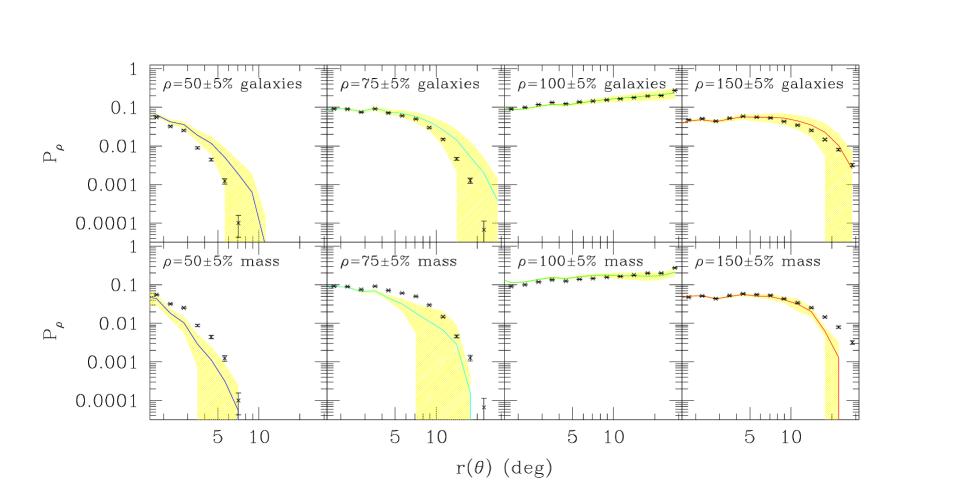
In order to probe much larger scales, of interest in this work, it is more useful to probe the density of galaxies rather than the absolute number. We define a Density Probability Distribution Function (DPDF) as the probability of finding a cell of given density (determined with respect to the mean 2MASS density) as a function of cell size. Since we wish to probe the galaxy distribution at large angular scales, we limit the cells to 42∘ and the 2MASS 12.5 sample to 10∘ as before. For both the CPDFs and DPDFs, we mimic the 2MASS sample with the 27 biased and unbiased mock 2MASS catalogues described in section 2.3.
5.2 Results
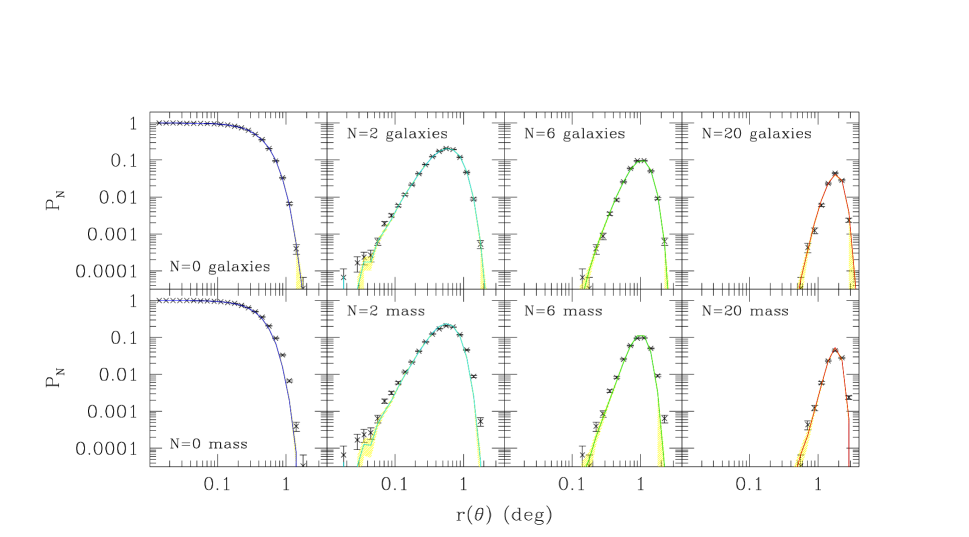
In Fig. 6, we show the CPDFs for =0, 2, 6 and 20 determined for the 2MASS and mock 2MASS samples. The agreement between the 2MASS and the mock galaxy samples is excellent, although this is not unexpected since the CPDF is dominated by the 2-point correlation function; the mock galaxy sample is produced to match the observed at small scales.
Moving to larger scales, Fig. 7 shows the DPDFs for the 2MASS and mock galaxy samples for a range of densities, determined with respect to the mean 2MASS density. Again, the agreement is excellent to extremely large scales ( 30∘). It is also interesting to note that the introduction of bias has an extremely significant effect on the resulting DPDF. While the solid angles probed in the largest bin are slightly smaller than the APM survey area, the good agreement between the biased mocks and the 2MASS sample confirms the significance calculation shown in Table 1 which suggests that, when compared to the mean 20∘ 2MASS number count, the observed deficiency in the APM survey area is not significant when compared to the CDM prediction. The mock 2MASS catalogues are normalised to the mean number count observed by 2MASS and so any increase in the global galaxy density, as might be suggested by the faint -band counts, increases the significance of a large local hole.
6 Discussion & Conclusions
Recent evidence (Busswell et al., 2004; Frith et al., 2003, 2004a) has suggested that while the optical number counts over the APM survey area may be significantly less deficient than originally proposed, the resulting under-density might still present a challenge to the form of clustering predicted by CDM at large scales. In this paper, we have presented three different methods of analysis to probe the possible existence of this large local hole in the galaxy distribution in the SGC using the recently completed 2MASS survey.
First, we determined the -band number counts over the APM survey area. In order to probe the underlying galaxy distribution, we compared the APM counts with a model guided by the Southern 2dFGRS ; this variable model provides a reasonable agreement with the corresponding -band counts extracted for the Southern 2dFGRS strip. The agreement between the Southern 2dFGRS variable model and the -band counts over the APM survey area is remarkable, and suggests that the galaxy distribution over this 4000 deg2 area may be similar to that of the much smaller 2dFGRS Southern strip. Using the 2MASS-2dFGRS matched , this would imply a mean deficiency in the galaxy distribution of 24 per cent to with respect to the Metcalfe et al. (2001) model used in this paper; taking the 1 lower limit best fit normalisation of this model to faint -band data compiled from the literature in the range 1418 implies a mean deficiency of 15 per cent to =0.1.
The issue is complicated by the 20∘ and -20∘ 2MASS counts which are in good agreement with each other but are significantly below the Metcalfe et al. (2001) homogeneous prediction. There are three possible interpretations. The first is that the model normalisation is too high. However, if the model were scaled down in order to agree with the mean 2MASS number density, this would require a 2.5 deviation from the faint -band counts; to account for the low APM counts entirely through a change in the normalisation would require a 3.8 deviation. Secondly, the low cap counts might indicate a zero-point offset between the Metcalfe et al. (2001) model and the 2MASS data. Invoking the 0.15 magnitude shift necessary to bring the cap counts and the model into line would compromise the good agreement between the 2MASS and Loveday (2000) photometry and also between the 2dFGRS -band counts and the corresponding variable models. Thirdly, the low 2MASS cap counts might indicate that the entire local galaxy distribution is globally under-dense. While this might appear to be unlikely, the observed 2MASS counts over the APM survey area suggest that large inhomogeneities exist in the galaxy distribution over extremely large volumes, and so perhaps only a few such features are necessary to bias the entire local sample. It is therefore not possible to rule out this final possibility without further analysis. However, since the 20∘ and -20∘ counts are similar, this position requires the coincidence that we are positioned in the centre of this local underdensity (Loveday, 2004).
In order to determine the significance of the observed -band counts over the APM survey area, we calculated the expected variance over 4000 deg2 considering a CDM form of the 2-point angular correlation function at large scales. The observed deficiency is calculated with respect to the Metcalfe et al. (2001) model, the best fit and 1 lower limit best fit normalisations of this model described in section 3.1, and the mean 2MASS number density (). In the first three cases, the observed counts represent an extremely rare fluctuation from that expected by CDM. If the Metcalfe et al. (2001) model is effectively lowered by 2.5 with respect to the faint -band data to the mean 2MASS number density, then the observed counts begin to become more consistent with a CDM form of the correlation function. Therefore, unless the faint -band data are systematically too high or the galaxy distribution in the SGC is an extremely rare fluctuation in the galaxy density, then the -band counts over the APM survey area appear to imply an excess of power at large scales over the CDM prediction.
Our second technique is therefore to examine the large-scale power in the 2MASS catalogue through a determination of the galaxy angular power spectrum. We compare this to a CDM prediction determined from the Hubble Volume simulations. The two are in reasonable agreement although there is some discrepancy in the slopes; taking a -band bias of =1.1 (Maller et al., 2003a) results in a excess over the mean CDM angular power spectrum at large scales (30). In order to determine the effect of this apparent excess on the significance estimates used previously, we transform the angular power spectrum to the angular correlation function via a Bessel function transform. The corresponding best fit to the 2MASS angular correlation function at large scales () decreases the significance estimates by 0.5 compared to the CDM angular correlation function used previously. Therefore while there appears to be an excess of power at large scales in the 2MASS catalogue over the CDM Hubble Volume simulation, it is not enough to account for the observed deficiency in the APM survey area. One caveat to this is that the mock 2MASS catalogues are constructed such that the mean galaxy density agrees with that of the 2MASS sample. If, as might be inferred from the low cap counts in Fig. 3, the local galaxy distribution was globally under-dense with respect to the faint -band counts, then the corresponding significance estimates would change due to the fact that the 2MASS correlation function is not drawn from a fair sample of the Universe.
Our third technique is to use a 2-dimensional counts in cells analysis on the 2MASS catalogue and also the unbiased and biased mock 2MASS catalogues constructed from the CDM Hubble Volume simulation (again normalised to the mean 2MASS galaxy density). This enables us to verify the significance estimates used previously, and also that the form of real features in the galaxy distribution are reproduced by the CDM Hubble Volume simulation at large scales. The biased mock catalogues reproduce the observed galaxy distribution to very large scales ( 30∘). This supports the significance calculation determined previously (with respect to the mean 2MASS number density) which indicates that the local hole is not a challenge to CDM if the 2MASS catalogue is a fair sample of the Universe.
In conclusion, the issue of the large local hole in the local galaxy distribution has yet to be resolved. The 2MASS -band number counts extracted for the 4000 deg2 APM survey area indicate a clear deficiency in the local galaxy distribution consistent with the form of the in the much smaller 2dFGRS Southern strip. However, to determine the level of the deficiency in the galaxy distribution requires an accurate normalisation of the -band number count model. Using the Metcalfe et al. (2001) model, which provides an excellent fit to faint -band data compiled from the literature in the range 1418, implies a deficiency over the APM survey area which is at odds with CDM and a local galaxy distribution which is globally under-dense. Only if the model is lowered by 3.8 below the faint -band data can the normalisation account for the low counts over the APM survey area. The large increase in faint -band data from the UK Infra-red Deep Sky Survey should help to resolve this issue.
Acknowledgements
This publication makes use of data products from the 2 Micron All-Sky Survey, which is a joint project of the University of Massachusetts and the Infrared Processing and Analysis Centre/California Institute of Technology, funded by the Aeronautics and Space Administration and the National Science Foundation. We thank Adrian Jenkins and Carlton Baugh for their assistance with the Hubble Volume mock catalogues and useful discussion. We also thank Tom Jarrett for his help with the 2MASS magnitudes.
References
- Baugh & Efstathiou (1993) Baugh, C.M. & Efstathiou, G. 1993, MNRAS, 265, 145
- Bruzual & Charlot (1993) Bruzual, A.G., & Charlot, S. 1993, ApJ, 405, 538
- Busswell et al. (2004) Busswell, G.S., Shanks, T., Outram, P.J., Frith, W.J., Metcalfe, N. & Fong, R. 2004, MNRAS accepted, astro-ph/0302330
- Cole et al. (1998) Cole, S.M., Hatton, S.J., Weinberg, D.H. & Frenk, C.S. 1998, MNRAS, 300, 945
- Cole et al. (2001) Cole et al. 2001, MNRAS, 326, 555
- Colless et al. (2001) Colless, S. et al. 2001, astro-ph/0306581
- Croton et al. (2004) Croton, D.J. et al. 2004, astro-ph/0401406
- Driver (2003) Driver, S. 2003, IAUS, 216, 97
- Efstathiou (1990) Efstathiou, G. 1990, in Shanks, T. et al., eds, Observational Tests of Inflation. Kluwer, p425
- Frith et al. (2003) Frith, W.J., Busswell, G.S., Fong, R., Metcalfe, N. & Shanks, T. 2003, MNRAS, 345, 1049
- Frith et al. (2004a) Frith, W.J., Outram, P.J. & Shanks, T. 2004a, astro-ph/0408011
- Frith et al. (2004b) Frith, W.J., Outram, P.J. & Shanks, T. 2004b, in preparation
- Huang et al. (1997) Huang, J.S., Cowie, L.L, Gardner, J.P., Hu, E.M., Songalia, A. & Wainscoat, R.J. 1997, ApJ, 476, 12
- Huang et al. (2001) Huang, J.S. et al. 2001, A&A, 368, 787
- Jarrett et al. (2000) Jarrett, T.H., Chester, T., Cutri, R., Schneider, S., Skrutskie, M. & Huchra, J.P. 2000, AJ, 119, 2498
- Jenkins et al. (1998) Jenkins, A. et al. 1998, ApJ, 499, 20
- Kummel & Wagner (2000) Kummel, M.W. & Wagner, S.J. 2000, A&A, 353, 867
- Loveday (2000) Loveday, J. 2000, MNRAS, 312, 517
- Loveday (2004) Loveday, J. 2004, MNRAS, 347, 601L
- Maddox et al. (1990) Maddox, S.J., Sutherland, W.J., Efstathiou, G. & Loveday, J. 1990, MNRAS, 243, 692
- Maller et al. (2003a) Maller, A.H., McIntosh, D.H., Katz, N. & Weinberg, M.D. 2003a, astro-ph/0304005
- Maller et al. (2003b) Maller, A.H., McIntosh, D.H., Katz, N. & Weinberg, M.D. 2003b, ApJ, 598, 1
- Martini (2000) Martini, P. 2000, AAS, 197, 6503
- McCracken et al. (2000) McCracken, H.J., Metcalfe, N., Shanks, T., Campos, A., Gardner, J.P. & Fong, R. 2000, MNRAS, 311, 707
- McLeod et al. (1995) McLeod, B.A., Bernstein, G.M., Rieke, M.J., Tollestrup, E.V, & Fazio, G.G. 1995, ApJS, 96, 117
- Metcalfe et al. (1995) Metcalfe, N., Fong, R. & Shanks, T. 1995, MNRAS, 274, 769
- Metcalfe et al. (2001) Metcalfe, N., Shanks, T., Campos, A., McCracken, H.J. & Fong, R. 2001, MNRAS, 323, 795
- Peebles (1973) Peebles, P.J.E.. 1973, ApJ, 185, 413
- Peebles & Hauser (1973) Peebles, P.J.E. & Hauser, M.G. 1973, ApJ, 185, 757
- Peebles & Hauser (1974) Peebles, P.J.E. & Hauser, M.G. 1974, ApJS, 28, 19
- Peebles (1980) Peebles, P.J.E. 1993, Principles of Physical Cosmology, Princeton University Press
- Ratcliffe et al. (1998) Ratcliffe, A. et al. 1998, MNRAS, 300, 417
- Scharf et al. (1992) Scharf, C., Hoffman, Y., Lahav, O. & Lynden-Bell, D. 1992, MNRAS, 256, 229
- Schlegel et al. (1998) Schlegel, D.J., Finkbeiner, D.P. & Davis, M. 1998, ApJ, 500, 525
- Shectman et al. (1996) Shectman, S.A., Landy, S.D., Oemler, A., Tucker, D.L., Lin, H., Kirshner, R.P. & Schechter, P.L. 1996, ApJ, 470, 172
- Szokoly et al. (1998) Szokoly, G.P. et al. 1998, ApJ, 492, 452
- Vaisanen et al. (2000) Vaisanen, P., Tollestrup, E.V., Willner, S.P. & Cohen, M. 2000, ApJ, 540, 593
- Vettolani et al. (1997) Vettolani, G. et al. 1997, A&A, 325, 954
- Yasuda et al. (2001) Yasuda, N. et al. 2001, AJ, 122, 1104