Simulating young star clusters with primordial binaries
Abstract
We simulate a cluster of 144179 stars including 13107 primordial hard binaries (10% of the total number of single stars and binary centers of mass), using direct integration of the equations of motion of all stars and binaries and incorporating the effects of stellar and binary evolution. The initial conditions are representative of young dense star clusters in the Local Group and other nearby galaxies like the Antennae and M82. We find that the early phase of core collapse, driven by mass segregation, is not appreciably delayed by the presence of a large number of hard binaries. By the end of the simulation, at an age of 115 Myr, the cluster radius has expanded by about a factor of two. This may be explained as adiabatic expansion driven by the loss (via stellar evolution) of % of the initial total mass. Binary dynamics apparently has little effect on the early cluster expansion. During the evolution, the total binary fraction drops at a roughly constant rate of % per Myr. The fraction of very hard binaries, however increases at about 0.025% per Myr. By the end of the simulation the cluster contains 37 binaries containing at least one black hole; roughly half (17) of these contain two black holes.
Astronomical Institute ‘Anton Pannekoek’, University of Amsterdam, Kruislaan 403, the Netherlands and Institute for Computer Science, University of Amsterdam, Kruislaan 403
Department of Physics, Drexel University, Philadelphia, PA 19104, USA
1. Introduction
Young and dense star clusters (YoDeCs) are a relatively new class of object, containing about – stars and having ages less than about 10 Myr and densities exceeding a few times stars/pc3. There are four examples in the Milky Way Galaxy: the Arches and Quintuplet clusters near the Galactic center, and NGC 3603 and Westerlund 1 in the disk. Table 1 summarizes the observed parameters for some known YoDeCs. In addition to the clusters just mentioned, we also include R 136, the central cluster in the 30 Doradus region, and MGG 11, in the starburst galaxy M82, which may contain an intermediate-mass black hole (Portegies Zwart et al. 2004).
Motivated by these observations, as well as by theoretical considerations, we distinguish two families of YoDeC: those which are effectively isolated, and those which are strongly perturbed by the tidal field of their parent Galaxy. We currently know only two clusters in the latter category—the Arches and Quintuplet systems. The other clusters in Table 1 are relatively unperturbed. In this paper we focus on the dynamics of the primordial binary population in unperturbed young dense clusters.
The binary frequency and the distribution functions of binary orbital parameters are poorly constrained by observations. For two YoDeCs we have a rough estimate of the binary fraction: NGC 3603, with an estimated binary fraction of about 0.3 (Stolte et al. 2004), and R 136, which may contain up to 70% binaries among its most massive stars (Portegies Zwart et al. 2002). These indications of binary frequencies are based on the X-ray signatures of these clusters. Further evidence for a high binary fraction in two star clusters near the Galactic center is presented by (Yusef-Zadeh 2003).
| Name | ref | age | (pc) | MF | ||
| [] | [Myr] | |||||
| Arches | a | 60 | 1–4 | 0.23 | ?? | Pl |
| Quintuplet | b | 15 | 3–5 | 0.5 | ?? | S |
| NGC 3603 | c | 20 | 2–3 | 0.78 | 0.3 | S |
| Westerlund 1 | d | 30 | 5–12 | 0.2 | ?? | S |
| R 136 | e | 50 | 2–3 | 0.5 | S | |
| MGG-11 | f | 320 | 7–12 | 1.2⋆ | – | S |
References:
a) Figer et al. (1999;2002);
b) Glass et al. (1987);
c) Brandl (1999), ;
d) Vrba et al. (2000);
e) Brandl et al. (1996), ;
f) McCrady et al. (2003)
2. The simulation model and initial conditions
As initial conditions for our simulations we use a cluster of 131072 stars drawn from a Salpeter initial mass function between 1 and 100 . The lower mass limit is motivated by the observed age and mass-to-light ratio of the young star cluster MGG11 (McCrady et al. 2003). A randomly selected subset of 13107 (10%) stars receives a secondary companion with mass between 1 and the mass of the selected (primary) star. Orbital separations range from Roche-lobe contact (at about , where is the mean stellar kinetic energy) to a binding energy of kT (at an orbital period of about a week), while initial eccentricities are assumed to follow a thermal distribution (see the left panel in Figure 4). The initial half-mass radius of our simulation is 3.2 pc, and even though our simulated cluster is isolated we choose a King model with as the initial density profile.
We solve the equations of motion of all the stars in the cluster, at the same time calculating the evolution of the stars and binaries using the Starlab111Starlab is available at http://www.manybody.org/starlab/starlab.html software environment (Portegies Zwart et al. 2001). We use the GRAPE-6 special-purpose computer (Makino et al. 2003) to speed up the calculations. Even though no older siblings of the YoDeCs listed in Table 1 are known, our cluster simulations generally continue to ages of about 100 Myr.
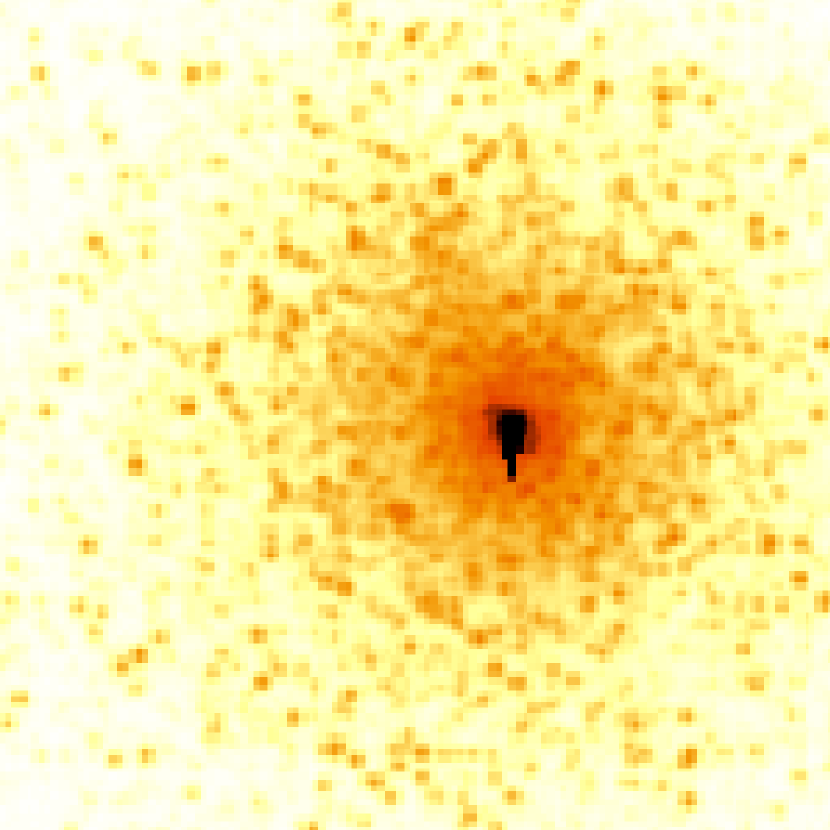
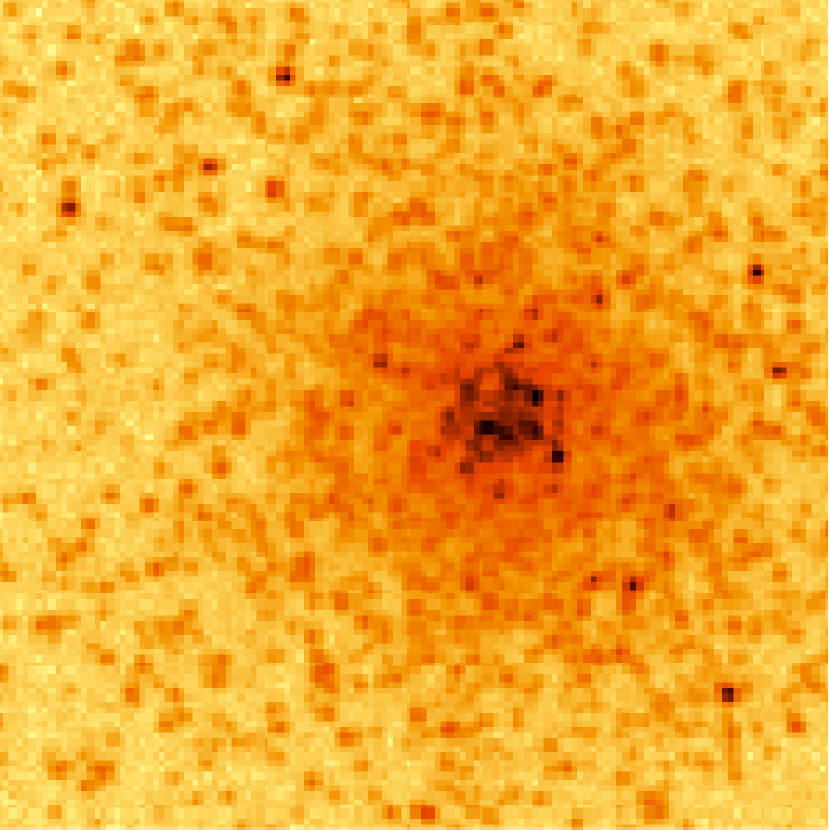
Rather than show the usual evolution of the core and Lagrangian radii we show instead in Figure 1 two simulated images of the model cluster, one near the start of the simulation, and one near the end. Clearly, the cluster expands considerably with time. As discussed in (Portegies Zwart 2004), the global evolution is characterized by three quite distinct stages: A an early relaxation-dominated phase, followed by phase B, during which the % (by number) most massive stars evolve quickly and lose an appreciable fraction of their mass. Finally, in phase C, stellar evolution slows and relaxation takes over until the cluster dissolves (Portegies Zwart 2004). For this particular simulation, phase A lasts for about 3 Myr, phase B lasts until Myr, followed by phase C for the remainder of the run.
3. Results
Figure 2 shows the evolution of the number of binaries in our simulated cluster. The total number of binaries drops by % in 115 Myr, whereas the number of stars drops by only 1%. The total cluster mass drops by about 40% during the same period.
The top solid curve gives the total number of binaries throughout the simulations, from birth to an age of 115 Myr. The lower solid curve gives the number of binaries within 10 . We use ten times the core radius () here because the number of binaries withing one core radius is so small. The dashed curve shows the number of very hard binaries, having binding energy kT.

In Figure 3 we present, as functions of time, the number of binaries with at least one compact object, black hole, neutron star or white dwarf. The number of black holes in binaries rises sharply shortly after the start of the simulation with a peak near 8 Myr. This is the moment when the turn off drops below the minimum mass ( ) for forming black holes: lower-mass stars form neutron stars. This threshold is also visible as the sharp increase of the number of binaries containing a neutron star. The number of black holes in binaries drops rapidly from this moment on, because many of their companions form neutron stars in supernova explosions. These newly formed neutron stars receive a much higher asymmetric kick velocity during their formation (Lyne & Lorimer 1994) than black holes (Gualandris et al. 2004). Note that binaries containing a neutron star and a black hole are counted twice in this figure, once among the (bh, ) and once for (ns, ).
The middle solid curve in Figure 3 shows an interesting dip between about 75 Myr and 80 Myr binaries within 10 are depleted. The explanation for this local depression is the occurrence of core collapse. This is rather surprising, as the energy stored in primordial binaries is sufficient to support the cluster core and to prevent core collapse.
For a star cluster with a broad mass spectrum and without primordial binaries, core collapse occurs in about 20% of the initial half-mass relaxation time (McMillan & Portegies Zwart 2003). With a half-mass relaxation time of Myr in our simulation, one therefore expects core collapse in about 70 Myr. We attribute the fact that the observed collapse happens about 10 Myr later than that to the effect of stellar mass loss, as by this time the cluster has lost about 36% of its mass by stellar evolution. (Note that less mass would have been lost by the cluster if we had adopted a lower limit to the initial-mass function.) Most of the mass loss happens in the cluster core, effectively driving an adiabatic expansion; it appears that binary heating does not play an important role in the core evolution.
Even though we have not presented here definitive proof that the binary population is ineffective in influencing this phase of the core evolution, the collapse of the cluster core suggests that binary heating delays core collapse by at most 10 Myr. This may be contrasted with the results of earlier Monte-Carlo simulations, which indicate that core collapse is significantly delayed by the presence of a rich population of primordial binaries (Fregeau et al. 2003).

The first white dwarfs appear at 23.8 Myr, at a turn-off mass of about 10 . Isolated stars (i.e. unperturbed by any companion) are expected to evolve into white dwarfs if their initial mass is less than roughly 8 . However, in binary systems, early stripping of the hydrogen envelope may cause more massive stars also to become white dwarfs instead of collapsing to neutron stars. The population of compact binaries of clusters older than about 40 Myr is dominated by white dwarfs, although at a formation rate of about 100 white-dwarf binaries per 30 Myr, it will take about 2 Gyr before they become more common than primordial main-sequence binaries.
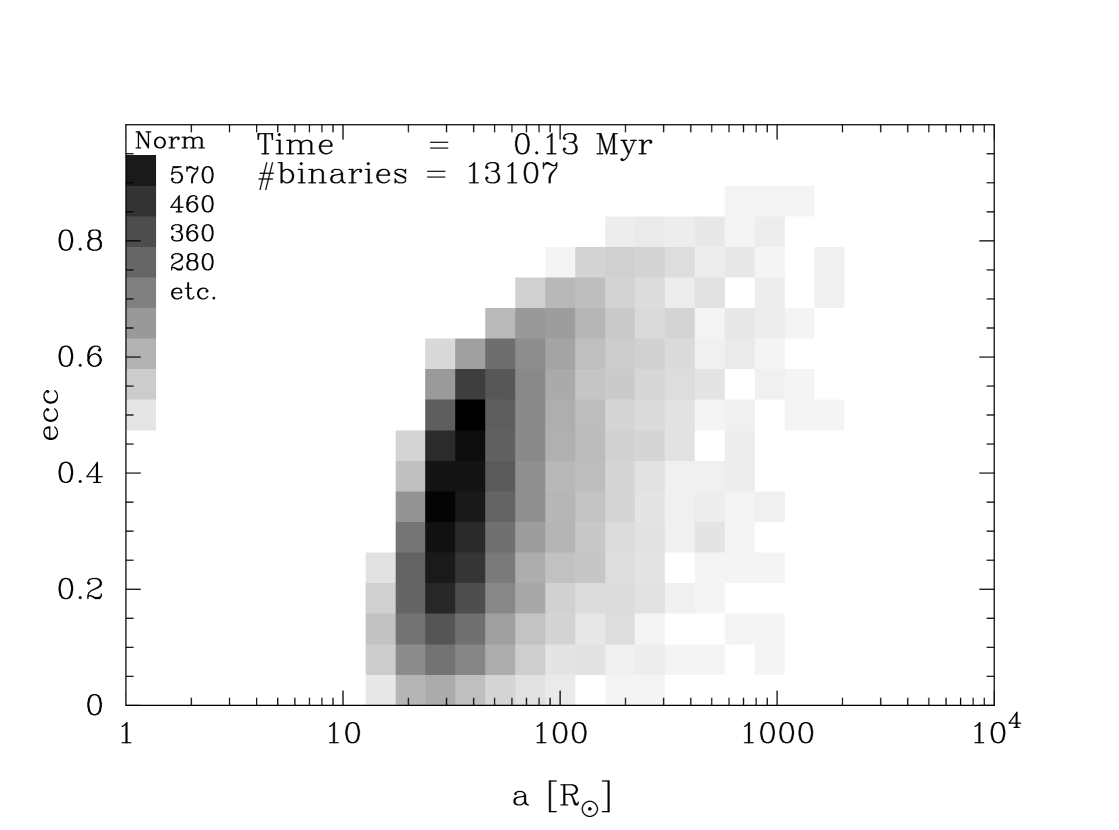
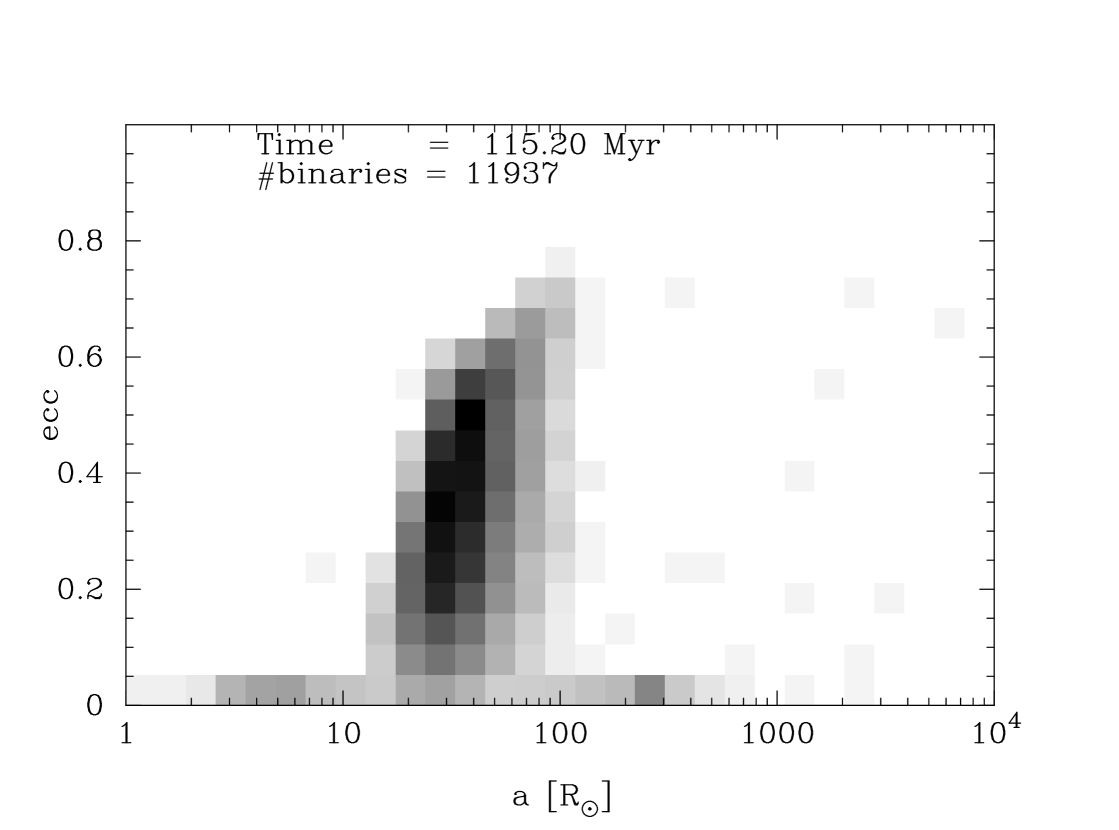
Figure 4 shows the distribution in semi-major axis and eccentricity of the binary population at the start of our simulation (left panel) and at 115 Myr (right). We have rendered the image in gray-shades, with darker shades indicating more systems within the bin. The left panel in Figure 4 represents essentially the zero-age population, except that we show the system after about one cluster crossing time (0.1 Myr) to eliminate (for example) any spurious initializations of eccentric binaries which should circularize shortly after formation. The orbital separation ranges from about 15 to about 1000 . The lack of very high eccentricities () is mainly due to tidal effects within binary systems. An encounter is unlikely to ionize a binary, but effectively changes its eccentricity; highly eccentric binaries () typically become more circular after an encounter.
In the right panel of Figure 4 we show the distribution in semi-major axis and eccentricity for the binaries remaining in our simulation at an age of 115 Myr. The two most striking differences compared to the left (zero age) panel are the depletion of binaries with orbital separations , and the enormous increase in binaries on circular orbits.
The pile-up in Figure 4 of wide ( ) binaries with circular orbits and the depletion of wide eccentric binaries is caused mainly by the internal evolution of the binaries in combination with the initial conditions. The initial binary separations were selected between Roche-lobe contact and a binding energy of kT. The hard-soft boundary for a binary with orbital separation and total mass may be estimated as
| (1) |
Here , , and are the number of stars and the total cluster mass and half-mass radius. Binaries with total mass exceeding 5 will, according to our initial requirement that all binaries have binding energy kT, have orbital separations smaller than 200 . The turnoff mass for our cluster at an age of 115 Myr is about 4.5 , so binary components more massive than that are either ascending the giant branch or have already done so. The binaries with initial orbital separations exceeding host mainly rather massive stars, which have already evolved off the main sequence by the time the cluster is 115 Myr old, and therefore these binaries have experienced strong internal evolution. Note here that wide binaries tend to shrink upon Roche-lobe overflow, due to angular momentum loss via non-conservative mass transfer, whereas shorter-period binaries tend to expand; this leads to a pile-up of circular binaries around –300 . Binaries containing lower-mass stars generally have tighter orbits, and do not populate this region, at least not during the cause of the simulation.
The few eccentric binaries with orbital separations at an age of 115 Myr have experienced two supernovae; in most cases (11 out of 14) both supernovae led to the formation of a black hole. The few binaries to the left of the circularization boundary are in the process of rapid circularization due to tidal effects.
4. Summary
We report the results of a large (128k) direct N-body simulation with 10% hard ( kT) primordial binaries. Our simulations include the effects of stellar mass loss, collisions, and coalescence, and the internal evolution of binaries.
Our main conclusions may be summarized as follows: core collapse in the simulation occurs at an age of about 80 Myr. In a star cluster with similar initial conditions but without stellar mass loss and without primordial binaries, core collapse would be expected to occur at about 70 Myr. We therefore argue that core collapse is slightly delayed by stellar mass loss and the presence of the binaries. The former appears to be the main cause of the delayed core collapse.
The number of binaries containing one or two compact objects increases steadily from the start of the simulation. After about 30 Myr, the number of binaries with at least one black hole remains roughly constant at about 40, whereas the number of binaries containing at least one white dwarf continues to grow at a roughly constant rate of about 100 per 30 Myr.
Acknowledgment
We are grateful to Jun Makino and Piet Hut for numerous discussions, and in particular to Makino for the use of his GRAPE-6, on which many of our simulations have been performed. Additional simulations are carried out using the GRAPE-6 systems at Drexel University and at the MoDeStA computer at the University of Amsterdam. This work was supported by NASA ATP grant NAG5-10775, the Royal Netherlands Academy of Sciences (KNAW), the Dutch organization of Science (NWO), and by the Netherlands Research School for Astronomy (NOVA).
References
- Figer et al. (1999) Figer, D. F., McLean, I. S., Morris, M. 1999, ApJ, 514, 202
- Figer et al. (2002) Figer, D. F., Najarro, F., Gilmore, D., Morris, M., Kim, S. S., Serabyn, E., McLean, I. S., Gilbert, A. M., Graham, J. R., Larkin, J. E., Levenson, N. A., Teplitz, H. I. 2002, ApJ, 581, 258
- Fregeau et al. (2003) Fregeau, J. M., Gürkan, M. A., Joshi, K. J., Rasio, F. A. 2003, ApJ, 593, 772
- Glass et al. (1987) Glass, I. S., Catchpole, R. M., Whitelock, P. A. 1987, MNRAS, 227, 373
- Gualandris et al. (2004) Gualandris, A., Colpi, M., Portegies Zwart, S. F., Possenti, A. 2004, ApJ in press, (astro-ph/0407502)
- Lyne & Lorimer (1994) Lyne, A. G., Lorimer, D. R. 1994, Nat, 369, 127
- Makino et al. (2003) Makino, J., Fukushige, T., Koga, M., Namura, K. 2003, PASJ, 55, 1163
- McCrady et al. (2003) McCrady, N., Gilbert, A. M., Graham, J. R. 2003, ApJ, 596, 240
- McMillan & Portegies Zwart (2003) McMillan, S. L. W., Portegies Zwart, S. F. 2003, ApJ, 596, 314
- Piatti et al. (1998) Piatti, A. E., Bica, E., Claria, J. J. 1998, A&AS, 127, 423
- Portegies Zwart (2004) Portegies Zwart, S. F. 2004, Book of the Como School of Physics, Joint Evolution of Black Holes and Galaxies, Graduate School in Contemporary Relativity and Gravitational Physics, May 05-10, 2003 in Como, Italy, (astro-ph/0406550)
- Portegies Zwart et al. (2004) Portegies Zwart, S. F., Baumgardt, H., Hut, P., Makino, J., McMillan, S. L. W. 2004, Nat, 428, 724
- Portegies Zwart et al. (2001) Portegies Zwart, S. F., McMillan, S. L. W., Hut, P., Makino, J. 2001, MNRAS, 321, 199
- Portegies Zwart et al. (2002) Portegies Zwart, S. F., Pooley, D., Lewin, W. H. G. 2002, ApJ, 574, 762
- Stolte et al. (2004) Stolte, A., Brandner, W., Brandl, B., Zinnecker, H., Grebel, E. K. 2004, AJ, 128, 765
- Vrba et al. (2000) Vrba, F. J., Henden, A. A., Luginbuhl, C. B., Guetter, H. H., Hartmann, D. H., Klose, S. 2000, ApJ, 533, L17
- Yusef-Zadeh (2003) Yusef-Zadeh, F. 2003, ApJ, 598, 325