OPENING THE TREASURE CHEST: A NEWBORN STAR CLUSTER EMERGES FROM ITS DUST PILLAR IN CARINA
Abstract
We present detailed observations of the Treasure Chest, a compact nebula at the head of a dust pillar in the southern Carina nebula. This object is of interest because it is an example of a dense young cluster containing at least one massive star, the formation of which may have been triggered by feedback from the very massive stars in the Carina nebula, and possibly Carinae itself. Our observations include narrowband images of H, [S ii], [O iii], Pa , [Fe ii], and H2, broadband JHK images, and a visual-wavelength spectrum of the nebula. We use these data to investigate both the nebular and stellar content of the object. The near-infrared emission-line images reveal a cavity inside the head of the dust pillar, which contains a dense cluster of young stars, while the observed spectrum of the nebula is consistent with an H ii region ionized by the O9.5 V star CPD 592661. The embedded infrared cluster was discovered in 2MASS data, but our new JHK images have improved spatial resolution and sensitivity, allowing an analysis of the stellar content of the newborn cluster. After subtracting contamination of field stars within the Carina nebula itself, we compare the cluster’s color magnitude diagram with pre-main-sequence isochrones to derive a likely cluster age less than about 0.1 Myr. This is in reasonable agreement with the dynamical age of a few times 104 yr for the expanding nebular cavity, indicating extreme youth. Stars in the Treasure Chest cluster are highly reddened, with extinction values as large as 50. Two-thirds of cluster members show strong infrared excess colors indicative of circumstellar disks, which may prove to be among the highest fraction yet seen for a young cluster once L-band photometry is considered. All evidence suggests that the Treaure Chest is an extremely young cluster that is just now breaking out of its natal cloud into the surrounding massive star forming region, and is a good target for more detailed study.
1 INTRODUCTION
The Carina nebula (NGC 3372) is a giant H ii region rich in complex structure that has just recently been recognized as an important region of ongoing active star formation. Early surveys of the central part of the nebula in molecular lines and far-infrared (IR) continuum suggested that neutral gas and dust is mostly evacuated from the core of the nebula and that it lacks significant current star formation (Harvey et al. 1979; Ghosh et al. 1988; de Grauww et al. 1981). It was assumed that radiation and stellar winds from hot massive stars in Carina are just clearing away the last vestiges of their natal molecular cloud.
However, recent studies at IR wavelengths have dramatically altered this view. Megeath et al. (1996) found an embedded near-IR source at the edge of a dark cloud near Car. A large-scale thermal-IR survey with the Midcourse Space Experiment (MSX) revealed dozens of compact IR sources that were suggested as potential sites of ongoing and possibly triggered star formation (Smith et al. 2000). Many of these are found in the southern part of the nebula at the heads of giant dust pillars pointing back toward the massive stars in the core of the nebula (Smith et al. 2000; Rathborne et al. 2004). One southern pillar contains a luminous Class I protostar that drives the parsec-scale HH666 outflow (Smith et al. 2004a), and several other dust pillars may contain embedded IR sources and even star clusters seen in 2MASS data (Rathborne et al. 2004). Thus, the dust pillars in the Carina nebula are akin to the famous pillars in M16, which contain embedded near-IR sources and may be sites of triggered star formation (Sugitani et al. 2002; Thompson et al. 2002; McCaughrean & Andersen 2002). With this ongoing star formation in the vicinity of some of the hottest and most massive stars known in the Galaxy (Walborn 1995; Walborn et al. 2002), the Carina nebula may also be an analog of two-stage starburst regions like 30 Dor or NGC 604. These types of regions are useful for studying a second generation of stars, whose formation may have been triggered by feedback from the first generation. At a distance of 2.3 kpc (Walborn 1995), the Carina nebula provides a laboratory to study this phenomenon in exquisite detail compared to extragalactic examples.
An object we refer to as the “Treasure Chest” (a dust pillar associated with the star CPD 592661) is located in the southern part of the Carina nebula (see Figure 1). The H nebulosity surrounding CPD 592661 was first noted by Thackeray (1950), and its visual-wavelength emission was studied in greater detail by Walsh (1984; see also Herbst 1975; van den Bergh & Herbst 1975). Walsh (1984) noted that the spectral type of CPD 592661 was O9.5 V, and that the compact nebula appeared to be expanding at 25 km s-1. The nebula and CPD 592661 are coincident with G287.84-0.82, one of the brightest of the ‘South Pillars’ identified from thermal-IR emission by Smith et al. (2000). Rathborne et al. (2004) noted that G287.84-0.82 appeared to harbor a probable young star cluster seen in 2MASS data (first noted by Dutra & Bica 2001), and showed that the IR spectral energy distribution implied a total integrated luminosity of 106.6 L⊙. The spectral type of CPD 592661, the embedded cluster, and the high IR luminosity imply that the Treasure Chest is a site of recent massive star formation. In this paper we take a closer look at the emission from the dust pillar around CPD 592661, the young luminous star cluster embedded within it, and the relationship between them.
2 OBSERVATIONS AND DATA REDUCTION
2.1 Narrow-band Optical Images
We obtained narrowband images of the southern Carina nebula on 2001 December 18 using the 81928192 pixel imager MOSAIC2 mounted at the prime focus of the Cerro Tololo Interamerican Observatory (CTIO) 4m Blanco telescope. This camera has a pixel scale of 027 and provides a 354 field of view, only a small portion of which is discussed here. The seeing during the observations was about 08. We used narrowband interference filters ( Å) centered on [O iii] 5007, H (also transmitting [N ii] 6548 and 6583), and [S ii] 6717,6731. In each filter, we took several individual exposures with slight positional offsets to correct for gaps in the CCD array, and to correct for detector artifacts. Total exposure times and other details are listed in Table 1. We reduced the data in the standard fashion with the mscred package in IRAF,111IRAF is distributed by the National Optical Astronomy Observatories, which are operated by the Association of Universities for Research in Astronomy, Inc., under cooperative agreement with the National Science Foundation. and absolute sky coordinates were computed with reference to US Naval Observatory catalog stars. Emission-line images were flux calibrated with reference to Hubble Space Telescope images of the Keyhole Nebula222See http://oposite.stsci.edu/pubinfo/pr/2000/06/ and Smith et al. (2004b)., obtained from the HST archive (the position observed by HST was included in the MOSAIC2 field of view). Appropriate corrections were made for the H filter, which is wider than the HST/WFPC2 F656N filter that mostly excludes the [N ii] lines, based on line intensities in the H ii region near the Keyhole (Smith et al. 2004b). Figure 2 shows a 3-color composite image of CPD 592661 and its surroundings made from optical CTIO/MOSAIC2 data.
2.2 Near-Infrared Images
Infrared images of the dust pillar and cluster surrounding CPD 592661 were obtained on 2003 March 11 using SOFI, the facility near-IR imager and spectrograph mounted on the New Technology Telesope (NTT) of the European Southern Observatory (ESO) at La Silla, Chile. SOFI uses a 10241024 pixel Hawaii HgCdTe array, with a pixel scale of 0288 and a field of view of roughly 49. Under photometric skies with 07 seeing, we obtained images of the Treasure Chest in the , , and broadband filters, as well as narrowband filters isolating Pa at 1.28 , [Fe ii] at 1.64 , and H2 1-0 S(1) at 2.12 . In each filter, multiple frames were taken at many different positions (dithering). Total exposure times and other details are listed in Table 1. A sky position roughly 2 south of the nebula was also observed to characterize the sky emission. The observations were reduced using standard IR data reduction procedures in IRAF. To flux calibrate the , , and images, we chose several field stars included in our images that were near CPD 592661 and reasonably well isolated, and we adopted their fluxes listed in the 2MASS point source catalog.333http://irsa.ipac.caltech.edu/2mass.html To flux calibrate the narrowband images, we used the same field stars and interpolated their continuum flux to the filter wavelength; calibration of the narrow filters has a roughly 20% uncertainty in absolute flux. Figure 3 shows a 3-color composite image of CPD 592661 and its surroundings in near-IR emission lines made from NTT/SOFI data, and Figure 4 shows the same for the , , and broadband filters.
2.3 Optical Spectroscopy
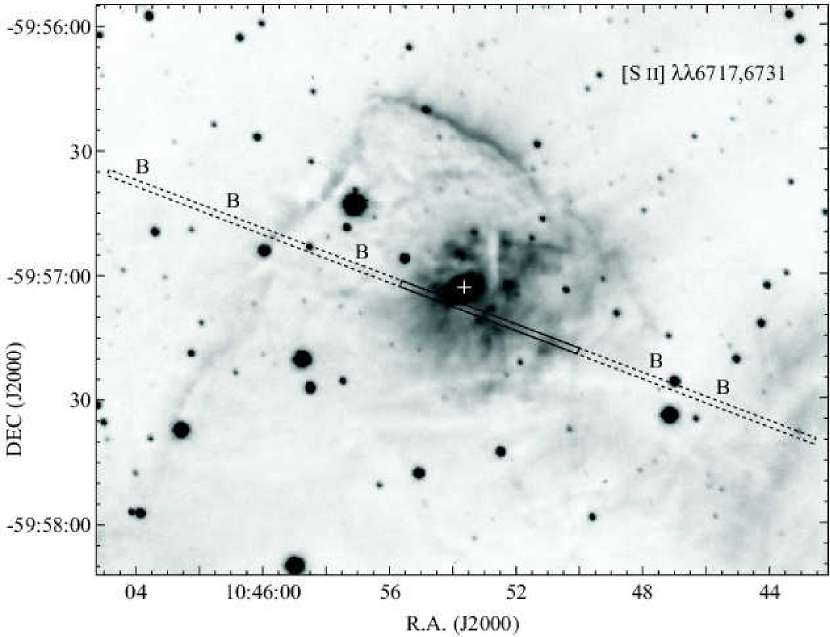
Low-resolution () spectra from 3600 to 9700 Å were obtained on 2002 March 1 and 2 using the RC Spectrograph on the CTIO 1.5-m telescope. Long-slit spectra were obtained with the 15-wide slit aperture oriented at P.A.60 offset about 1 south of CPD 592661 as shown in Figure 5. The pixel scale in the spatial direction was 13. Spectra were obtained on two separate nights in two different wavelength ranges (blue, 3600-7100 Å, and red, 6250-9700 Å), with total exposure times and other details listed in Table 1. Sky subtraction was accomplished by observing a blank sky position roughly 25 south. Sky conditions were mostly photometric, although a few thin transient clouds were present on the night of March 2 when the blue spectrum was obtained. Flux calibration and telluric absorption correction were accomplished using similar observations of the standard stars LTT-3218 and LTT-2415.
Although the long-slit spectra were sky subtracted, the spectrum of our target is contaminated by bright emission from the background Carina nebula H ii region. This background was subtracted using a fit to several positions in the background sky on either side of the target (the several background positions are labeled “B” in Figure 5). From the resulting background-subtracted long-slit spectra, we made an extracted one-dimensional (1-D) spectrum from a segment of the slit that sampled emission from the compact H ii region surrounding CPD 592661 (see Figure 5). The blue and red wavelength ranges of these extracted 1-D spectra were merged to form a single 3600-9700 Å spectrum, with a common dispersion of 2 Å pixel-1; the average of the two was taken in the region of the spectrum near H where the blue and red spectra overlapped. A small correction of about +5% was made to the absolute flux of the blue spectrum so that it matched the red in the overlapping region; this difference was probably due to the very thin transient clouds present on the second night when the blue spectrum was obtained. The final flux-calibrated spectrum is shown in Figure 6. Uncertainty in the absolute flux calibration is roughly 10%, but our analysis of the spectrum below relies on relative line fluxes, where uncertainty in the reddening and measurement errors (for faint lines) dominate the results.
Observed intensities of many relevant lines are listed in Table 2, relative to H=100. Uncertainties in these line intensities vary depending on the strength of the line and the measurement method. The integrated fluxes of isolated emission lines were measured; for these, brighter lines with observed intensities greater than 10 in Table 2 typically have measurement errors of a few percent, and weaker lines may have uncertainties of 10 to 15%. The uncertainties increase somewhat at the blue edge of the spectrum. Blended pairs or groups of lines were measured by fitting Gaussian profiles. For brighter blended lines like H+[N ii] and [S ii], the measurement uncertainty is typically 5 to 10%. Obviously, errors will be on the high end for faint lines adjacent to bright lines, and errors will be on the low end for the brightest lines in a pair or group, or lines in a pair with comparable intensity. Table 2 also lists dereddened line intensities. The reddening used to correct the observed line intensities was determined by comparing observed strengths of Hydrogen lines to the Case B values calculated by Hummer & Storey (1987). As shown in Figure 7, the observed Balmer and Paschen decrements suggest a value for of roughly 0.650.04, using the reddening law of Cardelli, Clayton, & Mathis (1989) with , which is appropriate for local extinction from dust clouds around the Keyhole nebula (Smith 1987; Smith 2002). This is close to the value of =0.6 derived by Walsh (1984) for the star CPD 592661. Table 3 lists representative physical quantities like electron density and temperature derived from a standard deductive nebular analysis of the usual line ratios (e.g., Osterbrock 1989). These are useful to guide photoionization models described below in §4. The “model” line intensities listed in the last column of Table 2 will be discussed in §4.
3 IMAGES OF THE NEBULOSITY
At visual wavelengths (Figure 2), CPD 592661 is found roughly at the center of diffuse emission-line nebulosity extending to radii of 15-20 (roughly 0.2 pc), as noted by Thackeray (1950) and Walsh (1984). Filamentary structure is also seen farther from the star, especially in [S ii], which appears to outline part of a dark dust pillar seen as a silhouette in [O iii] and H in Figure 2.
Images at near-IR wavelengths that penetrate the dust screen clearly suggest a more interesting morphology. Instead of a single star surrounded by diffuse nebulosity, Figures 3 and 4 show that CPD 592661 is a member of a rich cluster of stars in a cavity embedded inside the head of an externally-illuminated dust pillar. The wall of the cavity (seen best in H2 2.122 emission in Fig. 3) has a radius of roughly 25 (0.3 pc), which is larger than the nebulosity seen at visual wavelengths. We refer to this cluster and the surrounding nebulosity as the “Treasure Chest”, because the morphology is reminiscent of an opened container with sparkling riches inside.444One usually expects to find a treasure chest at the bottom of the sea in a sunken pirate ship. Following this vein, we point out a molecular globule roughly 2 to the west/southwest of the Treasure Chest, with a morphology that begs to be called the “Sea Horse” nebula. Additionally, many tadpole-shaped globules are seen throughout the Carina nebula (Smith et al. 2003). The embedded cluster and cavity inside the head of a dust pillar are reminiscent of the “Mount St. Helens” pillar in 30 Doradus (Walborn 2001), but perhaps at a somewhat earlier phase just before it has removed its summit. The presence of a compact cluster implies ongoing massive star formation (consistent with the O9.5 V spectral type of CPD 592661; Walsh 1984), as compared to the previously documented cases of intermediate- and low-mass star formation in Carina (Smith et al. 2004a, Megeath et al. 1996).
The multiwavelength emission-line structure of the outer edges of the dust pillar is consistent with an externally-ionized photoevaporative flow from the surface of a dense molecular cloud (see the discussion of the Finger globule in the northern part of the Carina nebula; Smith et al. 2004b). Limb-brightened [S ii] emission is seen at the edge of the cloud (the ionization front) with more extended H and [O iii] at larger distances in the ionized evaporative flow. A thin layer of H2 emission is seen behind the ionization front, indicating a dusty and geometrically thin photodissociation region reaching column densities of 1022 cm-2. The eastern side of the dust pillar has a remarkably straight edge pointing back toward Carinae and the Tr16 cluster in the heart of the Carina nebula (see Fig. 1), much like the globule associated with HH 666 (Smith et al. 2004a), suggesting that Car or other massive stars in Tr16 were responsible for shaping the Treasure Chest.
Figure 2 indicates severely non-uniform extinction across the field of view; both on large spatial scales associated with the foreground of the Carina nebula, and on smaller scales associated with compact clumps within the dust pillar, superposed on the compact H ii region around CPD 592661. Thus, the value of =0.65 that we derived earlier (Table 3 and Fig. 7) indicates a representative average, while the true reddening may vary strongly with position.
The visual-wavelength emission lines apparently trace only a part of the ionized cavity that is beginning to break out of its surrounding cocoon. Walsh (1984) observed line splitting of 25 km s-1 at the position of the nebula, indicating expansion at roughly 12 km s-1 (near the sound speed). However, emission-line images show no clear evidence for outflow activity like highly-collimated bipolar Herbig-Haro jets (Reipurth & Bally 2001) or wider-angle bipolar outflows that would likely be seen in shock tracers such as [S ii], [Fe ii], or H2 emission. Nothing like the dramatic outflow from the BN/KL region of Orion (Salas et al. 1999; Schild et al. 1997; Genzel & Stutzki 1989; Shuping et al. 2004) is seen here, even though the inferred luminosity of 106.6 L⊙ (Rathborne et al. 2004) is significantly higher than BN/KL.
The expansion speed of 12 km s-1 observed by Walsh (1984) implies an age for the cavity (radius of 25 or 0.3 pc) of a few 104 yr. This cavity size is also much smaller than a typical Strömgrem sphere for an O9.5 V star and an ambient density of 500 cm-3 (Table 3), which would be almost 1 pc. The young dynamic age and the small size of the cavity compared to the expected Strömgren sphere radius suggest that the cluster around CPD 592661 is extrememly young, and that the cavity is just in the initial stages of expansion. Alternatively, the H ii region may be dusty, and grains may absorb a large fraction of the Lyman continuum luminosity. In any case, the compact H ii region is probably caught in the early phases of breaking out of and destroying the head of the surrounding dust pillar. Thus, the H ii region is not in photoionization equilibrium, which may affect the analysis of the spectrum in the next section. Judging by the morphology in Figures 3 and 4, the expansion of the cavity seems to be encountering less resistance toward the southwest, while a significant reservior of molecular material impedes its expansion toward the northeast (see also Rathborne et al. 2004). Note that many of the reddened stars that are presumably cluster members are also located toward the north and northeast of CPD 592661 near the edge of the cavity (Fig. 4).
Finally, we note that the bright star located 30 northeast of CPD 592661 (at =10h45m573, =595643) is probably not a member of the embedded cluster. This star (Hen 3-485=Wra 15-642) is a Be star and is therefore somewhat evolved, and so it is probably too old to be associated with the extremely young cluster around CPD 592661. Instead, Massey & Johnson (1993) considered it to be a member of Tr16. It also appears somewhat disconnected from the bright nebulosity around CPD 592661, and may be in the foreground of the Treasure Chest, while still within the confines of the larger Carina nebula.
4 SPECTROSCOPIC ANALYSIS OF THE H ii REGION
To understand the dereddened spectrum of the nebula around CPD 592661 quantitatively, we employed the spectral synthesis code cloudy (Ferland 1996), using simplified assumptions about the geometry and other factors gleaned from the analysis above. We approximated the nebula as a 0.5 pc sphere filled with a density555This density comes from the electron density in Table 3, derived from the relative intensities of the [S ii] 6717,6731 lines observed in the nebula. =500 cm-3, and with the density rising slightly to 600 cm-3 at the outer edge. We used cloudy’s standard H ii region abundances and dust content (similar to the Orion nebula; see Ferland 1996). A range of properties for the ionizing source was tested; the best results were found using a blackbody with T=31,500 K and L=8104 L⊙. This is typical for a main-sequence O 9.5 V star, in agreement with the observed spectral type of CPD 592661 (Walsh 1984). To adequately match the observed spectrum, however, we needed to adjust this blackbody by extinguishing roughly half the hydrogen and helium ionizing photons. This provided much better results than simply using a cooler blackbody, for example, which has a different spectral energy distribution in the UV. The rationale for the depletion of ionizing photons in the model might be that the nebula around CPD 592661 is not in equilibrium, while cloudy is an equilibrium code. The cavity’s observed size in Figure 3 is smaller than a Strömgren sphere for an O 9.5 V star, and it is observed to be expanding (Walsh et al. 1984). In that case, one can interpret the deficit of ionizing photons as ionizations not balanced by recombinations as the nebula increases in size (another way to approximate the observed spectrum was to simply use a larger radius than observed). With these input assumptions, the model produced a fair approximation of the observed line intensities, and ionizing photons were used-up near the model nebula’s outer boundary as the gas became fully molecular, as expected for the observed cavity.
However, some discrepancies between the simple model and the observed spectrum were difficult to reconcile without modifying the chemical abundances. Important cooling lines of S and O in the visual spectrum were too weak, and N lines were too strong. Therefore, we lowered the abundance of N by 20%. This adjustment allowed the [N ii] lines to be fit satisfactorally, and also increased the strength of [S ii], [S iii], and [O ii] lines as they took on the additional burden of cooling the nebula.666The Ne abundance was also increased to account for some additional cooling in order to match the observed electron temperatures in Table 3; however, this ad hoc adjustment could be any additional source of cooling and is in no way a true indicator of an enhanced Ne abundance. The final spectrum with these slightly modified abundances matched the observed spectrum quite well, and several important lines predicted by the model are listed in Table 2 for comparison with the dereddened line intensities. H and He line intensities are reproduced well; in fact, the perfect agreement of H suggests that our reddening value of =0.65 is correct. Important forbidden cooling lines and temperature/density diagnostics are also well matched, with the exceptions noted below.
There are still two unsatisfying discrepancies between our model predictions in Table 2 and the dereddened spectrum of the nebula around CPD 592661. First, the model underpredicted the strength of [O ii] 3726,3729 by 14%. Other lines in the spectrum were over- or under-predicted by similar amounts in our model, but [O ii] 3726,3729 is one of the strongest lines in the nebula and an important coolant, so the poor agreement is bothersome. Simply increasing the oxygen abundance would not fix this problem, because the increased cooling would dramtically affect the rest of the spectrum, and it would cause additional problems because the intensities of the red [O ii] lines are matched quite well by the current model. One possible explanation is that our observed spectrum has relatively large calibration uncertainty at the blue end of the spectrum, which is enough to account for [O ii] 3726,3729. A second (and even more severe) discrepancy between our model and the observed/dereddened spectrum of CPD 592661 is that our model underpredicts the [O iii] lines by about a factor of two. We could not fix this discrepancy in a satisfactory way with adjustments to the model; increasing the effective temperature of the ionizing source enough to match the [O iii] intensities, for example, would dramatically increase the strengths of He i and [S iii] lines as well (some of which are already too strong). The only potential solution to this underestimate of the model [O iii] lines is that the observed spectrum of the nebula around CPD 592661 may be contaminated by emission from gas along the line of sight in the Carina nebula outside the dust pillar. Although we tried to carefully subtract the background nebular emission, the local extinction is patchy (Fig. 2). The background Carina nebula has extremely strong [O iii] lines (e.g., Smith & Morse 2004; Smith et al. 2004b), and even a small amount of contamination might account for the discrepancy.
In summary, with the caveats that 1) we needed to make a minor adjustment to the N abundance, 2) we needed to extinguish some of the ionizing photons to account for the non-equilibrium state of the nebula, and 3) we needed to invoke some contamination of the [O iii] lines from the surrounding Carina nebula, we were able to match the observed spectrum of the nebula around CPD 592661 in a satisfactory way with a simple geometry that was consistent with the observed morphology in images, and using an ionizing source consistent with an O 9.5 V star, which is the observed spectral type of CPD 592661 itself (Walsh 1984). This proves that CPD 592661 is indeed the dominant ionizing source of the Treasure Chest and is likely a member of the embedded star cluster seen in IR continuum images, as discussed below in §5.
5 STELLAR CONTENT
To conduct a preliminary stellar census of the cluster associated with the Treasure Chest, we present an analysis of the photometry of point sources in our broad-band near-IR images (§2.2). We begin by describing the identification of all stellar sources, including completeness limits, and our measurement of their magnitudes and colors. We then place the stars on an vs. color-magnitude diagram (CMD) and compare their placement with appropriate pre–main-sequence (PMS) isochrones to derive a likely cluster age. Next, we study and colors to determine the fraction of stellar sources with IR excesses indicative of circumstellar disks. Finally, we present a K-band luminosity function (KLF) for the cluster which will serve as the basis for a follow-up study of the cluster’s initial mass function.
5.1 photometry
We performed standard point-spread-function (PSF) photometry on our images using the IRAF daophot package. Stellar point sources were identified with daofind using a signal-to-noise ratio of 5. An empirical, spatially variable, model PSF was constructed separately for each image using bright and relatively isolated stars. To construct the cleanest model PSF possible, we disregarded stars at the very center of the images, where the nebular emission is strongest. At the same time, it was necessary to exclude PSF stars near the edges of the field of view because the PSF is highly spatially variable and it is in the center of the images where the PSF is best and where the stars of greatest interest reside. Thus, we carefully selected PSF stars just at the periphery of the strong nebular background.
Owing to the strong and spatially variable nature of the nebular background emission, we performed the PSF photometry in an iterative fashion with the aim of accurately modeling and subtracting this background. First, we subtracted all stellar sources identified by daofind, and then interpolated the background over the positions of the subtracted sources, to produce a model of the nebular background alone. This background was then subtracted from the original image, and the PSF photometry performed anew on this background-subtracted image, with the background in the PSF fitting now fixed at zero. We were not able to derive photometry for CPD 592661 itself, since this bright star was saturated in our images.
Stellar fluxes derived from the PSF fitting were converted to magnitudes on the CIT system using the photometric zero-points and color terms determined by the 2MASS777See http://www.ipac.caltech.edu/2mass/releases/allsky/doc/sec6_4b.html. project. From inspection of histograms of the magnitudes so derived, we find that we are sensitive to magnitudes of 20.4, 19.2, and 18.1, respectively. To determine our completeness limits in , we used the IRAF package artdata to add artificial stars of varying brightness to the original images. We successfully recovered 90% of these artificial stars at magnitudes of 19.3, 18.2, and 17.2, respectively. These then define our 90% completeness limits.
5.2 Cluster boundary and “background” region
In order to distinguish the properties of the young stars in the Treasure Chest from those of the young stellar population likely associated with the surrounding star-forming region, we defined a cluster boundary by tracing the edge of the nebular emission visible in our narrow-band images (§3; Fig. 3). This marks the boundary of the surrounding elephant trunk that harbors the embedded cluster.
We also defined a circular annulus around this cluster boundary as a “background” region for comparison. To be sure, this region does not sample a truly background stellar population, in the sense that this region is likely to be dominated by young stars in the Carina star-forming region, not just foreground and background field stars. But defining the background region in this way will allow us to characterize the stellar population in the Treasure Chest cluster separately from that of other young stars in the immediate vicinity of the cluster. In the analysis that follows, we will differentiate between stars in the “cluster” and “background” regions so defined.
5.3 Stellar number density
From our image we can determine the surface number density of stellar point sources in the Treasure Chest cluster. At a distance of 2.3 kpc, our image scale of 027 pixel-1 corresponds to 0.003 pc pixel-1. We have measured the surface number density by counting stars in boxes 3333 pixels, corresponding to 0.10.1 pc. In the background annulus region, we detect an average stellar surface number density of 250 pc-2, while in the cluster region itself we detect a maximum of 1020 pc-2 in the northern part of the cluster.
This is almost certainly a lower limit to the true cluster density, as even in our image we can see clear traces of extinction, and in our analysis below we find stars whose colors indicate significant extinction, (see §5.4). Deeper images at 2 m will presumably detect even more sources, although at our current completeness limit of (§5.1), the KLF for the cluster region already blends into the KLF of the background region (see §5.6).
Nonetheless, we can say here that the maximum stellar surface number density in the Treasure Chest is at least pc-2 (i.e., from 1020–250, as noted above), which is comparable to that found in other rich young clusters, such as IC348 (Lada & Lada 1995), though probably not as high as that found in NGC 2024 (Haisch et al. 2000) and the Trapezium (Hillenbrand & Hartmann 1998).
5.4 Color-magnitude diagram
Within the cluster boundary defined above, we detected 172 point sources in our image, 194 in our image, and 199 in our image. Of these, 156 are common to all three images, and 183 are detected in both the and images.
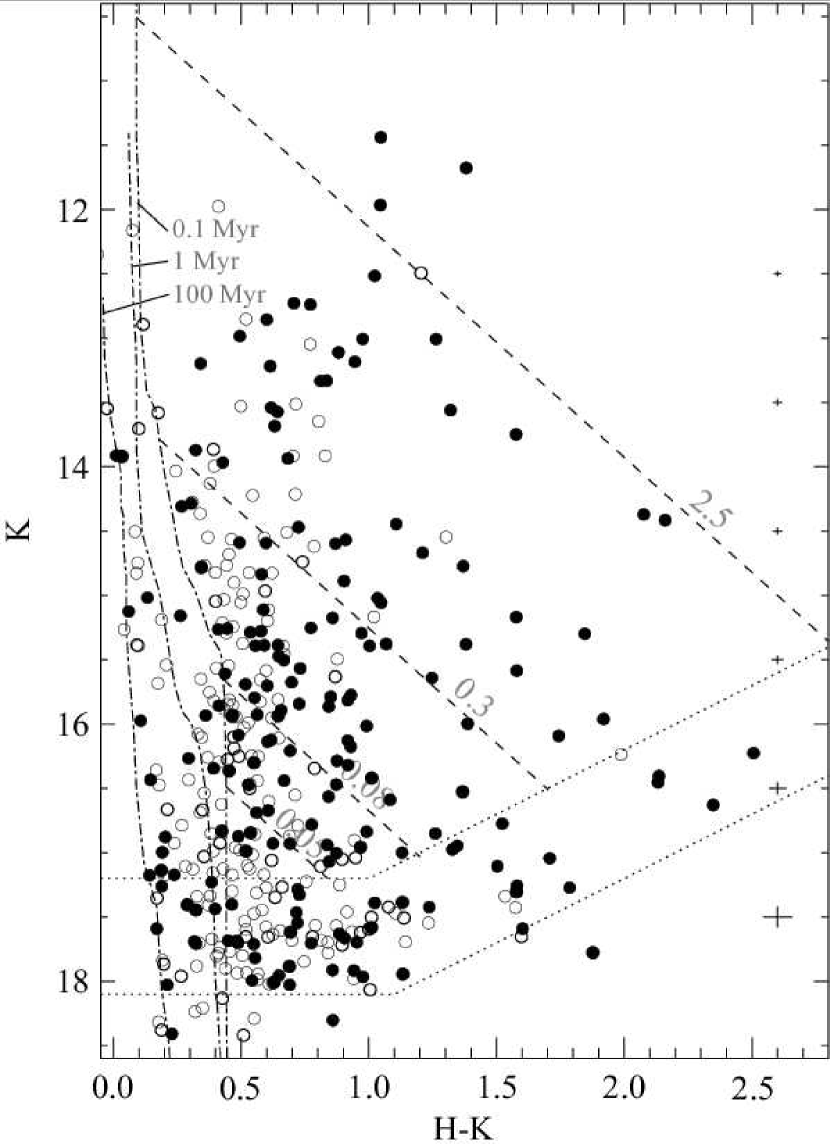
The vs. CMD for stars in the cluster and background regions is shown in Figure 8. Stars located within the cluster region are displayed as filled points. Dot-dashed lines represent isochrones for stars with masses from 0.02 M⊙ to 3.0 M⊙, at ages of 0.1 Myr, 1 Myr, and 100 Myr, from the PMS models of D’Antona & Mazzitelli (1997), assuming a cluster distance of 2.3 kpc. The isochrones have been transformed from the plane to the plane using the relationship between and bolometric corrections compiled by Muench et al. (2002). Dashed lines are reddening vectors for stars with masses of 2.5 M⊙, 0.3 M⊙, 0.08 M⊙, and 0.05 M⊙, and extinctions of 70, 40, 20, and 10 mag, respectively. These extinction vectors assume the reddening law of Bessell & Brett (1988) and a ratio of total-to-selective extinction, , of 4.8 (see Smith 2002). Dotted lines represent our sensitivity and completeness limits. Crosses along the right side of the figure represent typical observational error bars at various magnitudes. Our photometry is evidently complete for a star at the hydrogen-burning limit (0.08 M⊙), at an age of 0.1 Myr, seen through mag of extinction.
The CMD of the Treasure Chest cluster exhibits several interesting features that provide some insight into the nature of its stellar population. First, the majority of sources in the cluster region (filled circles) show very red colors, consistent with a young population of stars still embedded in significant quantities of intervening dust. Indeed, we find stars with extinctions as large as . This population of highly reddened stars exists in the background annulus region as well (open circles), indicating the presence of significant numbers of young stars in the surrounding star-forming region.
Comparison with the PMS isochrones of D’Antona & Mazzitelli (1997) provides further indications of extreme stellar youth. For stellar magnitudes down to , the cluster stars (filled circles) display a marked blue “edge” that is well traced by the 0.1 Myr isochrone, with a marked decrease in the number of stars blueward of that isochrone. For , the 0.1 Myr isochrone begins to merge in color with the 1 Myr isochrone, which may be more representative of the young stellar population associated with the surrounding star-forming region. At these faint magnitudes, particularly at , we also begin to see a significant number of stars in both the cluster and background regions with blue colors indicative of main-sequence and giant field stars.
5.5 Color-color diagram
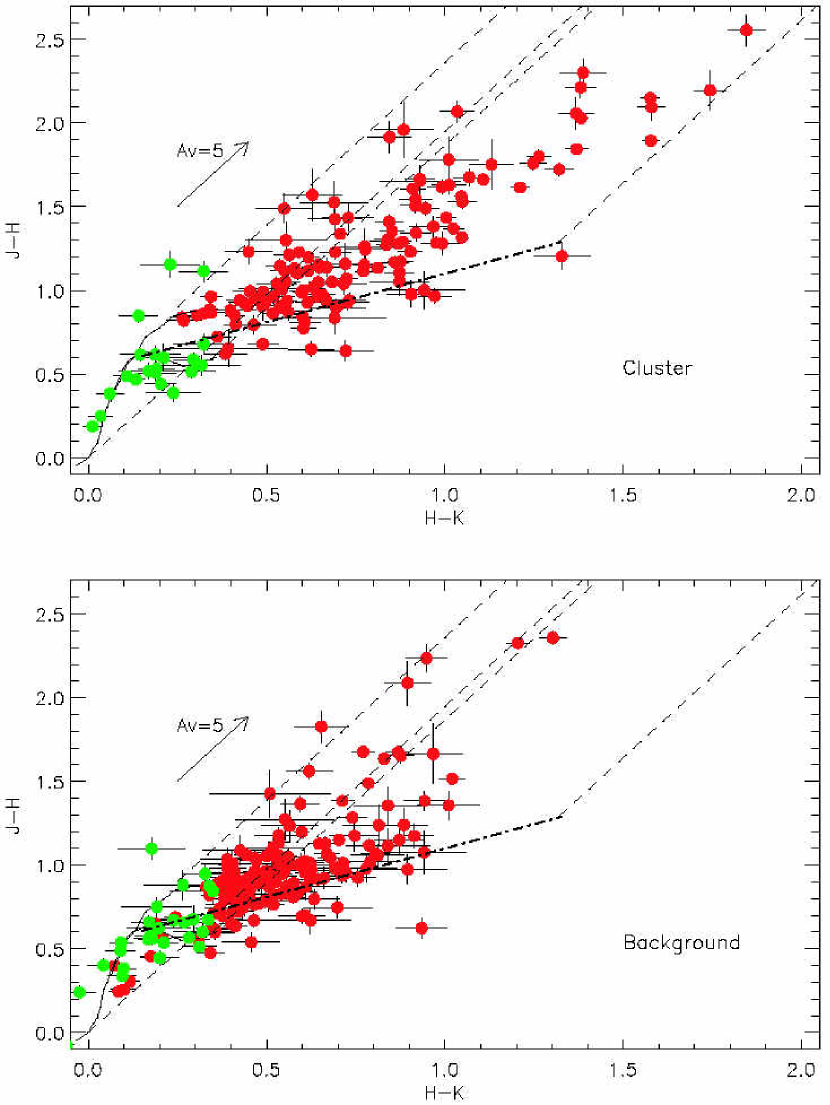
In Figure 9 we show a vs. color-color diagram for the stars that we detected in all three passbands. The upper panel shows stars within the cluster boundary defined above, while the lower panel shows stars within the background annulus. Solid lines represent the colors of main-sequence stars and giants from Bessell & Brett (1988), transformed to the CIT system. Dashed lines represent reddening vectors emanating from the extrema of the main-sequence and giant colors. Stars within these reddening vectors are consistent with reddening due to intervening interstellar dust, although small amounts of reddening due to circumstellar material cannot be ruled out.
In both panels, red points represent stars redward of the 1 Myr isochrone in the CMD (Fig. 8), whereas green points represent stars blueward of this isochrone, and which are therefore unlikely to be young stars associated with the Treasure Chest or the surrounding star-forming region. Indeed, with few exceptions the green points follow the main-sequence and giant color relations closely.
The dash-dotted line is the locus of classical T Tauri stars from Meyer et al. (1997). Stars on or above this line and to the right of the dashed lines are those with IR excesses indicative of massive circumstellar disks. Both the cluster and background regions show evidence for stars with disks. However, such stars are found in higher proportion in the cluster region. In the cluster region, 67% of likely cluster members (red points) show evidence for circumstellar disks; in the background region this fraction is 44%.
The large disk fraction found for the cluster region is almost certainly a lower limit to the true disk fraction, since photometry is not the most sensitive tracer of disks. For example, in NGC 2024 (age Myr) Haisch et al. (2000) found a disk fraction of from analysis of its excess fraction, but found a much higher disk fraction of when they included -band photometry in the analysis. That the disk fraction we find in the Treasure Chest is larger than that found in NGC 2024 via photometry suggests that the true disk fraction in this cluster may prove to be among the highest yet seen for a young cluster, and further corroborates the extremely young age from our analysis of the CMD (§5.4).
5.6 -band luminosity function
One of our principal aims in studying the Treasure Chest is ultimately to measure the mass spectrum of an extremely young cluster that may have been triggered by an earlier episode of nearby, massive star formation. One of the primary means for determining the initial mass function (IMF) of a young cluster is by analysis of its KLF (Muench et al. 2002).
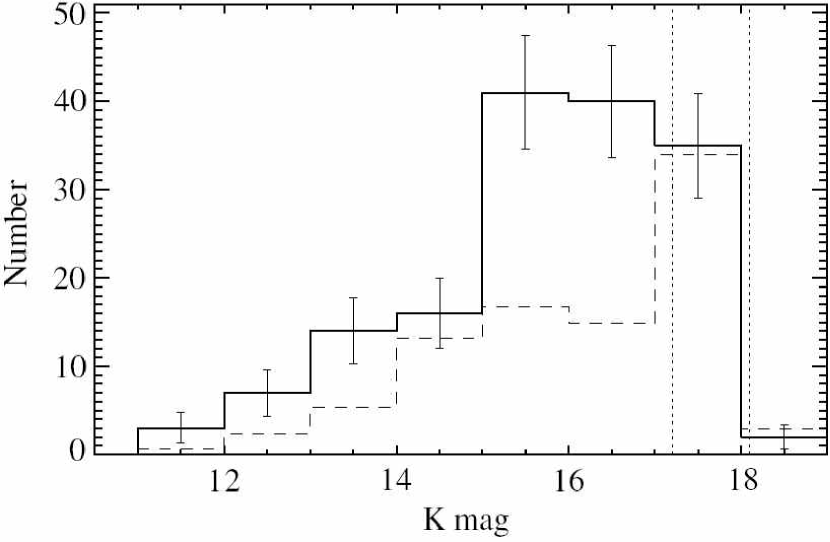
The KLF of the Treasure Chest cluster is shown in Figure 10, which includes only stars redward of the 0.1 Myr isochrone in the CMD. The dashed histogram shows the corresponding KLF for stars in the background annulus region, scaled to the same spatial area as the cluster region.
The KLF shows a clear excess of stars over the background for all down to our completeness limit. We can place a lower limit on the number of members in the Treasure Chest cluster by summing over the cluster KLF after subtracting the background KLF. We find a lower limit of 69 stars down to our completeness limit. For , the cluster KLF merges with the KLF of the surrounding star-forming region. Thus, while deeper imaging of the cluster may identify additional stars, it may prove difficult to statistically separate members of the Treasure Chest cluster from members of the surrounding nebula for ( M⊙ with at an age of Myr).
6 SUMMARY AND CONCLUSIONS
We have undertaken a detailed observational analysis of a dust pillar in the Carina nebula called the Treasure Chest, as well as its associated embedded star cluster. Narrowband images, visual-wavelength spectra, and broadband near-IR photometry point toward the following main conclusions, all of which provide independent evidence of extreme youth:
1. Emission-line images of the Treasure Chest reveal an embedded star cluster occupying a cavity inside the head of an externally-ionized dust pillar, and part of the embedded compact H ii region appears to be breaking out of the dust pillar into the surrounding giant H ii region. The dust pillar points toward Carinae and other stars in the Tr16 cluster, raising suspicion that the birth of this young cluster was triggered by feedback from nearby massive stars.
2. The visual-wavelength spectrum of ionized gas from the cavity that is breaking through the dust cocoon is ionized by a late O-type star, consistent with the spectral type of O 9.5 V derived for the central star CPD 592661 by Walsh (1984).
3. Analysis of the color-magnitude diagram of the embedded cluster suggests that it has an age 0.1 Myr, which is in reasonable agreement with the dynamical age of the expanding nebular cavity (a few times 104 yr).
4. Stellar photometry also reveals several members of the cluster that are highly embedded, with extinction values as high as 50. This is much higher than the average extinction for the ionized gas or CPD 592661 itself, suggesting that CPD 592661 and its compact H ii region are breaking out of the dust pillar on the side facing the Earth, while star formation in the cloud may be continuing on the far side.
5. Two-thirds of the cluster members show strong IR excess emission indicative of cirumstellar disks, but the fraction may be much higher if longer-wavelength data are considered. Thus, the disk fraction for the Treasure Chest cluster may be among the highest yet seen for any young clusters. Some field stars outside the cluster (but still within the Carina nebula) also show IR excess indicative of young disks, but the fraction is lower than in the cluster itself.
We have also provided a preliminary K-band luminosity function, which suggests that new data with higher spatial resolution and sensitivity will allow us to accurately measure the cluster’s mass function. The mass function of this particular cluster will be of great interest, because it is a “second-generation” cluster at the periphery of a giant H ii region.
References
- Bessell & Brett (1988) Bessell, M. S., & Brett, J. M. 1988, PASP, 100, 1134
- (2) Cardelli, J.A., Clayton, G.C., & Mathis, J.S. 1989, ApJ, 345, 245
- D’Antona & Mazzitelli (1997) D’Antona, F. & Mazzitelli, I. 1997, Memorie della Societa Astronomica Italiana, 68, 807
- (4) de Grauww, T., et al. 1981, A&A, 102, 257
- (5) Dutra, C.M., & Bica, E. 2001, A&A, 376, 434
- (6) Ferland, G.J. 1996, Hazy, a brief introduction to cloudy, Univ. Kentucky Department of Physics and Astronomy Internal Report
- (7) Genzel, R., & Stutzki, J. 1989, ARAA, 27, 41
- (8) Ghosh, S.K., et al. 1988, ApJ, 330, 928
- Haisch, Lada, & Lada (2000) Haisch, K. E., Lada, E. A., & Lada, C. J. 2000, AJ, 120, 1396
- (10) Harvey, P.M., Hoffmann, W.F., & Campbell, M.F. 1979, ApJ, 227, 114
- (11) Herbst, W. 1975, AJ, 80, 212
- Hillenbrand & Hartmann (1998) Hillenbrand, L. A., & Hartmann, L. W. 1998, ApJ, 492, 540
- (13) Hummer, D.G., & Storey, P.J. 1987, MNRAS, 224, 801
- Lada & Lada (1995) Lada, E. A., & Lada, C. J. 1995, AJ, 109, 1682
- (15) Massey, P., & Johnson, J. 1993, AJ, 105, 980
- (16) McCaughrean, M.J., & Andersen, M. 2002, A&A, 389, 513
- (17) Megeath, S.T., Cox, P., Bronfman, L., & Roelfsema, P.R. 1996, A&A, 305, 296
- Meyer, Calvet, & Hillenbrand (1997) Meyer, M. R., Calvet, N., & Hillenbrand, L. A. 1997, AJ, 114, 288
- Muench et al. (2002) Muench, A. A., Lada, E. A., Lada, C. J., & Alves, J. 2002, ApJ, 573, 366
- (20) Osterbrock, D.P. 1989, Astrophysics of Gaseous Nebulae and Active Galactic Nuclei (Mill Valley: University Science Books)
- (21) Rathborne, J.M., Brooks, K.J., Burton, M.G., Cohen, M., & Bontemps, S. 2004, A&A, 418, 563
- (22) Reipurth, B., & Bally, J. 2001, ARAA, 39, 403
- (23) Salas, L., Rosado, M., Cruz-Gonzalez, I., Gutierrez, L., Valdez, J., Bernal, A., Luna, E., Ruiz, E., & Lazo, F. 1999, ApJ, 511, 822
- (24) Schild, H., Miller, S., & Tennyson, J. 1997, A&A, 318, 608
- (25) Shuping, R.Y., Morris, M., & Bally, J. 2004, AJ, 128, 363
- (26) Smith, N. 2002, MNRAS, 331, 7
- (27) Smith, N., & Morse, J.A., 2004, ApJ, 605, 854
- (28) Smith, N., Bally, J., & Brooks, K.J. 2004a, AJ, 127, 2793
- (29) Smith, N., Bally, J., & Morse, J.A. 2003, ApJ, 587, L105
- (30) Smith, N., Egan, M.P., Carey, S., Price, S.D., Morse, J.A., & Price, P.A. 2000, ApJ, 532, L145
- (31) Smith, N., Barbá, R.H., & Walborn, N.R. 2004b, MNRAS, 351, 1457
- (32) Smith, R.G. 1987, MNRAS, 277, 943
- (33) Sugitani, K., Tamura, M., Nakajima, Y., Nagashima, C., Nagayama, T., Nakaya, H., Pickles, A.J., Nagata, T., Sato, S., Kukuda, N., & Ogaura, K. 2002, ApJ, 565, L25
- (34) Thackeray, A.D. 1950, MNRAS, 110, 524
- (35) Thompson, R.I., Smith, B.A., & Hester, J.J. 2002, ApJ, 570, 749
- (36) van den Bergh, S., & Herbst, W. 1975, AJ, 80, 208
- (37) Walborn, N.R. 1995, RevMexAA, Ser. Conf., 2, 51
- (38) Walborn, N.R. 2001, in Hot Star Workshop III: The Earliest Phases of Massive Star Birth, ed. P.A. Crowther (San Fracisco: ASP), 111
- (39) Walborn, N.R., et al. 2002, AJ, 123, 2754
- (40) Walsh, J.R. 1984, A&A, 138, 380
| Telescope | Instrument | Filter or | Exp. Time | Comment |
|---|---|---|---|---|
| Emiss. Lines | (sec) | |||
| CTIO 4m | MOSAIC | [O iii] 5007 | 240 | image |
| CTIO 4m | MOSAIC | H, [N ii] | 600 | image |
| CTIO 4m | MOSAIC | [S ii] 6717,6731 | 480 | image |
| NTT | SOFI | J | 150 | image |
| NTT | SOFI | H | 150 | image |
| NTT | SOFI | K | 150 | image |
| NTT | SOFI | Pa | 900 | image |
| NTT | SOFI | [Fe ii] 16435 | 900 | image |
| NTT | SOFI | H2 1-0 S(1) 21218 | 900 | image |
| CTIO 1.5m | RC Spec | blue; 3600-7100 Å | 1200 | long-slit, P.A.=69 |
| CTIO 1.5m | RC Spec | red; 6250-9700 Å | 1200 | long-slit, P.A.=69 |
| (Å) | I.D. | (Obs.) | (Dered.) | (Model) |
|---|---|---|---|---|
| 3726,9 | [O ii] | 132 | 237 | 207 |
| 3798 | H10 | 2.2 | 3.9 | |
| 3835 | H9 | 3.0 | 5.1 | |
| 3869 | [Ne iii] | 2.6 | 4.4 | |
| 3889 | H8, He i | 8.7 | 14.6 | 13.3 |
| 3970 | H | 8.0 | 12.8 | |
| 4069,76 | [S ii] | 2.7 | 4.3 | 3.9 |
| 4102 | H | 18.1 | 27.3 | 26.3 |
| 4340 | H | 36.1 | 48.3 | 47.0 |
| 4861 | H | 100 | 100 | 100 |
| 4959 | [O iii] | 12.1 | 11.4 | 5.5 |
| 5007 | [O iii] | 35.9 | 33.0 | 15.8 |
| 5041 | Si ii | 1.2 | 1.1 | |
| 5056 | Si ii | 0.89 | 0.79 | |
| 5199 | [N i] | 1.4 | 1.1 | |
| 5755 | [N ii] | 1.4 | 0.89 | 0.8 |
| 5876 | He i | 5.0 | 3.0 | 3.7 |
| 6300 | [O i] | 2.8 | 1.4 | 1.0 |
| 6312 | [S iii] | 0.97 | 0.49 | 0.6 |
| 6347 | Si ii | 1.4 | 0.70 | |
| 6364 | [O i] | 1.6 | 0.80 | |
| 6371 | Si ii | 0.88 | 0.43 | |
| 6548 | [N ii] | 87.4 | 40.3 | 39.9 |
| 6563 | H | 643 | 295 | 295 |
| 6583 | [N ii] | 249 | 113 | 117 |
| 6678 | He i | 2.4 | 1.0 | 1.0 |
| 6717 | [S ii] | 61.4 | 26.6 | 26.8 |
| 6731 | [S ii] | 58.5 | 25.3 | 25.4 |
| 7065 | He i | 1.3 | 0.49 | 0.7 |
| 7136 | [Ar iii] | 5.6 | 2.1 | 3.1 |
| 7319,20 | [O ii] | 5.2 | 1.8 | 1.9 |
| 7330,31 | [O ii] | 4.7 | 1.6 | 1.6 |
| 7612 | [Fe ii] | 15.1 | 4.7 | |
| 7751 | [Ar iii] | 1.6 | 0.48 | 0.7 |
| 8446 | O i | 9.7 | 2.3 | |
| 8665 | Pa13 | 4.9 | 1.1 | |
| 8750 | Pa12 | 6.9 | 1.5 | |
| 8863 | Pa11 | 7.4 | 1.5 | |
| 9015 | Pa10 | 18.9 | 3.7 | |
| 9069 | [S iii] | 108 | 20.8 | 27.1 |
| 9229 | Pa9 | 17.5 | 3.2 | |
| 9532 | [S iii] | 352 | 59.8 | 67.2 |
| 9546 | Pa8 | 19.9 | 3.4 | |
| 9615 | Fe ii | 5.1 | 0.8 | |
| 9711 | [Fe ii] | 13.3 | 2.2 |
| Parameter | units | Value |
|---|---|---|
| E(BV) | mag. | 0.65 |
| ne [S ii] | cm-3 | 490100 |
| Te [N ii] | K | 8100650 |
| Te [O iii] | K | 20,000 |
| Te [S iii] | K | 7000700 |