XMM-Newton and optical follow-up observations of three new Polars from the Sloan Digital Sky Survey1,2
Abstract
We report follow-up XMM-Newton and optical observations of three new polars found in the Sloan Digital Sky Survey. Simple modeling of the X-ray spectra, and consideration of the details of the X-ray and optical lightcurves corroborate the polar nature of these three systems and provide further insights into their accretion characteristics. During the XMM-Newton observation of SDSS J072910.68+365838.3, X-rays are undetected apart from a probable flare event, during which we find both the typical hard X-ray bremsstrahlung component and a very strong O VII ( keV) line, but no evidence of a soft blackbody contribution. In SDSS J075240.45+362823.2 we identify an X-ray eclipse at the beginning of the observation, roughly in phase with the primary minimum of the optical broad band curve. The X-ray spectra require the presence of both hard and soft X-ray components, with their luminosity ratio consistent with that found in other recent XMM-Newton results on polars. Lastly, SDSS J170053.30+400357.6 appears optically as a very typical polar, however its large amplitude optical modulation is out of phase with the variation in our short X-ray lightcurve.
Subject headings:
individual: (SDSS J072910.68+365838.3, SDSS J075240.45+362823.2, SDSS J170053.30+400357.6) — novae, cataclysmic variables — stars: magnetic — X-rays: stars1. Introduction
| SDSS J | UT Date | Obs | UT Time | Approx. V | Comments |
|---|---|---|---|---|---|
| 0729 | 2002 Jan 07 | NOFS | 05:06 – 10:49 | 19.8–20.7 | open filter photometry |
| 2002 Oct 31 | APO: DIS | 10:40 – 11:10 | 20.6 | spectrum | |
| 2002 Oct 31 | XMM-Newton: EPIC-pn | 20:39 – 22:16 | 5282s live timeaaThe live time of the X-ray CCD detectors refers to the sum of the good-time intervals, less any dead time. It is typically much less than the difference of observation start and stop times. | ||
| XMM-Newton: EPIC-MOS1/2 | 20:16 – 22:21 | 7358/7392s live time | |||
| XMM-Newton: OM | 20:25 – 22:26 | 20.7 | 5999s duration, filter | ||
| 2003 Sep 22 | SO: SPOL | 1800s, spectropolarimetry, pol. | |||
| 2003 Nov 01 | MMT: SPOL | 1600s, spectropolarimetry, pol. | |||
| 2004 Feb 16 | SO: SPOL | 2880s, spectropolarimetry, pol. | |||
| 0752 | 2002 Oct 31 | NOFS | 08:33 – 13:03 | 17.8–19.1 | open filter photometry |
| 2002 Oct 31 | APO: DIS | 11:22 – 11:37 | 17.5 | spectrum | |
| 2002 Oct 31 | XMM-Newton: EPIC-pn | 23:40 – 01:17 | 4019s live time | ||
| –Nov 01 | XMM-Newton: EPIC-MOS1/2 | 23:18 – 01:22 | 5990s live time | ||
| XMM-Newton: OM | 23:27 – 01:28 | 6002s duration, filter | |||
| 2003 Nov 01 | MMT: SPOL | 2400s, spectropolarimetry, pol. | |||
| 1700 | 2003 Aug 11 | XMM-Newton: EPIC-pn | 16:57 – 19:29 | 2659s live time | |
| XMM-Newton: EPIC-MOS1/2 | 16:34 – 17:07 | 3546/3561s live time | |||
| XMM-Newton: OM | 17:53 – 19:34 | data lost | |||
| 2003 Jul 02 | NOFS | 03:42 – 10:48 | 17.9–19.5 | open filter photometry | |
| 2003 Aug 08 | MRO | 05:09 – 11:38 | open filter photometry | ||
| 2003 Aug 09 | MRO | 04:44 – 11:11 | open filter photometry | ||
| 2003 Aug 10 | MRO | 04:44 – 10:57 | 18.5–19.7 | filter photometry |
The polars (or AM Her stars) possess the strongest magnetic fields (MG) amongst Cataclysmic Variables (CVs). In these systems, the plasma transferred from the secondary does not form an accretion disc, but instead the gas is threaded onto the field lines and accretes at the poles on the white dwarf (WD) surface. In the simplest picture, a strong shock develops in the accretion column, above the surface, as the flow transitions from its high (approximately free-fall) velocity to a subsonic flow that can settle on the WD. The post-shock flow is a strong source of hard X-rays, mostly emitted as a thermal Bremsstrahlung continuum (with keV), although line emission can also be important. Further cooling occurs via cyclotron emission in the optical/IR, but is typically an order of magnitude smaller. Half of the hard X-ray photons will be incident on the WD photosphere, heating it, so that it is a source of soft blackbody emission (with keV). For an X-ray albedo (Williams et al., 1987), and neglecting the cyclotron contribution, the soft-hard energy balance is then expected to be (King & Watson, 1987). However, observations of polars found in some cases (but not all) a large discrepancy with (see Ramsay et al., 1994, and references therein), which was termed the “soft X-ray excess.” The explanation appears to lie in the details of the accretion flow, it is both inhomogeneous, consisting of high and lower density regions, and likely blobby. The former leads to a hard X-ray deficiency, since the bulk of this emission arises from the highest density region, which may involve a small fraction of the total flow. The latter leads to enhanced blackbody. In addition to the irradiation heating of the WD photosphere, if the flow is blobby the longest/most dense blobs of material are able to penetrate deeply, before being shocked, and hence the energy released is thermalized before emission. Lastly, at the very lowest specific accretion rates the flow degenerates into a bombardment solution (Kuijpers & Pringle, 1982), where there are no accretion shocks and the heating of the WD photosphere is also sufficiently weak that we expect no X-ray emission. For a review of the various accretion regimes see Wickramasinghe & Ferrario (2000).
The Sloan Digital Sky Survey (SDSS) is in its fourth year of a multi-color photometric imaging and spectroscopic survey, which will eventually cover 25% of the celestial sphere (Abazajian et al., 2003, 2004a, 2004b; Fukugita et al., 1996; Gunn et al., 1998; Hogg et al., 2001; Lupton et al., 1999, 2001; Pier et al., 2003; Smith et al., 2002; Stoughton et al., 2002; York et al., 2000). Given an imaging limit of , SDSS is uncovering an unprecedented number of faint, low-accretion rate CVs amongst the new systems discovered to date (see Szkody et al., 2002, 2003, 2004b). Indeed, this is the very population that is expected to dominate CVs, but due to selection biases was missed previously (Howell et al., 1997).
Several polars have been identified in the SDSS, among them two of the lowest accretion rate systems known (Szkody et al., 2003, 2004a) and the shortest period eclipsing system (Schmidt et al., 2004). XMM-Newton observations have helped to identify their accretion characteristics. Here we report follow-up XMM-Newton X-ray and optical observations of three additional sources, SDSS J072910.68+365838.3, 075240.45+362823.2, 170053.30+400357.6 (hereafter SDSS J0729, 0752, 1700 for brevity), identified from their initial SDSS spectra as probable polars. Our observations delineate the accretion regimes via measurement of their hard versus soft X-ray fluxes, and confirm the polar nature of the first two. We note that follow-up spectro-polarimetry of SDSS J1700 reported in Szkody et al. (2003) has already confirmed its polar nature.


2. Observations
For each XMM-Newton observation data are obtained with all detectors. However, for our targets there were never sufficient counts to render the dispersed spectra from the Reflection Grating Spectrograph (den Herder et al., 2001) of any use; even for the case of SDSS J0752, our brightest target, the continuum is barely detected and no emission lines stand out. Optical Monitor (OM, Mason et al., 2001) data were successfully obtained for only SDSS J0729 and SDSS J0752. However, in the UVW2 ultraviolet filter (required to avoid field brightness limits) SDSS J0752 was not detected; data were obtained for SDSS J0729 using the filter. Low-resolution spectra were available from the EPIC camera; two MOS detectors (Turner et al., 2001) + the pn (Strüder et al., 2001), where the pn has roughly twice the effective area of each of the MOS. The UT times, length of total observation and CCD livetime are listed in Table 1. These data were reduced according to the guidelines from the main XMM-Newton website (Vilspa111Available from http://xmm.vilspa.esa.es/external/xmm_sw_cal/ sas.shtml) and also from the US GOF ABC guide222http://heasarc.gsfc.nasa.gov/docs/xmm/abc/abc.html, using calibration files current to 2004 March 23 and the SAS v6.0. Given the calibration updates since pipeline processing, as a precaution we used SAS-tools to produce new event list files from the Observation Data Files. To check on variations in the non-X-ray background we created lightcurves for each entire detector in the 10–15 keV range, and where appropriate created new GTIs to exclude intervals of higher background. We also screened these event lists using the standard canned expressions and we restricted energies to the 0.1–10 keV range. For the two MOS detectors, we used a 320 pixel radius circular aperture size (enclosing of the energy, chosen to maximize S/N), with a source-free background annulus surrounding the source; event pattern selection was also applied. For the pn, we extracted source data within a 360 pix (again encircled energy) and background data from adjacent rectangular regions at similar detector Y locations to the target. As advised, a conservative choice of event selection, pattern = 0, was adopted.

We fit simple blackbody (BB) + thermal Bremsstrahlung (Br) (or MEKAL333See http://heasarc.gsfc.nasa.gov/lheasoft/xanadu/xspec/ manual/node39.html to include line emission) models to the various spectra to obtain estimates of the relative contributions of soft ( keV) and hard ( keV) components. Given the lack of counts from SDSS J0729 and the need to time-resolve the data from SDSS J0752, we chose to use Cash statistics (Cash, 1979), which work better for the case of few counts per bin. For SDSS J1700 the background was a significant contribution (30–40%), hence we opted to use background subtracted spectra and statistics for fitting. In no cases were we able to reliably constrain the absorbing columns. Hence, by default we adopted the value for the position on the sky given by the HEASARC tool nH, based on dust maps. All our targets are at high Galactic latitude, leading to values fewcm-2 typical of the values measured in most polars. However, we do caution that our adopted values could be overestimates since these targets are likely within a few hundred parsecs of the Sun, and nH gives the column to the edge of the Galaxy.
Lastly, in our fitting we used two sets of energy ranges (specifically the lower energy cut-offs), since the reliability of the calibrations at the lowest energies is still unclear. The large range (LR) set included energies 0.15keV for pn and 0.2keV for MOS, potentially useful for constraining any soft blackbody component. The restricted range (RR) had more conservative cut-off limits of keV (pn) and 0.5 keV (MOS).
We extracted light curves for both source and background with SAS task evselect, using the same extraction regions as the spectra, but a less conservative pattern for the pn events. Using FTOOLS444http://heasarc.gsfc.nasa.gov/lheasoft/ftools/ tasks we subtracted the scaled background and converted the time stamps from JD(TT) to HJD(TT)555The tools actually yield barycentric Julian Date in the barycentric dynamical time system, BJD(TB). However, the offset to heliocentric Julian Date in the geocentric (terrestrial) dynamical time system (HJD(TT)) is less than 3 s at any given time, fine for our purposes here.
Contemporaneous optical spectra for SDSS J0729 and SDSS J0752 were obtained on 2002 October 31 using the double-imaging spectrograph (DIS) on the 3.5m telescope at Apache Point Observatory (APO). These were reduced and flux-calibrated within IRAF666IRAF (Image Reduction and Analysis Facility) is distributed by the National Optical Astronomy Observatories, which are operated by the Association of Universities for Research in Astronomy (AURA) Inc., under cooperative agreement with the National Science Foundation. In addition, differential photometry was obtained for SDSS J0729 (in 2002 January), and SDSS J0752 (contemporaneously), with the US Naval Observatory Flagstaff Station (NOFS) 1m telescope; see Table 1 for details. These data were taken with no filter to give maximum signal-to-nose, but an approximate zeropoint for Johnson was made possible through calibration of the field from all-sky photometry including Landolt standards observed at NOFS. Hence, the lightcurves are labeled magnitudes, but actually show broad, white light results. Lastly, optical spectrophotometry and circular spectropolarimetry were obtained for SDSS J0729 and SDSS J0752 in 2003 September, November and 2004 February with either the 2.3 m Steward Observatory (SO) Bok telescope or the 6.5 m MMT atop Mt. Hopkins (see Table 1). Both runs made use of the CCD SPOL spectropolarimeter (Schmidt et al., 1992). Neither of the sources was found to be highly polarized (magnitude of polarization is considered a non-detection), only the 2003 September 22 observation of SDSS J0729 made a detection with a polarization of . However, we note that SDSS J0752 was in a low state during its only observation on 2003 November 01.
SDSS J1700 was also observed by the NOFS 1m on 2003 July 2, and then, close to the XMM-Newton observations, by the 0.76m telescope at Manastash Ridge Observatory (MRO) on 2003 August 8–10. Time-resolutions s were achieved on all nights using no filter, apart from the final MRO night which used a filter. Details of the observations are listed in Table 1. Differential magnitudes were determined relative to at least three local standard stars in the field.
3. Results
From our contemporaneous optical spectra and/or lightcurves we are able to confirm that each of the targets were in their normal active accretion states at the times of the XMM-Newton X-ray observations. The low-resolution spectra of SDSS J0729 and SDSS J0752 show the characteristic He II (Fig. 1), and are in general very similar to their SDSS spectra. The NOFS photometry of SDSS J0752 also gave a consistent . Likewise SDSS J1700 was observed at , a similar flux level to all prior optical observations.
3.1. SDSS J0729
In the optical, repeatable variability is apparent, with two full cycles covered. From a PDM analysis we derive a period of hr. Though of very low S/N, the light curve from the simultaneous OM observations shows consistent morphology. In Figure 2 we show the folded lightcurve and also the XMM-Newton lightcurve for an equivalent time interval. The complex optical morphology is reminiscent of that seen in AM Her on occasion (see e.g. Mazeh et al., 1986). Gänsicke et al. (2001) have recently developed a quantitative model for the and lightcurves of AM Her. The accretion column, responsible for the optical cyclotron emission, is always visible, with the primary minimum occurring when the line-of sight is along the accretion funnel, and the secondary minimum due to partial self-eclipse by the WD and/or cyclotron beaming effects.
The X-ray flux in SDSS J0729 is undetectable for fully 0.4 in
phase, then brightens significant, possibly for only 0.2. This is very similar to the X-ray flare behaviour seen in a low state of UZ For
(Pandel & Córdova, 2002), suggesting that the accretion rate is sufficiently low (consistent with the optical spectrum) that any X-ray emitting region is too cool to fall within the XMM-Newton
passband most of the
time. However, given our incomplete phase coverage it is also possible that we are simply seeing the X-ray emitting part
of the column coming out of self-eclipse by the WD. Since the X-ray emitting region is typically smaller and closer to the WD surface than the
cyclotron, a much longer X-ray self-eclipse is certainly plausible.
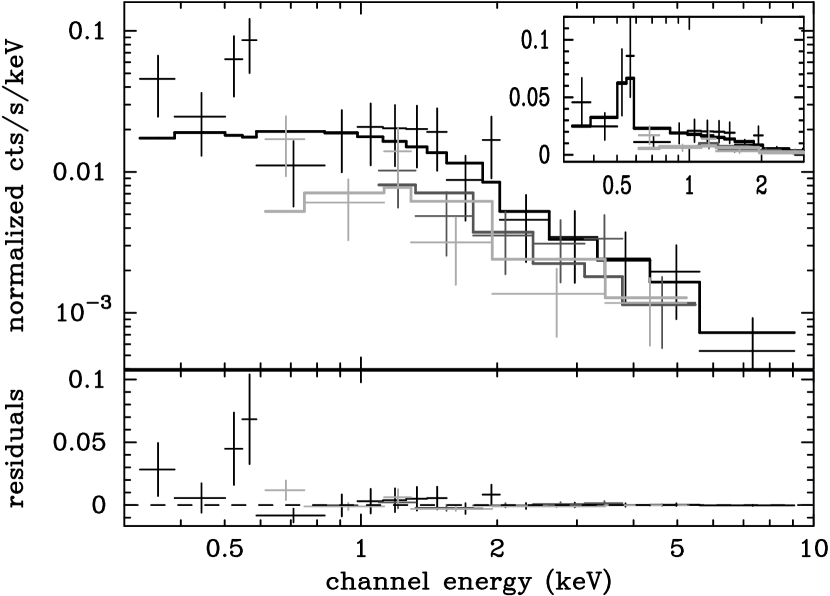
The spectrum from this high X-ray flux interval is also quite unusual. We fit a Br + BB model to the restricted range; we constrained the temperatures to 30 keV and 40 eV respectively, as typical values for polars (Warner, 1995). The result indicated that the data do not require any soft blackbody component (see Table 2). However, as seen in Figure 3, the residuals to the bremsstrahlung in the pn data show evidence for a broad line emission feature at 0.57 keV. In the inset we show a fit to the line (with a linear scale). Given the low S/N, the significance of this feature remains questionable. We did check whether it was an artifact of binning, by trying binning with 4 to 7 counts per bin instead, but it appeared consistently. A line at this energy could be due to strong O VII emission; we note that a number of strong O VI lines are present in the spectra of AM Her in the extreme UV (Mauche & Raymond, 1998).
3.2. SDSS J0752
Similar to SDSS J0729, the optical light curve of SDSS J0752 exhibits a large amplitude variation, with a prominent minimum, and additional flux reductions 0.3 later in phase (Fig. 4). The PDM analysis reveals a period of hrs. Although the ephemeris is not well-constrained, the optical observation took place only five cycles prior to the X-ray and we can phase the latter to within 0.1 cycles. We therefore tentatively identify the X-ray and optical minima present at close to our as due to self-eclipses. In X-rays there appears to be a short interval of complete occultation, but unfortunately, the eclipse is right at the start of the MOS exposure. In the broad band optical curve, the eclipse is only partial as expected for the less localized cyclotron and other optical emission sites.
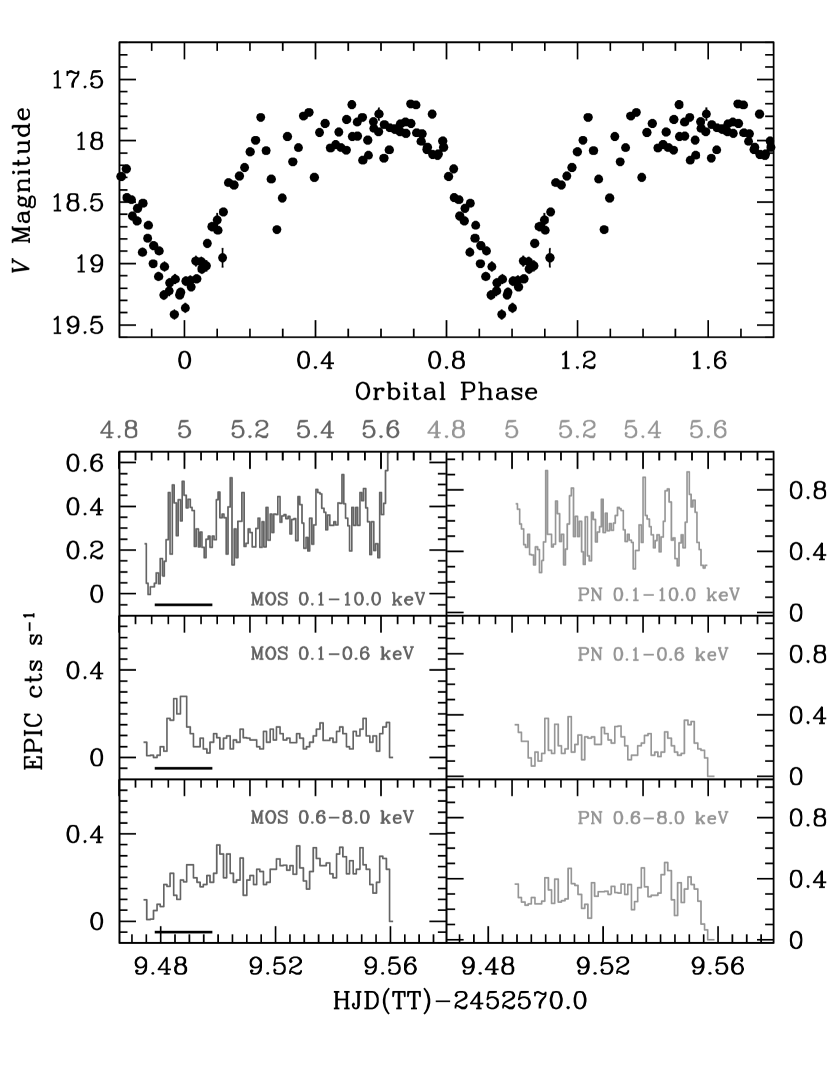
The optical flux dips at , again considering the AM Her case, could well be due to the observer looking down along the accretion funnel at this interval. Moreover, immediately following the X-ray eclipse there is a distinct hump before the source settles into a fairly steady flux level; though we note that a QPO on a 700s timescale appears towards the end of the observation. Light curves constructed for soft (0.1–0.6 keV) and hard (0.6–8 keV) bands, provide further insight. The hump is much more striking in the soft band, with the flux returning to a low (but non-zero) level for the remainder of the observation, whereas the hard band appears to come out of eclipse and remain at a constant high level thereafter.
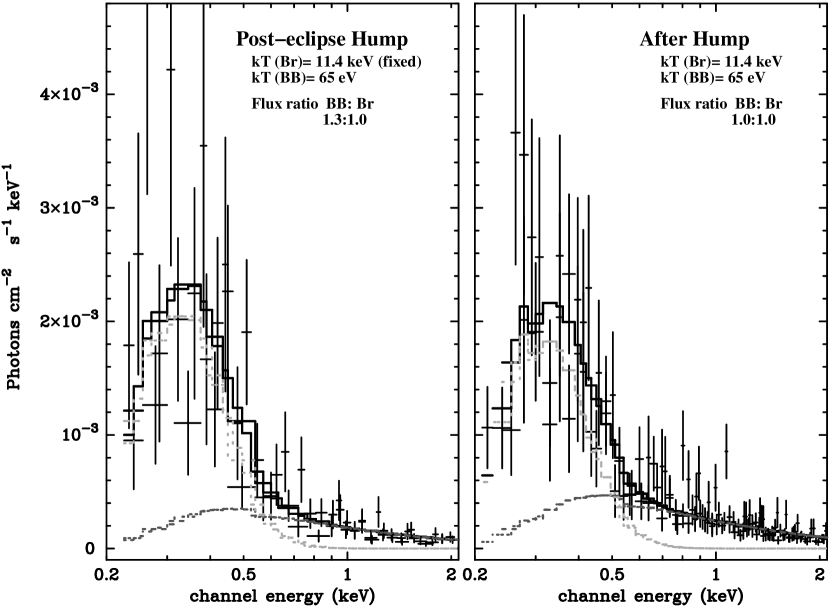
We also extracted phase resolved spectra to examine the changes in greater detail (see Table 2). For the interval after the hump (HJD), we fit a basic Br + BB model (Fig. 6) and found that in this system, the BB component is very significant; with an F-test giving probabilities % for either the LR or RR (though the parameters are naturally better constrained for the former). Indeed, the BB contributes half of the unabsorbed flux in the 0.01–10.0 keV range, though we caution that the exact fraction is model dependent and could be a factor of 2 different.
During the hump, we were restricted to the MOS data alone, and chose to fix at the value found previously in the combined MOS + pn after-hump dataset. The fit yielded eV in both cases; hence, the change in the BB flux is not due to a change in temperature, but rather to differing normalizations. This suggests that as SDSS J0752 emerges from eclipse, we can see the BB emission region fully before it is once again obscured, most likely by the accretion column; consistent with our model for the optical lightcurve.
3.3. SDSS J1700
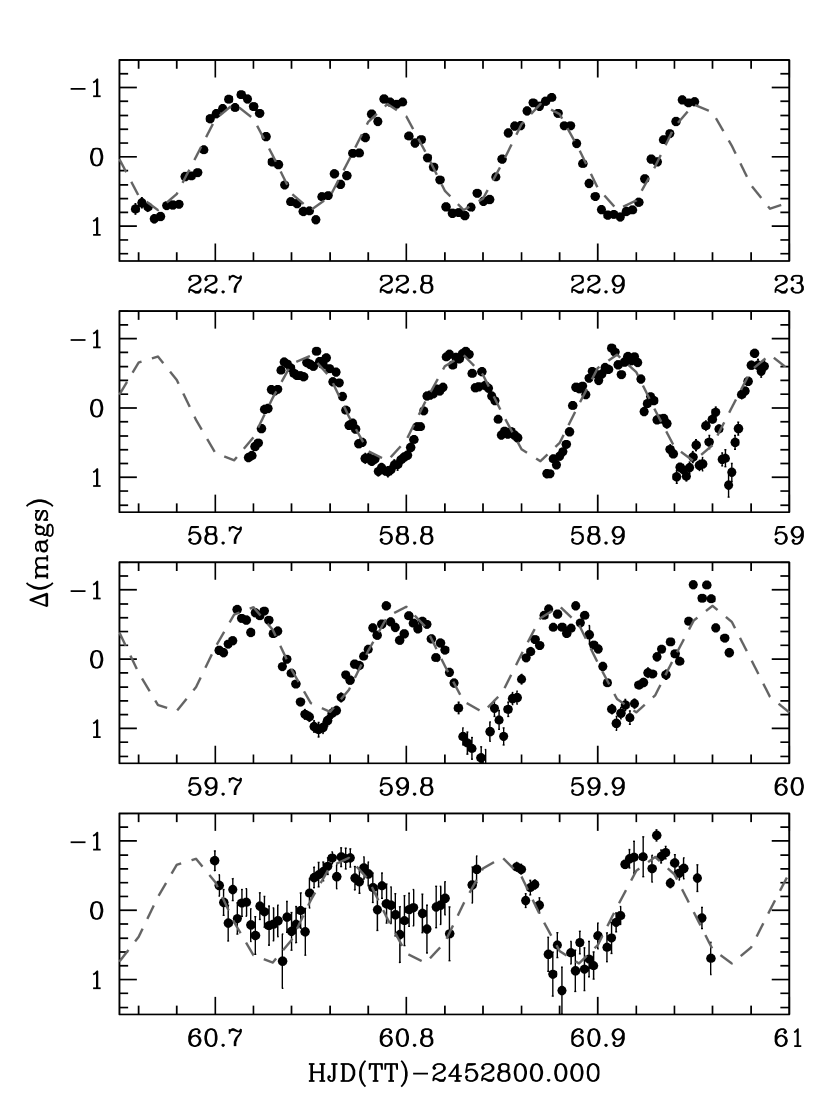
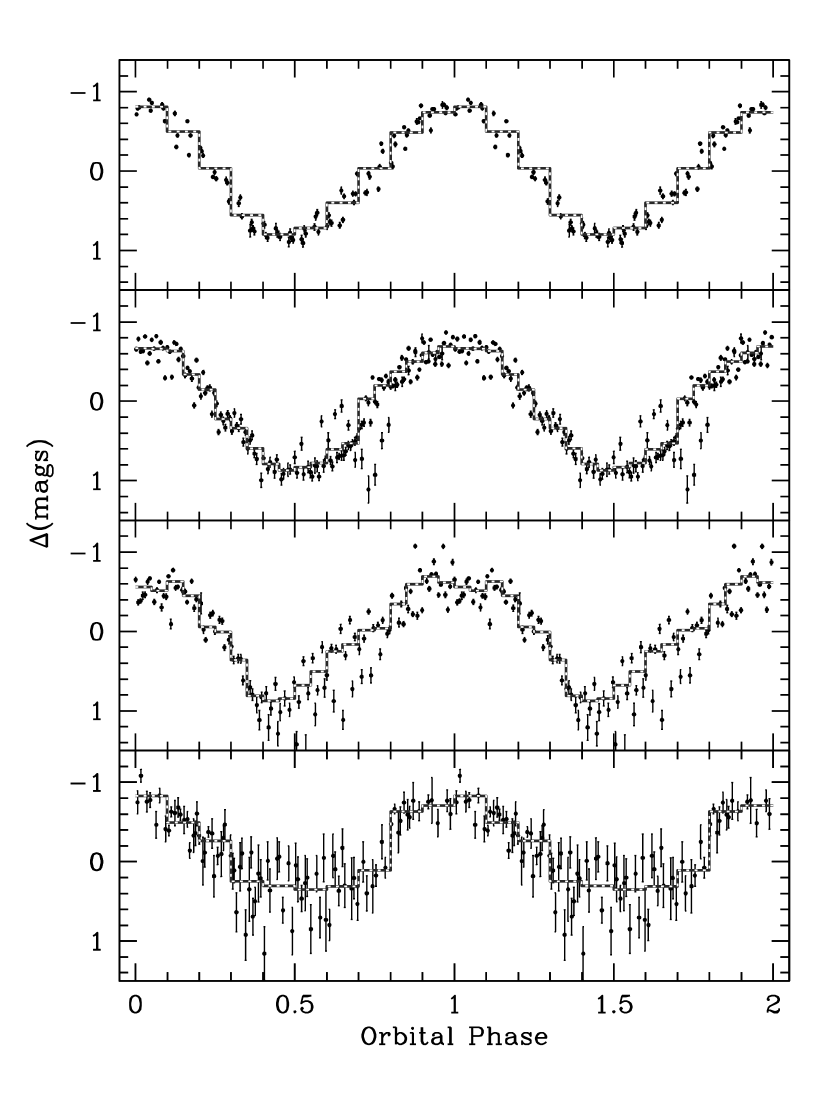
In Figure 7 we present the four nights of optical data, with the best fit sinusoid over-plotted. The morphology of the orbital modulation is indeed close to sinusoidal, although as illustrated in the phase folded and binned plots (Fig. 8), the exact shape changes subtly from night to night. Comparison to the 2001 August lightcurves presented in Szkody et al. (2003) shows more conspicuous differences, at that time the shape comprised broad maxima and narrow minima, in contrast to the 2003 morphology. To derive an ephemeris, we first used a modified discrete Fourier transform, the Lomb-Scargle Periodogram (Scargle, 1982), to determine the approximate best period. This was then refined by cycle counting ( method), and finally by fitting a sinusoid model to the entire dataset, yielding:
where is the time of maximum light, and the parenthetical values indicate the estimated uncertainties in the final digits. With this precision we are easily able to phase the X-ray lightcurve (Fig. 9).
Unfortunately, during this XMM-Newton observation, there were technical problems, hence although we are able to accumulate data from all the small intervals of CCD livetime, the MOS data were completely unusable for timing and only parts of the pn could be used to reliably construct a light curve. However, given the limited coverage it does seem that the X-ray flux is modulated in anti-phase to the optical.
There are at least two alternate explanations for the X-ray and optical lightcurves. In the first, like SDSS J0729 and SDSS J0752 a single accretion pole is visible in SDSS J1700. The optical modulation is then a result of our viewing of the cyclotron emission, with the minimum occurring when we view down the accretion funnel. As narrower cyclotron beaming occurs at shorter wavelengths we then obtain the broader minimum in the band (see Bonnet-Bidaud et al., 1985). In contrast, the X-ray emission reaches a maximum when the normal to the accretion spot is close to our line-of-sight. The second model invokes two visible accretion poles, and as is the case during the “reversed” state of AM Her, the optical emission is dominated by one, and the X-ray by the other. The X-ray/optical minima are then due to total/partial self-eclipses respectively. Only longer contemporaneous observations of SDSS J1700 will be able to resolve this issue.

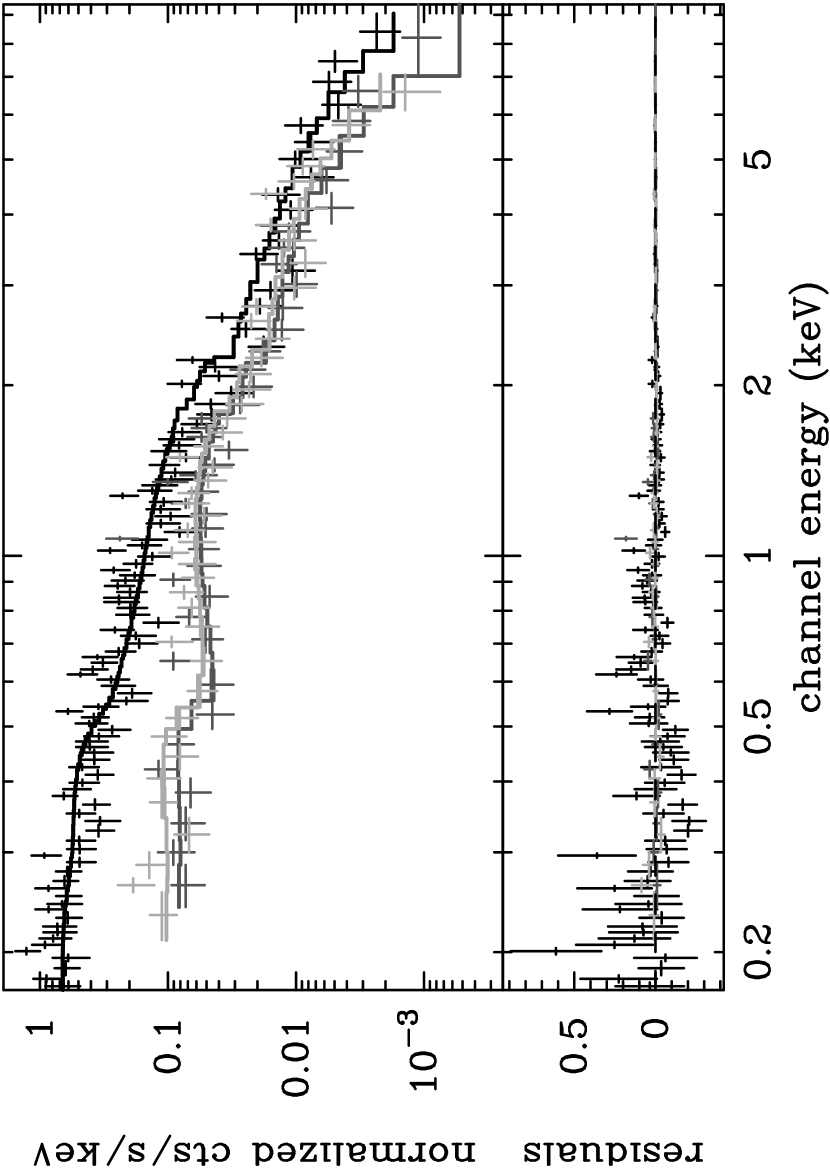
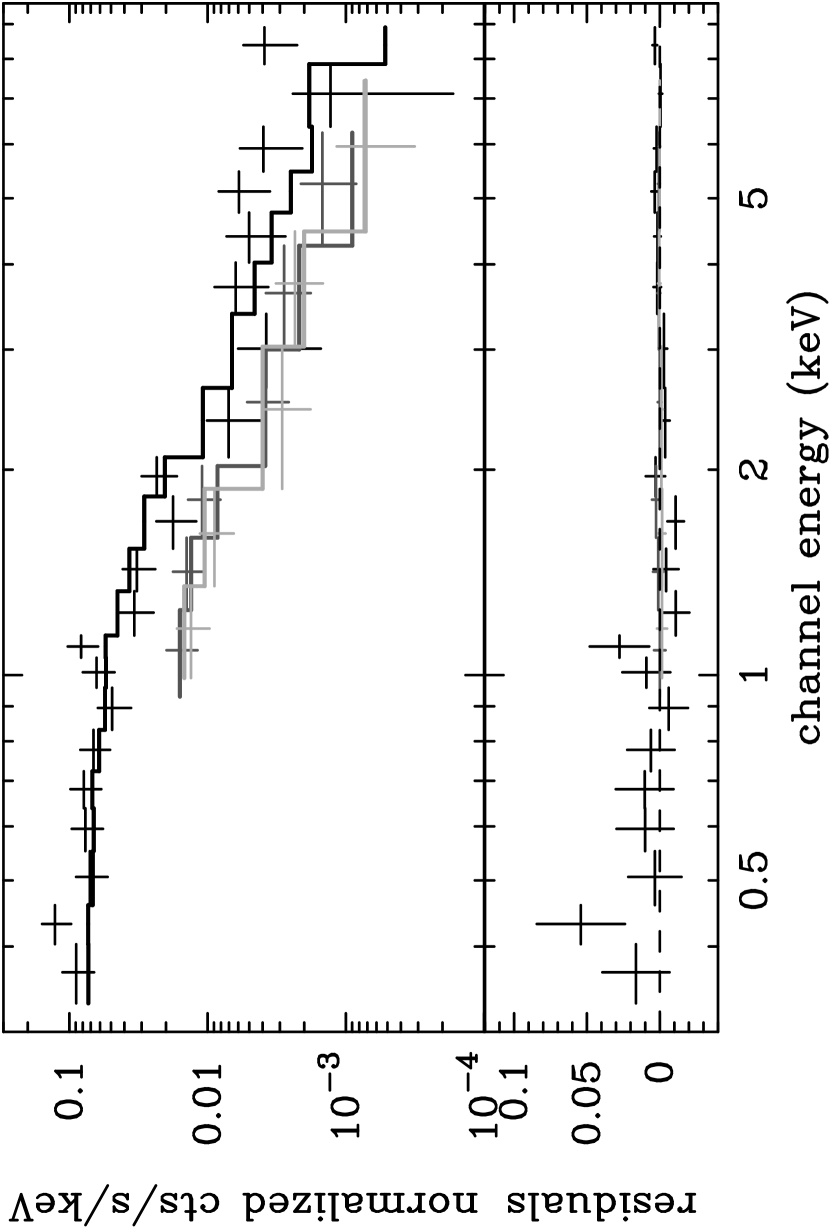
As a consequence of the limited live time, the X-ray spectrum is of low S/N. We fitted a variety of models to the RR and LR (see Table 2). In no case was a soft BB component (fixed at 40 eV) required. For the Br we found a very poorly constrained temperature of keV. A single temperature MEKAL fit the data equally as well, but with a slightly better constrained keV (see Fig. 10). In summary, the spectrum of SDSS J1700 is typical of a polar, with a plasma keV, but no additional soft component is required.
4. Conclusions
The XMM-Newton and optical observations presented here provide useful constraints on the accretion characteristics of SDSS J0729, SDSS J0752 and SDSS J1700.
In terms of accretion geometries, we find SDSS J0729 is likely a single pole accretor, exhibiting a complex optical lightcurve due to the combined effects of cyclotron beaming and partial occultation of the emitting region. The X-ray variation, consisting of a single high flux interval lasting perhaps only 0.2 in phase, could either be a X-ray flare event due to a sudden, short increase in the mass transfer rate from the secondary, or the X-ray emitting region simply coming out from self-eclipse. In any case, the X-ray spectrum at this time is most unusual, being well-modeled by the usual hard bremsstrahlung, but also requiring a strong emission line at 0.57 keV. This line is probably due to O VII emission, and it is interesting to note that similar strong emission lines (of O VI) are seen in the extreme UV spectra of AM Her (Mauche & Raymond, 1998).
The data on SDSS J0752 also appear to be consistent with a single pole accretor. Both the X-ray and optical lightcurves show self-eclipses by the WD. In the optical at there are additional dips in the flux, possibly due to cyclotron beaming and/or obscuration effects. In the soft X-ray, the eclipse is followed by a short rise in flux, then a long interval at a lower level perhaps due to obscuration by the accretion column itself. This is the brightest source in X-rays, and we are able to constrain both the BB and Br components fairly well. We find a typical keV, but a somewhat high eV, though the latter may relate to the remaining low energy calibration uncertainties of the EPIC instruments. Bearing this, and the uncertainty in the absorbing column which we could not constrain, in mind we can derive a value for the soft/hard X-ray energy balance. Taking into account the geometrical effects, the X-ray scattering albedo of the WD photosphere, (Williams et al., 1987), but not the cyclotron term (typically negligible compared to the Br) we find . This is well-within the range found in a recent survey of polars by Ramsay & Cropper (2004), and in agreement with the basic picture of X-ray emission from radial accretion.
For SDSS J1700 the lightcurves allow two alternate models, either a single or two pole accretor, and both are able to explain the anti-phasing of the X-ray and optical modulations. In the former, the cyclotron beaming minimum occurs at roughly the same phase that the accretion region appears brightest in X-rays. In the latter, we postulate that the optical and X-ray emission originate at different poles, and are principally modulated by the occurrence of self-eclipses.
References
- Abazajian et al. (2003) Abazajian, K. et al. 2003, AJ, 126, 2081
- Abazajian et al. (2004a) —. 2004a, AJ, 128, 502
- Abazajian et al. (2004b) —. 2004b, AJ, submitted (astro-ph/0410239)
- Bonnet-Bidaud et al. (1985) Bonnet-Bidaud, J. M., Motch, C., & Mouchet, M. 1985, A&A, 143, 313
- Cash (1979) Cash, W. 1979, ApJ, 228, 939
- den Herder et al. (2001) den Herder, J. W. et al. 2001, A&A, 365, L7
- Fukugita et al. (1996) Fukugita, M., Ichikawa, T., Gunn, J. E., Doi, M., Shimasaku, K., & Schneider, D. P. 1996, AJ, 111, 1748
- Gänsicke et al. (2001) Gänsicke, B. T., Fischer, A., Silvotti, R., & de Martino, D. 2001, A&A, 372, 557
- Gunn et al. (1998) Gunn, J. E. et al. 1998, AJ, 116, 3040
- Hogg et al. (2001) Hogg, D. W. et al. 2001, AJ, 122, 2129
- Howell et al. (1997) Howell, S. B., Rappaport, S., & Politano, M. 1997, MNRAS, 287, 929
- King & Watson (1987) King, A. R. & Watson, M. G. 1987, MNRAS, 227, 205
- Kuijpers & Pringle (1982) Kuijpers, J. & Pringle, J. E. 1982, A&A, 114, L4
- Lupton et al. (1999) Lupton, R. H., Gunn, J. E., & Szalay, A. 1999, AJ, 118, 1406
- Lupton et al. (2001) Lupton, R. H. et al. 2001, ASP Conf. Ser., 269
- Mason et al. (2001) Mason, K. O. et al. 2001, A&A, 365, L36
- Mauche & Raymond (1998) Mauche, C. W. & Raymond, J. C. 1998, ApJ, 505, 869
- Mazeh et al. (1986) Mazeh, T., Kieboom, K., & Heise, J. 1986, MNRAS, 221, 513
- Pandel & Córdova (2002) Pandel, D. & Córdova, F. A. 2002, MNRAS, 336, 1049
- Pier et al. (2003) Pier, J. R. et al. 2003, AJ, 125, 1559
- Ramsay & Cropper (2004) Ramsay, G. & Cropper, M. 2004, MNRAS, 347, 497
- Ramsay et al. (1994) Ramsay, G., Mason, K. O., Cropper, M., Watson, M. G., & Clayton, K. L. 1994, MNRAS, 270, 692
- Scargle (1982) Scargle, J. D. 1982, ApJ, 263, 835
- Schmidt et al. (1992) Schmidt, G. D., Stockman, H. S., & Smith, P. S. 1992, ApJ, 398, L57
- Schmidt et al. (2004) Schmidt, G. D., Szkody, P., Homer, L., Smith, P., Chen, B., Henden, A., Solheim, J., Wolfe, M. A., & Greimel, R. 2004, ApJ, in press
- Smith et al. (2002) Smith, J. A. et al. 2002, AJ, 123, 2121
- Stoughton et al. (2002) Stoughton, C. et al. 2002, AJ, 123, 485
- Strüder et al. (2001) Strüder, L. et al. 2001, A&A, 365, L18
- Szkody et al. (2004a) Szkody, P., Homer, L., Chen, B., Henden, A., Schmidt, G., Anderson, S., Hoard, D., Voges, W., & Brinkmann, J. 2004a, AJ, 128, 2443
- Szkody et al. (2002) Szkody, P., Nishikida, K., Raymond, J. C., Seth, A., Hoard, D. W., Long, K. S., & Sion, E. M. 2002, ApJ, 574, 942
- Szkody et al. (2003) Szkody, P. et al. 2003, AJ, 126, 1499
- Szkody et al. (2004b) —. 2004b, ApJ, in press
- Turner et al. (2001) Turner, M. J. L. et al. 2001, A&A, 365, L27
- Warner (1995) Warner, B. 1995, Cataclysmic Variable Stars (Cambridge University Press), 57
- Wickramasinghe & Ferrario (2000) Wickramasinghe, D. T. & Ferrario, L. 2000, New Ast. Rev., 44, 69
- Williams et al. (1987) Williams, G. A., King, A. R., & Brooker, J. R. E. 1987, MNRAS, 226, 725
- York et al. (2000) York, D. G. et al. 2000, AJ, 120, 1579
| SDSS J | Energyaa.LR= Large Range. Using 0.15–10 keV for pn and 0.2–10 keV for MOS to make most of low-energy response. RR= Restricted Range. More conservative lower energy limits imposed: 0.3–10 keV for pn and 0.5–10 keV for MOS. | Model | GoodnessbbFor SDSS J0729 and SDSS J0752 where the fitting utilized Cash statistics, the goodness of fit is found via a Monte Carlo method. Sampling each parameter randomly within its allowed distribution spectra were simulated, and a fit performed. The percentage refers to the incidence of fits with lower C-statistic values than that of the fit to the data. A good fit should have a value around 50%. For SDSS J1700 the reduced is quoted. | or | FluxccUnabsorbed flux in the 0.01–10 keV range, in units of , including the correction for the 70% encircled energy fraction. | ||
|---|---|---|---|---|---|---|---|
| range | of Fit | cm-2 | |||||
| 0729 | RR | Bremss | 54% | 5.96 (f)dd(f) indicates that the parameter was frozen at this value. | keV | 4.2 | |
| BB | 47% | 40 eV (f) | 16 | ||||
| + Bremss | 30 keV (f) | ||||||
| Bremss | 8% | 30 keV (f) | 3.8 | ||||
| + Gaussian line | keV | 0.2 | |||||
| 0752 | LR | BB | 36%eeFor a single-component Bremsstrahlung model the percentage was 100%, clearly indicating the need for the blackbody. | 5.11 (f) | eV | 18 | |
| (after-hump) | + Bremss | keV | 26 | ||||
| (hump) | BB | 74% | eV | 18 | |||
| +Bremss | 11.4 (f) | 18 | |||||
| 1700 | RR | Bremss | 1.0 | 2.15 | keV | 8 | |
| BB | 0.97 | 40 eV (f) | 14 | ||||
| +Bremss | keV | ||||||
| mekal | 0.97 | keV | 8 | ||||