Partially obscured quasars in the Sloan Digital Sky Survey Early Data Release
Abstract
We have compiled a sample of 21 low redshift (), luminous active galactic nuclei (AGN) with large Balmer decrements (H/H) using the galaxy and QSO catalogs of the Sloan Digital Sky Survey Early Data Release. Using this sample we attempt to determine the fraction of quasars with large internal absorption. We find that these AGN have Strong [O III] 5007 and broad H emission, and that starlight dominates the spectra in the blue band, suggesting that these objects are heavily reddened. Their narrow emission line ratios are similar to those of Seyfert 2 galaxies, yet the average [O III] 5007 emission is 10 times more luminous. Applying the empirical relation between the optical continuum and the Balmer line luminosity for blue quasars, we find that the intrinsic luminosities of these 21 objects are in the range for quasars. We propose that they are obscured, intermediate type quasars analogous to type 1.8 and 1.9 Seyfert galaxies. The ratio of these optically selected, intermediate type quasars to type 1 quasars are found to be around 1, similar to that for local Seyfert galaxies. Preliminary study indicates that most of these quasars are hosted in early type galaxies.
1 Introduction
The unified model for Seyfert galaxies is now well-supported (see Antonucci 1993 for a review). The model postulates that Seyfert 1 and Seyfert 2 galaxies are physically the same, except that the broad line region (BLR) in Seyfert 2 galaxies is obscured from our line of sight by dust in the nucleus or in the host galaxy, and that quasars are luminous versions of Seyfert galaxies. Obscuration by dust should also play an important role in quasars. However, the evidence supporting such unification for quasars is substantially weaker than for Seyfert galaxies. Whether or not the difference between Seyfert galaxies and QSOs is simply a matter of luminosity is still a hotly debated issue, for instance some researchers argue that there may not even exist a dusty torus in QSOs, or, if one exists, its opening angle is luminosity dependent (e.g., Lawrence 1991; Simpson 2003).
On the other hand, the hard X-ray spectrum of the cosmic X-ray background (XRB) seems to require a large number of obscured AGN (Seyfert galaxies and quasars). During the past few years, deep X-ray surveys (ROSAT, Chandra and XMM-Newton) have resolved more than 80% of the 2-10 keV X-ray background into discrete sources (e.g., Mushotzky et al. 2000; Hasinger et al. 2001; Rosati et al. 2002). Follow-up spectroscopic observations show that the sources producing the bulk of the XRB are a mixture of obscured and unobscured AGN, as predicted by the XRB population synthesis models (Gilli et al. 2001 and references therein). However, the ratio between obscured and unobscured quasars estimated according to the black hole mass function in the local universe is much lower than required by the XRB population synthesis models (Marconi & Salvati 2002; Yu & Tremaine 2002).
The luminous analogs of Seyfert 2 galaxies predicted by the unification model are hard to select and identify for the following reasons: First, they are much rarer than Seyfert 2 galaxies, thus a large area deep survey is required. Second, it is hard to obtain their intrinsic luminosities because of the heavy obscuration, thus it is difficult to distinguish them from Seyfert 2 galaxies. Soft X-ray surveys, such as ROSAT, can not find such objects effectively because the strong obscuration blocks soft X-rays. Radio surveys can be affected by free-free opacity associated with the obscuration, and moreover, only AGN are radio-loud (Krolik, 1999). Hard X-rays should be relatively unaffected by extinction, but a large-scale, deep survey has not yet been carried out. Though every now and then there are reports of the discovery of type 2 QSOs111Some of these objects may not follow the strict definition of the ‘type 2’ AGN, since they sometimes reveal weak broad H lines in deeper, high S/N ratio spectra (e.g.,1E0449.4–1823, Boyle et al. 1998; AX J08494+4454, Akiyama et al. 2002). They are, however, heavily obscured AGN. (e.g., Norman et al. 2002; Della Ceca et al. 2003), the only systematic search for such objects covering a large area is the 2MASS red AGN survey (Cutri et al. 2001).
The Sloan Digital Sky Survey (SDSS: York et al. 2000) is both an imaging and spectroscopic survey. Its large sky coverage ( deg2) makes it ideal for selecting rare objects such as heavily obscured quasars. In this paper we present a sample of 21 intermediate type quasars selected from the SDSS EDR (Early Data Release). They are selected to have strong, broad H emission lines, with a large Balmer decrement for the broad component (H/H), suggesting strong, partial obscuration/reddening. Their intrinsic luminosities are estimated from their reddening-corrected broad H emission. Their nearness ( 0.3, with a median value of ) makes them relatively easy for follow-up observations. These objects are important for three reasons: First, they can be used to study the nature of the obscuring material in quasars. Second, the relative number of such objects may provide us with some clues to the abundance of type 2 quasars, provided they are obscured by the same mechanism. Finally, they can be used to unravel the relationship between the nuclear activity and the character of the host galaxy. Usually, the study of QSO host galaxies is very difficult, especially for luminous QSOs, because the light from the AGN itself overwhelms that from the host galaxy. Thus, further work on the intermediate type QSOs discussed in this paper, where the nuclear emission is strongly attenuated and the host galaxy has prominent observed features, may be able to yield less ambiguous results on the morphology, stellar velocity dispersion, and star formation history in these host galaxies.
This paper is organized as follows: In Section 2 we present the details of our analysis of the SDSS spectra, and describe our selection criteria for intermediate type QSOs. Section 3 presents the main properties of our sample, as well as discussions of some interesting individual objects. Section 4 is a short summary. Through out the paper, we assume a cosmology with H0=70 km s-1 Mpc-1, =0.3 and =0.7.
2 Sample construction and Data Analysis
2.1 Construction of the parent sample
The parent sample of our partially obscured QSOs is the low redshift AGN (QSOs and Seyfert galaxies) with reliable broad H line selected from the spectral dataset of the SDSS EDR. We construct the parent sample in four stages.
First, we pick up all the objects classified by the SDSS spectroscopic pipeline as galaxies (SPEC_GALAXY, specClass=2) or quasars (SPEC_QSO, specClass=3) with . This yields 38223 objects in total (37657 as SPEC_GALAXY, 566 as SPEC_QSO). We limit so that the centroid of H lies at 8500 Å, allowing us to reliably measure the H flux. In this first step we do not limit the S/N ratio, because some objects may have a reliable broad H line yet a rather weak continuum with a very low S/N ratio. For any object with multiple spectroscopic observations, we retain only the spectrum with highest S/N ratio.
Second, the 566 SPEC_QSO are visually examined to remove 1) objects with too many bad pixels or too low S/N ratio in the H region, and 2) objects obviously without broad emission lines. This stage cuts the sample to 459 SPEC_QSO. Using these we build a sub-sample of normal type 1 AGN (QSOs and luminous Seyfert 1.0 galaxies, hereafter called blue AGN) to use as a reference in the next stages. These blue AGN are selected according to the following criteria: 1) (the definition of the 4000 Å break index introduced by Balogh et al. (1999) is adopted here, using bands 3850-3890 Å and 4000-4100 Å) , 2) blue color ( 0.6 corresponding to the conventional criterion of -0.4). These criteria produce a sub-sample of 94 objects. For these objects, we fit the continua using a single power-law or broken power-law. For some objects with apparent Fe II multiplets, we fit the continua employing the empirical optical Fe II template of Boroson & Green (1992, hereafter BG92) broadened by convolving a Gaussian of various widths. The continuum (and FeII multiplets if present) was then subtracted and the remaining emission lines were fitted with an appropriate line profile (the details of the emission line fitting are described in § 2.3). These emission line fits yield the equivalent widths (EW) of the broad H component of the 94 objects. These range from to Å with a mean value of . These EW will be used later to roughly evaluate the relative contribution of the stellar and nuclear components.
In the third stage, nuclear continuum and/or starlight subtraction is performed for the remaining 365 SPEC_QSO and the 37657 SPEC_GALAXY. For 41 SPEC_QSO without prominent stellar features, power law continuum (and Fe II templates if necessary) were fitted in the same way as for the blue AGN. For the other SPEC_QSO, where the stellar contribution cannot be neglected, nuclear continuum and stellar component are fitted simultaneously (see § 2.2).
For the 37657 SPEC_GALAXY, we initially perform starlight subtraction by fitting the emission line free regions of the spectrum with nine synthesized templates, which will be discussed in detail in § 2.2. Then the emission lines of these 37657 objects are measured assuming Gaussian profiles. This is a preparatory fitting for subsequent reductions. More than one thousand candidates were selected using the criterion that the broad component of H (Full Width at Half Maximum, FWHM km s-1) is significant (). Then we visually examined these candidates to exclude the objects with a false broad component of H caused by poor starlight subtraction. After these culls, the number of the candidates is reduced to 867. However, for some of them, the nuclear contribution is not negligible. Those 126 objects with (0.2 times the minimum EW(H) of blue AGN and 0.1 times the mean value) are picked up for more precise starlight and nuclear continuum subtraction, as described in § 2.2.
The main task of the fourth stage in our analysis is to fit the emission lines precisely using several schemes (see § 2.3) for all the selected 1232 objects (459 SPEC_QSO and 867 SPEC_GALAXY). Based on the emission line parameters, we select out 583 objects (including the 94 blue AGN) as our parent sample. The criterion is: , where is the total flux error of the broad H component synthesized from two parts: 1) , the error given by the spectral line fitting procedure and 2) , the error introduced by template subtraction because of the mismatch between the object’s spectrum and the model spectrum. The latter will be discussed in § 2.2.
2.2 starlight/continuum subtraction
Accurate starlight subtraction for the measurement of nuclear emission lines is important. Usually it is implemented by fitting the non-emission-line regions of the spectrum with a model spectrum composed of galaxy templates which are derived from either observed star spectra (e.g., Kauffmann et al. 2003) or observed galaxy spectra (e.g., Ho et al. 1997a). In this work we develop a “two-step” method to build the galaxy templates described in detail in Li et al. (2004). Here we provide a brief summary of this approach.
First, Principal Component Analysis (PCA) is applied to an observed stellar library newly available (STELIB, Le Borgne 2003). The resultant star eigenspectra broadened to various velocity dispersions are then used to fit the high quality spectra of more than one thousand galaxies selected from the SDSS spectral dataset according to 6 color-color diagrams using 18 synthesized magnitudes, which constitute a uniform library with a full spectral type coverage. Based on the fitting result, we construct model spectra of the 1016 representative galaxies with a zero velocity dispersion. Again PCA is applied to these model spectra and the galaxy eigenspectra with a zero velocity dispersion are obtained. After test with SDSS galaxies using an F-test, the first 9 galaxy eigenspectra are picked up as our galaxy templates. Our galaxy templates have three advantages in addition to the merits of the PCA technique itself: 1) they do not include any light from the AGN, since they are derived from the model spectra generated from pure star eigenspectra; 2) they represent the most prominent features of the SDSS galaxies since they are based on representative galaxy spectra from the SDSS; 3) they can be used to fit the stellar velocity dispersion of the galaxies since they themselves are not velocity-broadened.
When used to fit the host galaxy component of the objects, these 9 templates are broadened by convolving with a Gaussian to match the stellar velocity dispersion of the host galaxy. The host galaxy component is thus modelled as the linear combination of the 9 best fitting broadened spectra.
In our sample, many objects appear to have both a host galaxy component and a nuclear component. In such cases, we fit the (almost) emission-line-free regions of the spectrum with the 9 broadened template spectra + a reddened power-law with varying between 0 and 2.5. The latter represents the nuclear component. Here the power-law is , taken as the unreddened nuclear continuum according to Francis (1996). Some objects have visible Fe II emissions which must be also removed before spectral line fitting. For those objects, we first subtract the starlight/continuum component without taking account of the Fe II emission and fit the spectral lines. Then we broaden BG92’s optical Fe II template to the width of the broad H, and fit the pseudo-continuum (wavelength ranges of prominent emission lines other than FeII multiplets were masked out) again with the 9 broadened template spectra + the reddened power law + the broadened BG92’s template.
In order to estimate the mismatch of this subtraction, we fit high quality spectra of absorption line galaxies and obtain the standard deviation of the relative error of the subtraction (=0.027). Using this we estimate the error of the flux of a broad line caused by the subtraction as the flux of the underlying continuum within the region of 4 FWHMs of the line multiplied by .
2.3 Emission line fitting
We developed a systematic code to fit the emission lines. With this code, we can fit each spectrum using several different fitting schemes. For example, for narrow H, we can tie its width to that of another line, such as [S II] 6731 while fitting the spectra with a extremely broad H component; or we can just fix it to a designated value, such as the fitted width of [O III] 5007 when [O III] 5007 is the only reliable narrow line. The results of different fitting schemes are compared with each other and the one with minimum is chosen. In this work, the primary goal of the line fitting is to obtain accurate measurements of broad H and broad H, with an emphasis on the former. To achieve this goal, we must accurately separate the Balmer lines from the nearby narrow lines. In general, our fitting strategies are as follows:
1. Initially, lines are fitted with Gaussians, one Gaussian for each narrow or broad component of the lines. For example, four Gaussians are used to fit the H + [N II] lines. The flux ratio of the [N II] doublet 6583/6548 is fixed to the theoretical value of 2.96, and their profiles are assumed to be identical. Likewise the [O III] doublet is similarly constrained. Usually we also require the profiles of the narrow H and [N II] to be the same.
2. If the FWHM of the broad H line is less than 3000 km s-1, we also try a Lorentzian profile to fit the broad lines.
3. If [O III] or [S II] doublets show a complex profile (e.g., with faint, extended wings), double Gaussians are employed to fit each narrow line.
4. If the broad and narrow H components can not be separated by the fit, the narrow lines in the Ha + [N II] region will be given the same profile of the narrow H line if available, or [S II], or [O III] in this order.
5. Likewise, if the broad and narrow H components can not be separated by the fit, the narrow H line will be given the same profile of the narrow H, or [O III], or [S II] in this order.
6. If the broad H line is weak or unavailable, we constrain its profile to be that of broad H line.
Following the above steps, we have measured the lines of most objects. But exceptions always exist since, as we know, the profiles of emission lines may be formed in quite different regions. For example, in several spectra the broad H component shows two or more velocity peaks, while in some others it even has an asymmetric or irregular shape. In these cases we adopt multiple Gaussians to constrain the fit if the data quality is high enough. (cf., 2 Gaussians for the broad H component of SDSS J101405.89+000620.3 as plotted in Figure 1). In fact, all the spectra are fitted interactively and then inspected visually. The fitting of the H + [N II] region for all the 21 partially obscured QSOs are displayed in Figure 1 (the right panel).
2.4 The sample of intermediate type quasars
It is well established that the Balmer line luminosity is tightly correlated with the nuclear continuum luminosity for both quasars and Seyfert galaxies (Yee, 1980; Shuder, 1981; Ho & Peng, 2001). We plot in Figure 2 the H luminosity versus the absolute magnitude for our blue AGN. A linear fit shows
| (1) |
which is perfectly consistent with the result of Ho & Peng (2001) who got
| (2) |
for a sample of PG quasars and Seyfert galaxies. According to equation (1), an H luminosity of log mag gives mag as the quasar selection limit in this paper.
Figure 3 shows the distribution of broad H/H for the 94 blue AGN we selected. It can be seen that the scattering of the H/H ratios is rather small, with an average H/H of 2.97 0.36. Assuming that all the objects in the parent sample have the same intrinsic Balmer decrement, H/H=2.97, we calculate the internal extinction as well as the intrinsic luminosity of H for the reddened objects. The Galactic extinction curve in Fitzpatrick (1999) with Rv=3.1 is utilized and the intrinsic luminosity of the broad H component is estimated as:
| (3) |
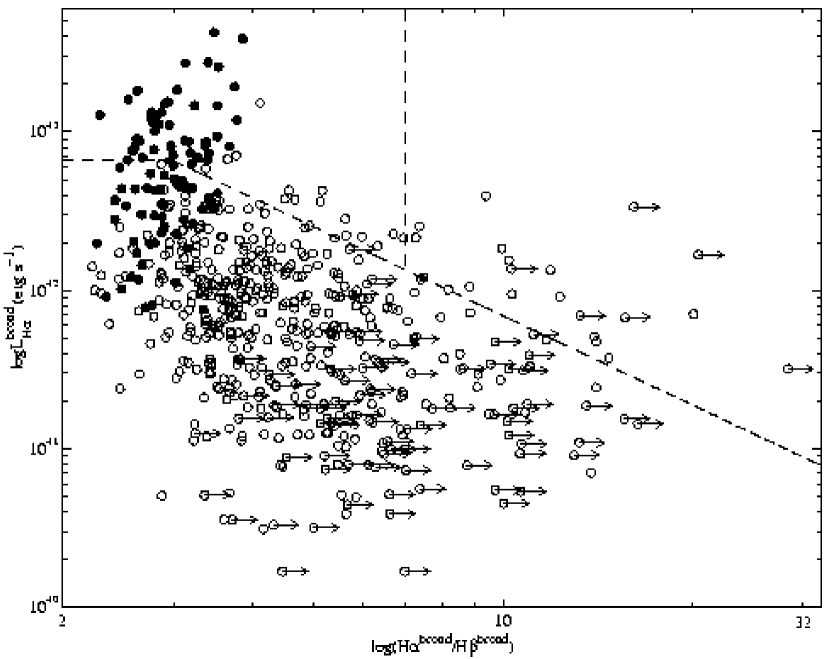
Figure 4 shows the observed luminosity of the broad H component versus the H/H ratio for all the 583 objects in the parent sample. The tilted line corresponds to our quasar selection limit, i.e., mag or erg s-1. Out of the 80 objects above the tilted line, we compile a partially obscured QSO sample of 21 objects with H/H 7 (listed in Table 1). The H/H 7 criterion is set to pick up those objects with relatively severe obscuration, in analogy with type 1.8/1.9 Seyfert galaxies. By this criterion, the sample satisfies the requirement of the intrinsic nuclear luminosity 10 times greater than the observed one or E(B-V) 0.75, which is reddened more severely than the dust reddened quasars (E(B-V) 0.5) compiled by Richards et al. (2003) from the SDSS QSO catalog. The SDSS spectra of the 21 objects are shown in Figure 1 (the left panel).
| Object | Flux | FluxaaAdopting the profile of broad H. | Flux | FWHM | M | Host | |
|---|---|---|---|---|---|---|---|
| [O III] 5007 | H, broad | H, broad | H, broad | ||||
| bb(1) hhmmss.ssddmmss.s; (3),(4) and (5) in unit of 10-17 erg cm-1 s-1; (6) in unit of km s-1; (7) estimated absolute magnitude based on the reddening-corrected luminosity of broad Hα line; (8) Morphology of the host galaxy: E for early type (E, S0, Sa), S for late type. (1) | (2) | (3) | (4) | (5) | (6) | (7) | (8) |
| 003511.48004918.1 | .1859 | 2066 | 25417 | 184731 | 4298 | -23.2 | EddClassified according to likelihoods and concentration index. |
| 003916.41003232.8 | .1098 | 8959 | 7320 | 108121 | 4135 | -22.6 | EccClassified by visual inspection. |
| 004527.06004237.7 | .1095 | 242615 | 125 | 196834 | 3684 | -23.6 | EccClassified by visual inspection. |
| 015521.70004150.0 | .2699 | 4827 | 14513 | 136639 | 4547 | -21.5 | ? |
| 020036.60004549.3 | .1672 | 2784 | 57 | 76525 | 10004 | -23.2 | ? |
| 023305.96003856.4 | .2445 | 1403 | 5411 | 44820 | 4555 | -22.5 | EddClassified according to likelihoods and concentration index. |
| 030201.22010117.9 | .1666 | 249215 | 91 | 186433 | 5176 | -25.4 | ? |
| 031142.02005918.9 | .2815 | 1234 | 4712 | 48130 | 5093 | -23.5 | EddClassified according to likelihoods and concentration index. |
| 101405.89000620.3 | .1411 | 5228 | 340 | 550975 | 20854 | -25.7 | EccClassified by visual inspection. |
| 103352.59004403.4 | .1312 | 267318 | 35621 | 355841 | 5465 | -23.7 | SccClassified by visual inspection. |
| 113021.41005823.0 | .1324 | 170112 | 21410 | 255215 | 6300 | -23.8 | EccClassified by visual inspection. |
| 121026.40002137.4 | .2915 | 4214 | 9810 | 72428 | 4381 | -23.4 | EddClassified according to likelihoods and concentration index. |
| 124321.77001537.2 | .1426 | 7298 | 5412 | 76016 | 2791 | -22.8 | EddClassified according to likelihoods and concentration index. |
| 135717.59002013.0 | .2834 | 2393 | 40 | 41933 | 5513 | -23.5 | ? |
| 141003.66001250.2 | .1359 | 3785 | 6512 | 91018 | 3728 | -22.9 | EddClassified according to likelihoods and concentration index. |
| 143727.81002343.5 | .1379 | 3666 | 15811 | 163917 | 3567 | -23.0 | EddClassified according to likelihoods and concentration index. |
| 165641.98632307.7 | .1610 | 3857 | 13 | 38512 | 2109 | -21.0 | ? |
| 170211.15605848.1 | .1649 | 5146 | 8425 | 103631 | 10003 | -23.3 | ? |
| 170601.87601732.4 | .1303 | 2494 | 6917 | 139027 | 8076 | -21.2 | EddClassified according to likelihoods and concentration index. |
| 171832.86531304.7 | .1916 | 1694 | 12914 | 96726 | 2637 | -22.5 | ? |
| 233816.44005029.7 | .1832 | 924 | 10611 | 93916 | 3943 | -22.7 | ? |
3 Discussion
3.1 Testing the assumption of large, internal extinction
We have tentatively classified 21 objects as intermediate type quasars according to their high intrinsic nuclear luminosities estimated by equation (3). The most remarkable property of these objects is their large H/H ratios. Our basic assumption is that their intrinsic H/H ratio is similar to that of the “normal” QSOs, i.e. 2.97, and that the large observed H/H ratio is due to relatively large internal extinction. This assumption is consistent with the fact that the optical continuum of almost all these objects is dominated by the stellar component of the host galaxy (see Figure 1).
To test our assumption, we match the parent sample and 2MASS catalogs and find 286 objects having counterparts within in the 2MASS Point Source Catalog (PSC), without any extended “contamination”and with a reliable magnitude in the band. Of these objects, the bigger the H/H ratio, generally the redder the color is. All sources with H/H ratio 7 have (Figure 5), indicating their H/H ratios and colors are consistent with our assumption. The absolute magnitudes are well correlated with the luminosities of the broad H components of these objects (Figure 6). To eliminate spurious correlations due to the redshift effect, we calculate the partial correlation coefficient for a redshift, , as:
| (4) |
where the , refer to the H luminosity and the absolute magnitude, and , and the correlation coefficients between and , and , and and . The partial correlation coefficient is -0.625 with a chance probability of 0.0001 for log and , and goes up in absolute value to -0.724 for log and estimated according to our assumption. Again, this favors our assumption of large internal extinction.
The extinction assumption is also substantiated by the relatively high [O III] luminosity. In addition to H luminosity, there is observational evidence that [O III] luminosity can be used as a rough estimate of the intrinsic power of an AGN, even in type 2 objects (Véron-Cetty & Véron 2000 and references therein). Figure 7 plots the relation between [O III] luminosity and the estimated nuclear absolute magnitude for the objects with reliable [O III] 5007 emission and reliable broad-line Balmer decrements in the parent sample. The [O III] luminosities are corrected for intrinsic extinction assuming an intrinsic Balmer decrement equal to 3.1 for the narrow components of H and H (cf., Veilleux & Osterbrock 1987), and the intrinsic nuclear absolute magnitudes are estimated based on the intrinsic luminosity of the broad H component according to equation (1) and equation (3). It is clear that the two are correlated, though the scatter in this relation is much larger than that for the correlation between the observed continuum and the H luminosity for the blue AGN (see Figure 2). The derived partial correlation coefficient is -0.578 for log and with a chance probability of 0.001. Hence, the correlation indicated in Figure 7 is not due to the redshift effect. The 87 QSOs/Seyfert 1s in the BQS sample (Boroson & Green, 1992) as well as all the intermediate type quasars are both plotted for comparison. The [O III] luminosity of these intermediate quasars are comparable to that of luminous QSOs in the BQS sample and about 10 times more luminous than that of Seyfert galaxies, suggesting that they very possibly contain a quasar-like nucleus. However, from the relatively greater scatter of the relation between log and for both the luminous PG QSOs and our intermediate type QSOs, we may infer that the [O III] luminosity is not a good calibrator for higher nuclear luminosity.
The source of obscuration may be small scale dusty material near the nucleus or a large scale dust lane in the host galaxy. For the mean [O III] luminosity of our intermediate quasars, the narrow line region (NLR) size is typically of kpc scale (Bennert et al. 2002). The kpc scale dust lane would also produce large reddening in the NLR, while small scale dusty material would not. To see which of these probabilities is most likely, we plot in Figure 8 the H/H ratio of the broad component versus that of the narrow component for 141 objects with reliably measured, narrow H, H lines, including 9 objects which are intermediate type QSOs. First, it can be seen that our intermediate type quasars, together with most of the other partly obscured AGN, show no or moderate reddening in the NLR as indicated by the narrow H/H ratio in the range , while some of them show heavy reddening in the BLR with the broad H/H ratio 8 and up to 20. Hence, the absorbing material could be the dusty torus similar to that seen in Seyfert galaxies, or some other small scale obscuring material in the nuclear region. However a patchy, large scale dust lane cannot be ruled out. Second, for a rather larger number of objects, however, both broad and narrow lines are comparably reddened to some considerable extent (with the narrow and broad H/H ratios 5), indicating that the absorbing material might be a kpc scale dust lane or molecular disk in the host galaxy, which can play a major role in producing moderate, but not heavy, reddening.
3.2 Emission lines and continua
The broad H FWHMs of the 21 objects scatter widely from 2,100 km s-1 (SDSS J165641.98+632307.7) to 20,000 km s-1 (SDSS J101405.89+000620.3), with a median value of 4500 km s-1.
In Figure 9 we plot [O III]5007/H versus [N II]/H and [S II]/H respectively for the 21 quasars. Most of the objects are located in the AGN region of the diagram (Veilleux & Osterbrock, 1987) and the distribution is similar to that of Seyfert 2 galaxies, indicating that these objects are similar to normal Seyfert galaxies in the properties of the NLR. Thus quasars, even bona fide type 2 quasars, should also bear these properties. This result is consistent with the recent HST observations of the NLR of bright radio-quiet PG QSOs by Bennert et al. (2002), who also suggested that the NLR in quasars is a scaled-up version of that of Seyfert galaxies. However, there is one exception. SDSS J170601.87+601732.4 is located at the border between AGN and LINERs, with [O II]3727/[O III]50071, yet [O I]6300/[O III]50071/3. It has an unusual spectrum and in fact is the only object in the parent sample that cannot be well fitted by our galaxy templates. We will discuss this object in detail in § 3.5.
Our sample of intermediate type quasars can be considered to be optically selected, since 19 of them are optical-color selected for SDSS spectroscopic follow-up, and only 2 of them are selected based on ROSAT detection. We find 6 of the 21 intermediate type quasars have FIRST/NVSS222Faint Images of the Radio Sky at Twenty Centimeters, Becker et al. 1995; NRAO VLA Sky Survey, Condon et al. 1998. counterparts within 5″, and the radio detection rate is about 288%. This ratio is slightly higher than that of the 49 optically selected quasars (only 2 objects are selected based on ROSAT detection) at z 0.3 in the SDSS Quasar Catalog (Schneider et al. 2002), which is 14%. Note an even larger radio detection rate was reported by Richards et al. (2001), who found that nearly half of the reddened quasars are FIRST radio sources. There is only one radio-loud object in each sample (Schneider et al.’s and ours). Moreover, each is the only source resolved by FIRST.
3.3 The fraction of partially obscured quasars
In the same parent sample where we select our 21 intermediate type quasars, we also pick up 44 type 1 QSOs. The selection criteria we used are log (i.e., ), and small Balmer decrements: . The ratio of type 1 QSOs and the intermediate type-1s is 44:212.1:1. It should be pointed out that the above two sub-samples may not be complete, and the completeness of the samples is mainly affected by two factors: 1) the quality of the spectra which influenced our candidate selection and 2) the magnitude limit that SDSS used to select targets for spectroscopic observation. The spectral quality does not affect the selection of type 1 quasars, all of which have high S/N spectra, however it is not negligible for the selection of intermediate type quasars. In Figure 4 we can see that the main incompleteness comes from the measurement of the broad component. For many objects, due to the limited spectra quality, we can only give upper limits to the broad flux. Thus our sample is conservative. A quick calculation shows that if we decrease the upper limits by 50%, 20 more sources would pass our selection criteria. We also check the possible incompleteness due to the requirement of at least a 5 detection of a broad H component. This potential selection effect is negligible, as discussed below. We note that over half (13 of 21) of the intermediate type QSOs are from the SDSS galaxy catalog with a magnitude limit of 17.77, and that the typical S/N ratio at this magnitude is 17.5. We can evaluate the limiting EW of the broad H line with this typical S/N ratio and the median FWHM of the sample QSOs (4500 km s-1) corresponding to our criterion for reliable broad H line (), which turn out to be 8 Å. Actually, the EWs of all the 21 objects are greater than 30 Å.
In order to correct the bias caused by the magnitude limit imposed on the spectroscopic target selection, for each object we calculate where the object would reach the magnitude limit for SDSS spectroscopic follow-up. The corrected number of sources is estimated as , where is the comoving volume within , and is that within the smaller of and 0.3. After the bias correction for this imposed magnitude limit, the number of intermediate type QSOs rises to 60.4 and the number of type 1 QSOs remains untouched. The bias corrected ratio of type 1 QSOs to intermediate type QSOs then becomes 44:60.41:1.4. To compare this with Seyfert galaxies, we pick up 12 objects from our intermediate type QSO sample which should be classified as type 1.8 or type 1.9 according to the quantitative classification introduced by Winkler (1992), and the bias corrected number for these type 1.8+1.9 objects is 39.1. Thus the ratio of type 1 QSOs to the type 1.8+1.9 is 44:39.1 1:1, which is almost the same as that of Seyfert galaxies (cf., Sy1.8+1.9:Sy1 1:1, Forster, 1999). But we must note that these above ratios rely on the intrinsic H/H ratio and the internal extinction curve we adopt for those intermediate type AGN. For example, if the intrinsic H/H ratio is set to 4.0, there are 13 intermediate type QSOs remaining and the bias corrected ratio of type 1 QSOs to intermediate type QSOs changes to 44:30.81.4:1.
This large fraction of obscured quasars have also been reported in many other studies. Through studying the red quasars in the Parkes Half-Jansky Flat-spectrum Sample, Webster et al. (1995) proposed that 80% of quasar population is dust-obscured and has been missed by optical surveys, if the dust content around radio-quiet quasars is as extensive as that around the radio-loud ones. Lacy et al. (2002) also suggested that the red quasar population could be very large through modelling the selection effects which turn out to be effective at removing dust-reddened quasars from magnitude-limited samples. Whiting et al. (2001), however, found that 40% of the Parkes sources show evidence for optical synchrotron emission, which is responsible for the red color of red radio-loud quasars in Webster et al.’s sample, as Serjeant & Rawlings (1996) argued. In that case, any missing population of quasars would be much smaller. But a recent study by White et al. (2003), based on a sample constructed by comparing the FIRST survey with a -band survey, strongly supports the hypothesis that radio-loud and radio-intermediate quasars are dominated by a previously undetected population of red, heavily dust-obscured objects, although they do not know whether this kind of quasars are common in the radio-quiet population. Our sample is almost purely optically selected, with only one radio-loud object (see § 3.2), therefore we can safely conclude that dust-obscured quasars are also common in the radio-quiet population. As stated in §3.1, the obscuring material should be on small scales in the nucleus of the quasars.
Using the SDSS quasar catalog, Richards et al. (2003) found that the redness of quasars whose colors cannot be fitted with a single pow-law continuum is caused by dust extinction instead of synchrotron emission, and moderately dust-obscured ( E(B-V) 0.5) quasars account for 15% of broad-line quasars. As mentioned earlier, our sample is focused on heavily obscured quasars (E(B-V) 0.75), with over half of its members from the SDSS galaxy catalog. Considering that Richards et al.’s sample is restricted to the SDSS quasar catalog, our result is marginally consistent with theirs.
3.4 Properties of the host galaxies
The host galaxy properties of quasars are generally difficult to determine as the stellar component is usually overwhelmed by the luminous quasars. High resolution ground and space observations are usually the only way to detect the existence of the host galaxy. Our sample of intermediate type quasar provides us with an excellent opportunity to study their host galaxies, since their nuclear emission is strongly attenuated by the obscuration. In this subsection, we try to draw some straightforward conclusions about the morphologies of the host galaxies. The study of star forming history in the host galaxies of these objects is deferred to another paper.
In Figure 10, we present the SDSS images. For 5 bright objects with mag, we classify the type of host galaxy visually. For the remainder, the criteria for ellipticals are:
-
•
concentration index in (cf. Bernardi et al. 2003);
-
•
the likelihood of the de Vaucouleurs profile fit is 0.5, and greater than the likelihood of the exponential model at least by 0.1.
The criteria for spirals are:
-
•
concentration index in ;
-
•
the likelihood of the exponential model fit is 0.5, and greater than the likelihood of the de Vaucouleurs profile fit at least by 0.1.
Following the above procedure, we classify 13 objects in total: 1 resides in a spiral, and 12 reside in ellipticals (listed in Table 1). The other 8 objects are left unclassified. This is consistent with the result from HST observations that the host galaxies of 2/3 QSOs are ellipticals (Hamilton et al. 2002).
Some objects show possible evidence for either interacting or peculiar morphology. SDSS J170211.15+605848.1 has two companions, with one at a very close projected distance ( or less than 10 kpc physical distance). SDSS J170601.87+601732.4 may have companion galaxies also. SDSS J103352.59+004403.4 has a compact core and a very extended (50 kpc in diameter) low surface brightness disk viewed nearly edge on. SDSS J171832.86+531304.7 has a faint spiral structure, and could be a spiral galaxy.
3.5 Notes on individual objects
SDSS J101405.89+000620.3: The broad H FWHM of this object is extremely large (20078419.8 km s-1). Its broad H profile has a flat-top, similar to the double peaked line profile seen in some radio galaxies (e.g., Osterbrock, Koski, & Phillips 1976; Halpern & Filippenko 1988; Halpern et al. 1996). It is a 2MASS red AGN (Cutri et al. 2001) with a red near infrared color of J-Ks=2.0120.106 mag and is bright in the near infrared (J=15.2400.061, H=14.3110.057, and Ks=13.2280.045).
Note 19 out of the 21 intermediate type quasars are in the 2MASS Point Source Catalog, among these only 2 have J-Ks 2, 16 objects have 1.2 2, and 1 (SDSS J170601.87+601732.4) has . Besides SDSS J101405.89+000620.3, the other red object is SDSS J103352.59+004403.4, with . This means that most of the partially obscured quasars would be omitted by the 2MASS red AGN survey ( 2). The relatively bluer colors may be caused by the starlight from their host galaxies.
SDSS J113021.41+005823.0: This object may be classified as a FR II radio galaxy according to the usual classification criteria. Like SDSS J101405.89+000620.3, its broad H profile also has a flat top. One interesting feature of this object is that it shows rare X-shaped radio morphology with possible flows from the central radio component to the wings. A detailed discussion of this source was presented in Wang et al. (2003).
SDSS J135717.59+002013.0: This object may be taken as a heavily reddened cousin of the famous “post-starburst quasar” UN J1025-0040 (, Brotherton et al. 1999) located at a lower redshift (): its spectrum displays prominent Balmer jump and high-order Balmer absorption lines indicating a substantial, young stellar population. It is a ROSAT X-Ray source, with a fairly high luminosity in the soft X-ray band (LX = 7.211044 erg s-1, uncorrected for internal extinction). It has a rather flat ROSAT X-ray spectrum with photon index =1.12, indicating a heavy internal absorption. It is also fairly luminous in the near infrared, with before internal extinction correction.
SDSS J170601.87+601732.4: As mentioned in § 3.2, its spectrum is the only one in the parent sample that cannot be well fitted even using 24 eigenspectra derived from the STELIB library. Its unusual spectrum is probably not be due to contamination by a foreground star, since the nearest star is 10 far away. However, the possibility of a foreground star sitting right on the galaxy can not be completely ruled out. The poor spectral fit should not be due to improper flux calibration or sky subtraction either, for other spectra in the same plate look well-calibrated. In the light of prominent absorption lines and absorption bands presented in the spectrum, we propose that this spectrum is dominated by a very old and high metallicity stellar population, which is beyond the coverage of the STELIB library and thus cannot be modelled by our galaxy templates which are based on the library. As noted in § 3.2, this object is LINER-like. Most LINERs are found to have predominantly old stellar populations (Fernandes et al. 2004; González Delgado et al. 2004), which reinforces our proposal. We tend to believe that the broad H component in this object is real, but not formed by nearby absorption of neutral metals and molecules in an old stellar population, because: 1) its conspicuous and smooth line profile is different from that of the other smaller bumps blueward of it, which are likely due to nearby absorption, and 2) there is no strong absorption redward of the H emission line. Thus, SDSS J170601.87+601732.4 may be a heavily reddened, luminous version of “LINER 1s” (Ho et al. 1997b).
4 Summary and Future Prospects
We have compiled a sample of 21 objects with relatively strong broad-H but very weak broad-H emission. Assuming that the broad line is produced by photo-ionization process and that the large Balmer decrement is due to internal reddening, the intrinsic optical continuum luminosity of the nuclei, or the lower limit on it, is estimated to have absolute magnitude M-22m.5, implying that these are intermediate type quasars. The ratio of these intermediate type quasars to type 1 quasars is similar to that of intermediate type Seyfert galaxies to type 1 Seyfert galaxies, indicating that quasars may be somewhat similar to Seyfert galaxies in structure. The narrow lines of these intermediate type quasars are found to be similar to those of Seyfert galaxies in line ratios, but more luminous. Our study has revealed that these partially obscured quasars tend to be hosted in early type galaxies more frequently than in late type galaxies. thus, these partially obscured quasars are important for the studies of the host galaxies related to morphology, stellar velocity dispersion and stellar population, and also the relation between the QSO phenomenon and the galactic evolution. A larger sample with higher S/N ratio is being constructed based on the observations in the SDSS Data Release 2.
Further multi-band observations are essential to reveal the nature of these intermediate type quasars. Some individual objects in the sample are also very interesting and deserve further research. Hard X-ray observations, which can be done by XMM-Newton and/or (Wilkes et al. 2002), would enable us to study the strong obscuration, and derive the intrinsic luminosity using an independent approach. Optical polarization spectroscopy would also help determine the geometry of scattering/obscuring matter inside these objects, using an approach similar to that carried out for infrared selected quasars (Smith et al. 2000).
References
- Akiyama, Ueda, & Ohta (2002) Akiyama, M., Ueda, Y., & Ohta, K. 2002, ApJ, 567, 42
- Antonucci (1993) Antonucci, R. 1993, ARA&A,31, 473
- Balogh et al. (1999) Balogh, M. L., Morris, S. L., Yee, H. K. C., Carlberg, R. G., & Ellingson, E. 1999, ApJ, 527, 54
- Barger et al. (2003) Barger, A. J., et al. 2003, AJ, 126, 632
- Becker, White, & Helfand (1995) Becker, R. H., White, R. L., & Helfand, D. J. 1995, ApJ, 450, 559
- Bennert et al. (2002) Bennert, N., Falcke, H., Schulz, H., Wilson, A. S., & Wills, B. J. 2002, ApJ, 574, L105
- Bernardi et al. (2003) Bernardi, M., et al. 2003, AJ, 125, 1817
- Boroson & Green (1992) Boroson, T. A. & Green, R. F. 1992, ApJS, 80, 109, , BG92
- Boyle et al. (1998) Boyle, B. J., Almaini, O., Georgantopoulos, I., Blair, A. J., Stewart, G. C., Griffiths, R. E., Shanks, T., & Gunn, K. F. 1998, MNRAS, 297, L53
- Brotherton et al. (1999) Brotherton, M. S., et al. 1999, ApJ, 520, L87
- Condon et al. (1998) Condon, J. J., Cotton, W. D., Greisen, E. W., Yin, Q. F., Perley, R. A., Taylor, G. B., & Broderick, J. J. 1998, AJ, 115, 1693
- Cutri & et al. (2001) Cutri, R. M. & et al. 2001, ASP Conf. Ser. 232: The New Era of Wide Field Astronomy, 78
- Della Ceca et al. (2003) Della Ceca, R., et al. 2003, A&A, 406, 555
- Eisenstein et al. (2001) Eisenstein, D. J. et al. 2001, AJ, 122, 2267
- Ferland & Osterbrock (1985) Ferland, G. J. & Osterbrock, D. E. 1985, ApJ, 289, 105
- Fernandes et al. (2004) Fernandes, R. C., et al. 2004, ApJ, 605, 105
- Fitzpatrick (1999) Fitzpatrick, E. L. 1999, PASP, 111, 63
- Forster (1999) Forster, K. 1999, Thesis (PhD). COLUMBIA UNIVERSITY, Source DAI-B 60/01, p. 219, Jul 1999, 442 pages.
- Francis (1996) Francis, P. J. 1996, Publications of the Astronomical Society of Australia, 13, 212
- Gilli, Salvati, & Hasinger (2001) Gilli, R., Salvati, M., & Hasinger, G. 2001, A&A, 366, 407
- González Delgado et al. (2004) González Delgado, R. M., Cid Fernandes, R., Pérez, E., Martins, L. P., Storchi-Bergmann, T., Schmitt, H., Heckman, T., & Leitherer, C. 2004, ApJ, 605, 127
- Halpern & Filippenko (1988) Helpern, J. P. & Filippenko, A. V. 1988, Nature, 331, 46
- Halpern, Eracleous, Filippenko, & Chen (1996) Halpern, J. P., Eracleous, M., Filippenko, A. V., & Chen, K. 1996, ApJ, 464, 704
- Hamilton, Casertano, & Turnshek (2002) Hamilton, T. S., Casertano, S., & Turnshek, D. A. 2002, ApJ, 576, 61
- Hasinger et al. (2001) Hasinger, G., et al. 2001, A&A, 365, L45
- Ho, Filippenko, & Sargent (1997) Ho, L. C., Filippenko, A. V., & Sargent, W. L. W. 1997a, ApJS, 112, 315
- Ho, Filippenko, & Sargent (1997) Ho, L. C., Filippenko, A. V., & Sargent, W. L. W. 1997b, ApJ, 487, 568
- Ho & Peng (2001) Ho, L. C. & Peng, C. Y. 2001, ApJ, 555, 650
- Kauffmann et al. (2003) Kauffmann, G., et al. 2003, MNRAS, 341, 33
- Kewley et al. (2001) Kewley, L. J., Dopita, M. A., Sutherland, R. S., Heisler, C. A., & Trevena, J. 2001, ApJ, 556, 121
- Krolik (1999) Krolik, J. 1999, Active Galactic Nuclei: from the central black hole to the galactic environment (Princeton U Press:Princeton)
- Lacy et al. (2002) Lacy, M., Gregg, M., Becker, R. H., White, R. L., Glikman, E., Helfand, D., & Winn, J. N. 2002, AJ, 123, 2925
- Lawrence (1991) Lawrence, A. 1991, MNRAS, 252, 586
- Le Borgne et al. (2003) Le Borgne, J.-F., et al. 2003, A&A, 402, 433
- Li et al. (2004) Li, C., Wang, T., Zhou, H., Dong, X., & Cheng, F. 2004, AJ accepted, (astro-ph/0407015)
- Marconi & Salvati (2002) Marconi, A. & Salvati, M. 2002, ASP Conf. Ser. 258: Issues in Unification of Active Galactic Nuclei, 217
- Mushotzky, Cowie, Barger, & Arnaud (2000) Mushotzky, R. F., Cowie, L. L., Barger, A. J., & Arnaud, K. A. 2000, Nature, 404, 459
- Norman et al. (2002) Norman, C., et al. 2002, ApJ, 571, 218
- Osterbrock, Koski, & Phillips (1976) Osterbrock, D. E., Koski, A. T., & Phillips, M. M. 1976, ApJ, 206, 898
- Richards et al. (2001) Richards, G. T., et al. 2001, AJ, 121, 2308
- Richards et al. (2003) Richards, G. T., et al. 2003, AJ, 126, 1131
- Rosati et al. (2002) Rosati, P., et al. 2002, ApJ, 566, 667
- Sanders et al. (1988) Sanders, D. B., Soifer, B. T., Elias, J. H., Madore, B. F., Matthews, K., Neugebauer, G., & Scoville, N. Z. 1988, ApJ, 325, 74
- Schlegel, Finkbeiner, & Davis (1998) Schlegel, D. J., Finkbeiner, D. P., & Davis, M. 1998, ApJ, 500, 525
- Schneider et al. (2002) Schneider, D. P. et al. 2002, AJ, 123, 567
- Serjeant & Rawlings (1996) Serjeant, S., & Rawlings, S. 1996, Nature, 379, 304
- Shuder (1981) Shuder, J. M. 1981, ApJ, 244, 12
- Simpson (2003) Simpson, C. 2003, New Astronomy Review, 47, 211
- Smith et al. (2002) Smith, P. S., Schmidt, G. D., Hines, D. C., Cutri, R. M., & Nelson, B. O. 2002, ApJ, 569, 23
- Stoughton et al. (2002) Stoughton, C. et al. 2002, AJ, 123, 485
- Strateva et al. (2001) Strateva, I. et al. 2001, AJ, 122, 1861
- Strauss et al. (2002) Strauss, M. A. et al. 2002, AJ, 124, 1810
- Veilleux & Osterbrock (1987) Veilleux, S. & Osterbrock, D. E. 1987, ApJS, 63, 295
- Véron-Cetty & Véron (2000) Véron-Cetty, M. P. & Véron, P. 2000, A&A Rev., 10, 81
- Véron-Cetty & Véron (2001) Véron-Cetty, M.-P. & Véron, P. 2001, A&A, 374, 92
- Wang, Zhou, & Dong (2003) Wang, T., Zhou, H., & Dong, X. 2003, AJ, 126, 113
- Webster et al. (1995) Webster, R. L., Francis, P. J., Peterson, B. A., Drinkwater, M. J., & Masci, F. J. 1995, Nature, 375, 469
- White et al. (2003) White, R. L., Helfand, D. J., Becker, R. H., Gregg, M. D., Postman, M., Lauer, T. R., & Oegerle, W. 2003, AJ, 126, 706
- Whiting, Webster, & Francis (2001) Whiting, M. T., Webster, R. L., & Francis, P. J. 2001, MNRAS, 323, 718
- Wilkes et al. (2002) Wilkes, B. J., Schmidt, G. D., Cutri, R. M., Ghosh, H., Hines, D. C., Nelson, B., & Smith, P. S. 2002, ApJ, 564, L65
- Winkler (1992) Winkler, H. 1992, MNRAS, 257, 677
- Yee (1980) Yee, H. K. C. 1980, ApJ, 241, 894
- York et al. (2000) York, D. G. et al. 2000, AJ, 120, 1579
- Yu & Tremaine (2002) Yu, Q. & Tremaine, S. 2002, MNRAS, 335, 965