Quantifying the Cosmic Web in the New Era of Redshift Surveys
Abstract
Two main strategies have been implemented in mapping the local universe: whole-sky ‘shallow’ surveys and ‘deep’ surveys over limited parts of the sky. The two approaches complement each other in studying cosmography and statistical properties of the Universe. We summarise some results on the power spectrum of fluctuations and Wiener reconstruction of the density field from the 2dF Galaxy Redshift Survey (2dFGRS) of 230,000 redshifts. We then discuss future challenges in quantifying the web of cosmic structure in the on-going redshift surveys.
Department of Physics and Astronomy , University College London,
Gower Street, London WC1E 6BT, UK
1. Introduction
The recent measurements of the Cosmic Microwave Background fluctuations, supernovae Ia, redshift surveys, clusters of galaxies and other probes suggest a ‘concordance’ model in which the universe is flat and contains approximately 4% baryons, 26% cold dark matter and 70% dark energy. It remains to be seen if this model will survive future tests, but in any case there are many challenges ahead to understand the formation of galaxies, and how they trace the mass distribution in the non-linear regime. Redshift surveys provide an important bridge between ‘linear cosmology’ and the more complex processes of galaxy formation.
Two main strategies have been implemented in mapping the local universe: whole-sky ‘shallow’ surveys (e.g. IRAS) and ’deep’ surveys over a limited parts of the sky (e.g. 2dFGRS, SDSS). The Table below summarises the properties of the main new surveys: 2dFGRS111http://www.mso.anu.edu.au/2dFGRS/, SDSS222http://www.sdss.org/ + LRG333Another part of the SDSS is the ‘Luminous Red Galaxies’ (LRG) with median redshift , An extension of the survey to higher redshift is now underway utilising 2dF., 2MASS444http://www.ipac.caltech.edu/2mass/ /6dFGS555http://www.mso.anu.edu.au/6dFGS/, DEEP2666http://deep.berkeley.edu/, and VIRMOS777http://www.astrsp-mrs.fr/virmos/.
| Survey | number of galaxies | median redshift | angular coverage (sq. deg) |
|---|---|---|---|
| 2dFGRS | 230k | 0.1 | 1,800 |
| SDSS | 1000k | 0.1 | 10,000 |
| 2MASS-2MRS | 25k | 0.02 | 40,000 |
| 2MASS-6dFGS | 150k | 0.05 | 20,000 |
| DEEP2 | 65k | 3.5 | |
| VIRMOS | 150k | 16 |
Each strategy has its pros and cons. The whole-sky surveys have given useful ’full picture’ of the local cosmography and they have allowed us to predict the local velocity field assuming that light roughly traces mass. The complete picture depends on careful mapping of the Zone of Avoidance (ZoA), as discussed in detail at the Proceedings of this Cape Town (2004) meeting and at the previous two ZoA conferences in Paris (1994) and Mexico (2000). The deep limited-sky surveys are very useful for statistical studies such as the power spectrum. Both types of surveys pose challenges for quantifying the web of cosmic structure.
Using simulations Bond, Kofman & Pogosyan (1996) coined the term ‘cosmic web’ and argued that a filament-dominated structure was already present in the overdensity fields of the initial Gaussian fluctuations, and was then amplified over a Hubble time by non-linear gravitational dynamics. In the new era of large redshift surveys (see the Table) and huge simulations the next important step is to quantify this ‘cosmic web’ using various novel statistical measures beyond the traditional methods (e.g. Martinez & Saar 2002; Lahav & Suto 2004 for reviews) and to identify ‘Great Attractors’, ‘Great Walls’, ‘Zeldovich pancakes’ and voids. This will allow us to understand the role of initial conditions vs. non-linear gravitational evolution and to constrain cosmological models and scenarios for biased galaxy formation.
2. Results from the 2dF Galaxy Redshift Survey
Redshifts surveys in the 1980s and the 1990s (e.g the CfA, IRAS and Las campanas surveys) measured redshifts of thousands to tens of thousands of galaxies. Multifibre technology now allows us to measure redshifts of millions of galaxies. The Anglo-Australian 2 degree Field Galaxy Redshift Survey888The 2dFGRS Team comprises: I.J. Baldry, C.M. Baugh, J. Bland-Hawthorn, T.J. Bridges, R.D. Cannon, S. Cole, C.A. Collins, M. Colless, W.J. Couch, N.G.J. Cross, G.B. Dalton, R. DePropris, S.P. Driver, G. Efstathiou, R.S. Ellis, C.S. Frenk, K. Glazebrook, E. Hawkins, C.A. Jackson, O. Lahav, I.J. Lewis, S.L. Lumsden, S. Maddox, D.S. Madgwick, S. Moody, P. Norberg, J.A. Peacock, B.A. Peterson, W. Sutherland, K. Taylor. For more details on the survey and resulting publications see http://www.mso.anu.edu.au/2dFGRS/ (2dFGRS) measured redshifts for 230,000 galaxies selected from the APM catalogue. The survey is now complete and publically available. The median redshift of the 2dFGRS is , down to an extinction corrected magnitude limit of (Colless et al. 2001). A sample of this size allows large-scale structure statistics to be measured with very small random errors. Here we summarize some recent results from the 2dFGRS on clustering and galaxy biasing. Comprehensive recent reviews are given by Colless (2003) and Peacock (2003).
2.1. The power spectrum of 2dF galaxies
An initial estimate of the convolved, redshift-space power spectrum of the 2dFGRS has been determined (Percival et al. 2001) for a sample of 160,000 redshifts. On scales , where km/sec/Mpc, the data are robust and the shape of the power spectrum is not affected by redshift-space or non-linear effects, though the amplitude is increased by redshift-space distortions. Percival et al. (2001), Efstathiou et al. (2002) and Lahav et al. (2002) compared the 2dFGRS and CMB power spectra, and concluded that they are consistent with each other.
A key assumption in deriving cosmological parameters from redshift surveys is that the biasing parameter, defined as the ratio of of galaxy to matter power spectra, is constant, i.e. scale independent. On scales of the fluctuations are close to the linear regime, and there are theoretical reasons (e.g. Fry 1996; Benson et al. 2000) to expect that on large scales the biasing parameter should tend to a constant and close to unity at the present epoch. This is supported by the derived biasing close to unity by combining 2dFGRS with the CMB (Lahav et al. 2002) and by the study of the bi-spectrum of the 2dFGRS alone (Verde et al. 2002).
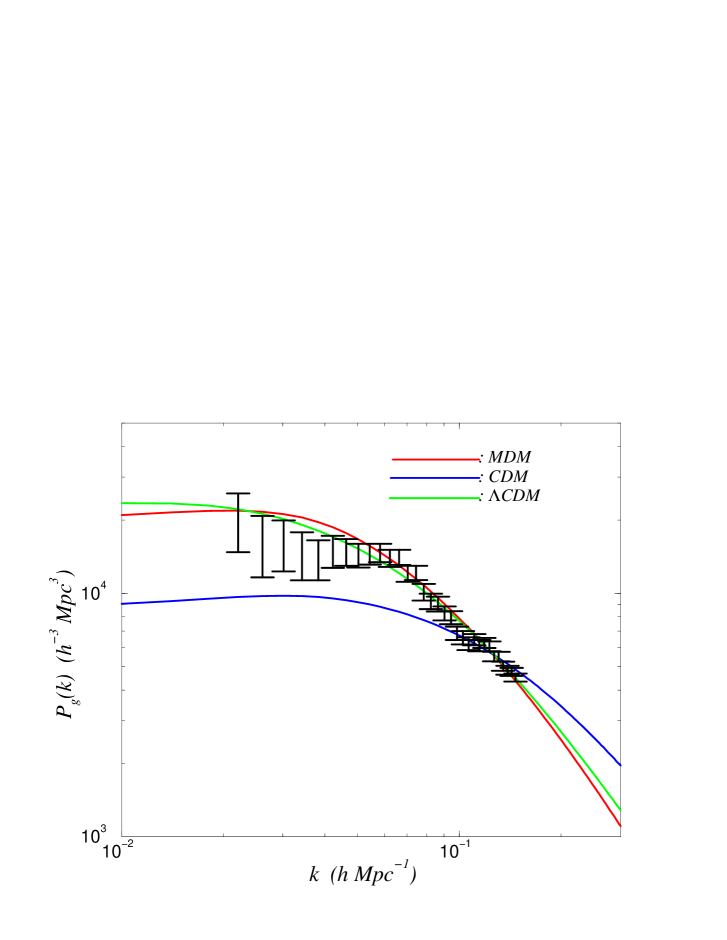
The 2dFGRS power spectrum (Figure 1) was fitted in Percival et al. (2001) over the above range in , assuming scale-invariant primordial fluctuations and a -CDM cosmology, for four free parameters: , , and the redshift space . The amplitudes of the linear-theory rms fluctuations are traditionally labeled in mass in galaxies, defined on Mpc spheres. Assuming a Gaussian prior on the Hubble constant (based on Freedman et al. 2001) the shape of the recovered spectrum within the above -range was used to yield 68 per cent confidence limits on the shape parameter , and the baryon fraction , in accordance with the popular ‘concordance’ model (e.g. Bahcall et al. 1999; Lahav & Liddle 2004). For fixed ‘concordance model’ parameters , and a Hubble constant , the amplitude of 2dFGRS galaxies in redshift space is (at the survey’s effective luminosity and redshift).
Recently the SDSS team presented their results for the power spectrum (Tegmark et al. 2003a,b; Pope et al. 2004), and they found good agreement with the 2dFGRS gross shape of the power spectrum. Pope et al. (2004) emphasize that SDSS alone cannot break the degeneracy between and because the baryon oscillations are not resolved given the window function of the survey.
2.2. Upper limits on the neutrino mass
Solar, atmospheric, and reactor neutrino experiments have confirmed neutrino oscillations, implying that neutrinos have non-zero mass, but without pinning down their absolute masses. While it is established that the effect of neutrinos on the evolution of cosmic structure is small, the upper limits derived from large-scale structure could help significantly to constrain the absolute scale of the neutrino masses. Elgarøy et al. (2002) used the 2dFGRS power spectrum (Figure 1) to provide an upper limit , i.e. approximately 0.7 eV for each of the three neutrino flavours, or phrased in terms of their contribution to the matter density, .
The WMAP team (Spergel et al. 2003) reported an improved limit of (95% CL). Actually the main neutrino signature comes from the 2dFGRS and the Lyman forest which were combined with the WMAP data. The main contribution of WMAP is that it constrains better the other parameters involved, e.g. (see also Hannestad 2003 and Tegmark et al. 2003b for similar results from SDSS+WMAP). Despite the uncertainties involved, it is remarkable that the results from redshift surveys give upper limits which are lower than those deduced from laboratory experiments, e.g. tritium decay.
3. Wiener reconstruction of 2dFGRS
Wiener filtering is a well-known technique and it has been applied to many fields in astronomy. For example, the method was used to reconstruct the angular distribution over the whole sky including the ZoA (Lahav et al. 1994), the real-space density, velocity and gravitational potential fields of the 1.2-Jy IRAS (Fisher et al. 1995). The Wiener filter was also applied to the reconstruction of the maps of the cosmic microwave background temperature fluctuations. A detailed formalism of the Wiener filtering method as it pertains to the large-scale structure reconstruction can be found in Zaroubi et al. (1995). The Wiener filter is optimal in the sense that the variance between the derived reconstruction and the underlying true density field is minimised. As opposed to ad hoc smoothing schemes, the Wiener filtering is determined by the data. In the limit of high signal-to-noise, the Wiener filter modifies the observed data only weakly, whereas it suppresses the contribution of the data contaminated by shot noise.
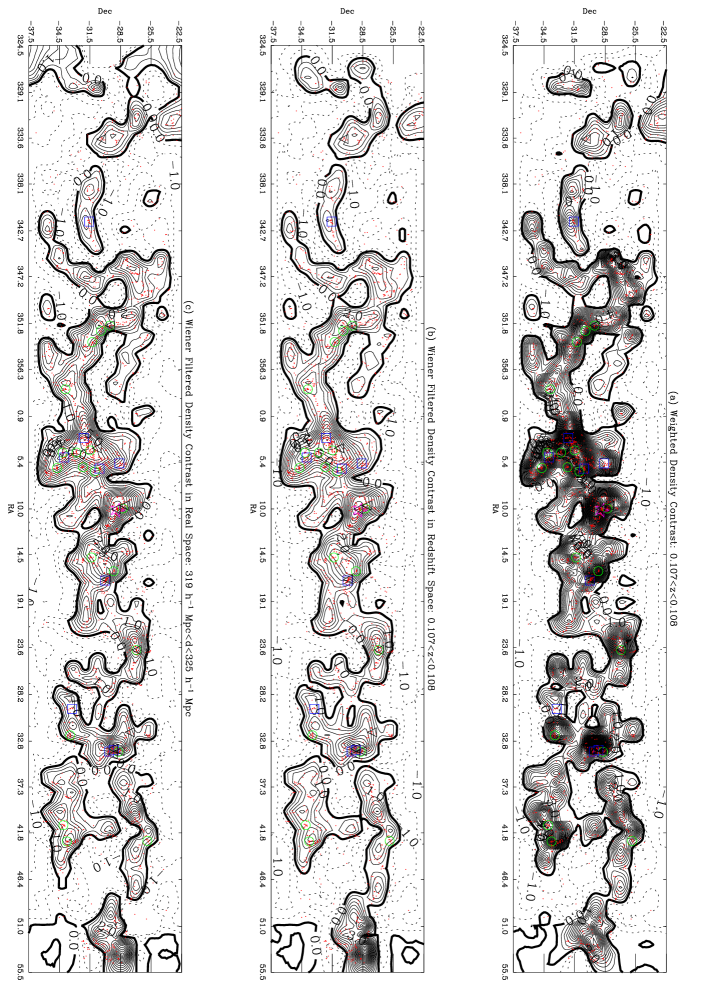
Erdogdu et al. (2004) reconstructed the underlying density field of the Two-degree Field Galaxy Redshift Survey (2dFGRS) for the redshift range using the Wiener filtering method. They used a variable smoothing technique with two different effective resolutions: 5 and 10 Mpc at the median redshift of the survey. They identified all major superclusters and voids in 2dFGRS. In particular, they found two large superclusters and two large local voids. One of the two large superclusters is shown in Figure 2. The full set of colour maps can be viewed on the World Wide Web at http://www.ast.cam.ac.uk/pirin. For comparison see the catalogue of superclusters derived by Einasto et al. (2003) from the SDSS.
4. Discussion: Future studies of the cosmic web
We motivate the great need for new approaches to analysis of redshift surveys and simulations by some illustrative examples:
(i) Consider two images, say of a cat and a dog. If we take Fourier transforms of both, and swap the amplitudes and phases, we will still be able to recognise the cat in the image which retains its original phases, even if it has the amplitudes from the dog’s original image! Phase information is thrown away in the commonly used power spectrum (or its Fourier transform, the two-point correlation function). Two realisations of the galaxy distribution may have the same power spectrum, but they may look very different due to phase correlations. These phase correlations are expected to be due to the non-linear effects in the evolution of the gravitational instability and would arise even if the primordial fluctuations were purely Gaussian.
(ii) The 2-degree-Field Galaxy Redshift Survey (2dFGRS) power spectrum is consistent with the low density () Cold Dark Matter model (Percival et al. 2001). Volume averaged -point correlation functions up to order have recently been calculated (Baugh et al. 2004) and in particular on small scales they are sensitive to the appearance of two rich superclusters in the 2dFGRS volume, one of them is shown in Figure 2. Visual inspection of the Abell catalogue suggests that such superclusters are quite common. However, they seem less common in -CDM simulations which nevertheless do agree with the 2dFGRS power spectrum () statistic. It is important to know whether the -CDM simulations pass the test of high order moments, whether they require strong biasing in high density regions and whether 2dFGRS is a fair sample of the nearby universe.
(iii) Recent studies of higher moments, e.g. the three point correlation function (or its Fourier transform, the bi-spectrum) in both 2dFGRS and SDSS showed that they set important constraints on biasing, although the interpretation is model dependent (e.g. Verde et al. 2002; Kayo et al. 2004).
It is timely to address these issues now for a number of reasons:
For the first time the surveys are large enough to extract volume limited subsets. Some of the statistics (e.g. minimal spanning tree, percolation and Minkowski functionals) could not be applied effectively to flux limited surveys, where the mean separation between observed objects varies with distance from the observer. With volume limited samples we can apply these and new methods easily, and contrast data with simulations on equal footing.
The new surveys are also large enough now to sub-divide the galaxies by colour or spectral type. Recent studies of 2dFGRS and SDSS show the bimodality of galaxy populations in colour or related properties (e.g. Madgwick et al. 2002; Kauffmann et al. 2004) and that clustering patterns of ‘red’ and ‘blue’ galaxies are quite different on scales smaller than 10 Mpc (e.g. Zehavi et al. 2003; Madgwick et al. 2003, Wild et al. 2004).
We can now probe the evolution of clustering patterns with redshift, given DEEP2 and VIRMOS at redshift compared to 2dFGRS and SDSS at .
The N-body simulations (e.g. Virgo) are now well advanced in resolution and volume to allow us to produce 2dF-like or SDSS-like samples.
5. Acknowledgements
I thank the conference organisers for the hospitality in Capetown, and Øystein Elgarøy and Pirin Erdogdu for their contribution to the work presented here. I acknowledge a PPARC Senior Research Fellowship.
References
- (1) Bahcall N.A., Ostriker J.P., Perlmutter S., Steinhardt P.J., 1999, Science, 284, 148
- (2) Baugh, C. & the 2dFGRS team, 2004, submitted to MNRAS, astro-ph/0401434
- (3) Benson A.J., Cole S., Frenk C.S., Baugh C.M., Lacey C.G., 2000, MNRAS, 311, 793
- (4) Bond, R.J., Kofman, L., Pogosyan, D., 1996, Nature, 380, 603
- (5) Colless M., 2003, to appear in Carnegie Observatories Astrophysics Series, Vol.2: Measuring and Modeling the Universe, ed. W.L. Freedman, Cambridge University Press, astro-ph/0305051
- (6) Colless M. & the 2dFGRS team, 2001, MNRAS, 328, 1039
- (7) Einasto, J. et al., 2003, A & A, 405, 425
- (8) Efstathiou G. & the 2dFGRS team, 2002, MNRAS, 330, 29
- (9) Elgarøy, O. & the 2dFGRS team, Phys. Rev. Lett., 2002, 89, 061301
- (10) Elgarøy, O., Lahav, O., 2003, JCAP, 0304, 004
- (11) Erdogdu, P. & the 2dFGRS team, 2004, MNRAS, 352, 939
- (12) Fisher, K.B., Lahav, O., Hoffman, Y., Lynden-Bell, D., Zaroubi, S., 1995, MNRAS, 272, 885
- (13) Freedman W.L., et al., 2001, ApJ, 553, 47
- (14) Fry J.N., 1996, ApJ, 461, L65
- (15) Hannestad S., 2003, astro-ph/0303076
- (16) Kauffmann, G & the SDSS team, 2004, MNRAS, 341, 33
- (17) Kayo, I., et al., 2004, PASJ, in press, astro-ph/0403638
- (18) Lahav, O., Fisher, K.B., Hoffman, Y., Scharf, C.A., Zaroubi, S., 1994, 423, L93
- (19) Lahav, O. & the 2dFGRS Team, 2002, MNRAS, 33, 961
- (20) Lahav, O., Liddle, A., 2004, in The Review of Particle Physics, S. Eidelman et al. (Particle Data Group), Physics Letters B592, 1 (2004); astro-ph/0406681
- (21) Lahav, O., Suto, Y., 2004, in Living Reviews in Relativity, 7(2004)1-81; astro-ph/0311058
- (22) Madgwick D.S. & the 2dFGRS team, 2002, MNRAS, 333, 133
- (23) Madgwick D.S. & the 2dFGRS team, 2003, MNRAS, 344, 847
- (24) Martinez, V.J., Saar, E., 2002, Statistics of the Galaxy Distribution, Chapman & Hall
- (25) Peacock J.A., 2003, to appear in the proceedings of the 13th Annual October Astrophysics Conference in Maryland, ‘The Emergence of Cosmic Structure’, eds. S. Holt and C. Reynolds (AIP), astro-ph/0301042
- (26) Percival W.J. & the 2dFGRS team, 2001, MNRAS, 327, 1297
- (27) Pope, A. & the SDSS team, 2004, submitted to ApJ, astro-ph/0401249
- (28) Spergel, D.N. & the WMAP team, 2003, ApJ Supp, 148, 175
- (29) Tegmark M. & the SDSS team, 2003a, submitted to ApJ, astro-ph/0310725
- (30) Tegmark M. & the SDSS team, 2003b, submitted to ApJ, astro-ph/0310723
- (31) Verde L. & the 2dFGRS team, 2002, MNRAS, 335, 432
- (32) Wild, V. & the 2dFGRS team, 2004, astro-ph/0404275
- (33) Zehavi I. & the SDSS team, 2002, ApJ, 571, 172
- (34) Zaroubi, S., Hoffman, Y., Fisher, K.B., Lahav, O., 1995, ApJ, 449, 446