Atomic carbon in PSS 2322+1944, a quasar at redshift ††thanks: Based on observations obtained with the IRAM Plateau de Bure interferometer.
We report the detection of the fine-structure line of neutral carbon in the quasar PSS 2322+1944, obtained at the IRAM Plateau de Bure interferometer. The [Ci] line is detected with a signal-to-noise ratio of with a peak intensity of and a velocity-integrated line flux of . Assuming an excitation temperature of 43 K (equal to the dust temperature), we derive a mass of neutral carbon (corrected for magnification) of . In PSS 2322+1944, the cooling due to C is about 6 times smaller than for CO, whereas the CO and C cooling represents of the far-infrared continuum and more than half of the cooling due to C+.
Key Words.:
galaxies: formation – galaxies: starburst – galaxies: high-redshift – quasars: emission lines – quasars: individual: PSS 2322+1944 – cosmology: observations1 Introduction
With the detection of dust and molecular gas in sources at high redshift, it has become possible to probe the physical conditions of the interstellar medium in galaxies and in the hosts of quasi-stellar objects (QSOs) at cosmological distances. The high- sources detected in (to date 30 sources between - see, e.g., Greve et al. 2004) have massive reservoirs of warm and dense molecular gas (a few ), which are predominantly excited by extreme starbursts with implied star formation rates . Multiline CO studies are available in only a few cases, and the detection of species other than carbon monoxide is reported in only a couple of sources. A remarkable example is the Cloverleaf, a strong gravitationally lensed QSO at where four CO transitions were detected, together with the two fine-structure lines of neutral carbon [Ci] (Barvainis et al. 1997; Weiß et al. 2003) and the J=10 transition of HCN (Solomon et al. 2003).
Atomic carbon is an important probe of the neutral dense gas. It is a good tracer of molecular gas in external galaxies and plays a central role in the cooling of the gas (Gérin & Phillips 1998, 2000). In high- sources, the detection of the [Ci] lines enables to obtain further constraints on the physical conditions of the interstellar gas in addition to those obtained from the CO transitions (Weiß et al. 2003), providing useful information on the gas column density, the thermal balance, and the UV illumination.
PSS 2322+1944 is an optically luminous, gravitationally lensed QSO at which was studied in detail both in the dust and radio continuum emission (Omont et al. 2001; Beelen et al. 2004) and in the J=54, 43, 21, and 10 transitions lines of CO (Cox et al. 2002; Carilli et al. 2002). With an apparent far-infrared (FIR) luminosity of , it harbors a massive reservoir of molecular gas which is the site of active star formation with an implied star formation rate of . The CO line emission is resolved into an Einstein Ring with a diameter of , a direct indication of lensing. The amplification factor is estimated to be about 3.5. The data are consistent with a disk surrounding the QSO with a radius of 2 kpc and a dynamical mass of a few (Carilli et al. 2003).
The observations of the molecular gas in PSS 2322+1944 provide one of the best examples to date of active star formation in the host galaxy of a luminous, high redshift QSO. The strong CO emission in PSS 2322+1944 makes it a prime target to search for the transition of [Ci] ( GHz) which, at , is shifted into the 3 mm atmospheric window.
Here we report the [Ci] line in PSS 2322+1944. After the detection of [Ci] in the Cloverleaf, and, recently, in IRAS FSC 10214 () and SMM J14011+0252 () reported by Weiß et al. (2004), these observations represent the fourth clear detection of [Ci] in a high- source. In this paper, we assume the concordance -cosmology with , and (Spergel et al. 2003).
| Line | Peak Int. | Position | ||||||
|---|---|---|---|---|---|---|---|---|
| [GHz] | [mJy] | [km s-1] | [Jy km s-1] | [] | [] | |||
| [Ci] | 492.161 | 96.127 | 2.4 | 5225 | 31966 | 0.810.12 | ||
| CO (43)† | 461.041 | 90.048 | 10.3 | 310 | 34840 | 3.830.40 | ||
NOTE. – The CO(43) data are from Cox et al. (2002). The continuum and the line were fitted separately using an a priori line window (between to ) defined from the high signal-to-noise CO 43 spectrum. The luminosities are not corrected for the lens amplification ().
2 Observations and data reduction
Observations of the transition of [Ci] in PSS 2322+1944 were carried out with the IRAM Plateau de Bure interferometer (PdBI) in a series of observing sessions between July 2002 and June 2004. The total integration time of the useful data is equivalent to 34 hours with 6 antennas. In practice, all the observing time was allocated during the summer, when antenna maintenance takes place. The total on-sky integration time amounts to 116 hours often with 4 or 5 (and sometimes with 6) antennas.
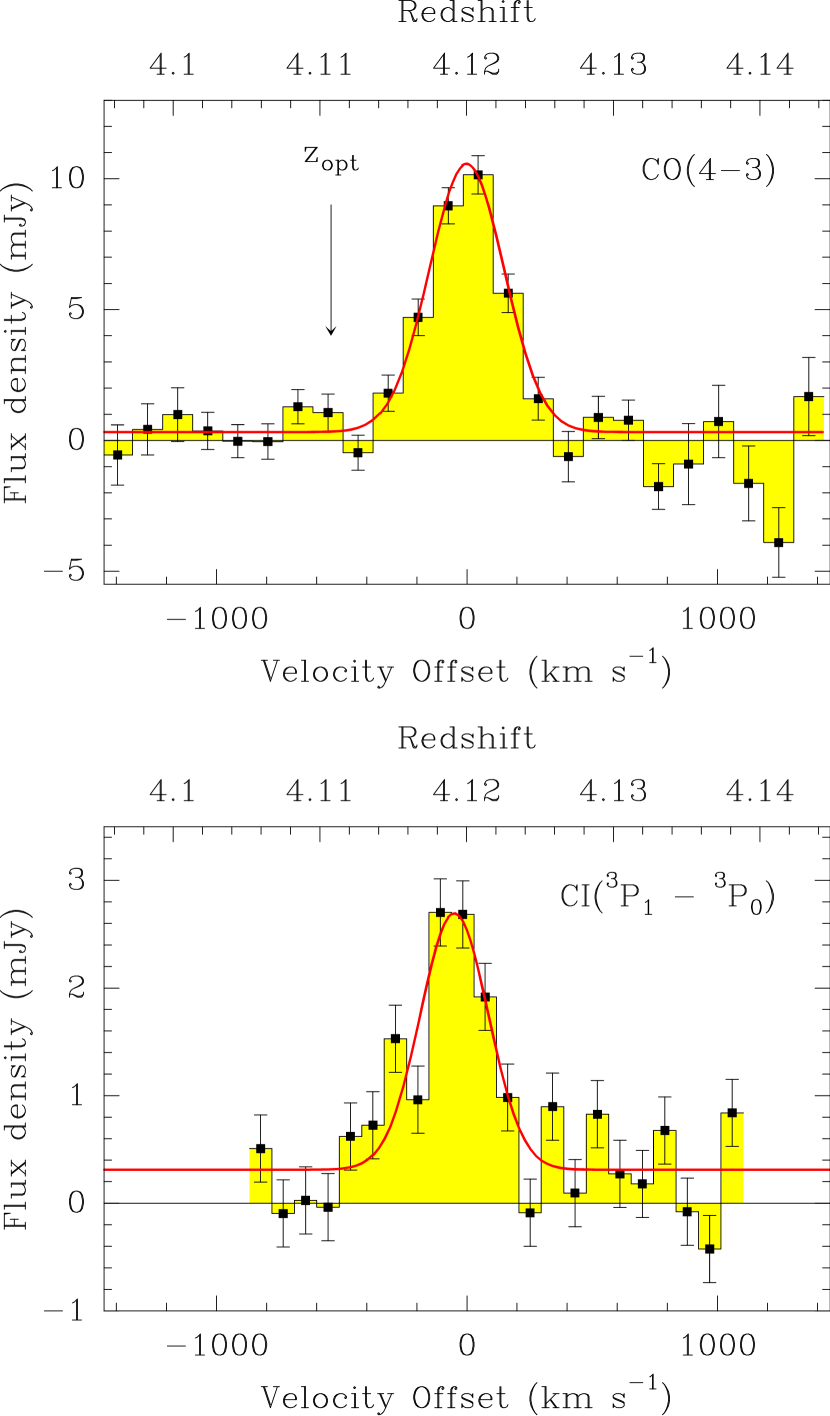
We used the interferometer in the D configuration. The combined 3.2 mm data result in a synthesized beam of at a position angle of . The 3 mm receivers were tuned first at the red-shifted frequency of the [Ci] line, i.e. 96.127 GHz at and then at 96.063 GHz for the second half of the data. This is the reason why the spectrum is noisier at the very ends of the band (Fig. 1). At those frequencies, the typical SSB system temperatures were K. The water vapor ranged between 4 and 10 mm on different sessions. The 580 MHz instantaneous IF–bandwidth were observed with a resolution of 1.5 MHz.
All data reduction were done using the gildas softwares. Standard calibration methods using close calibrators were applied. The bandpass calibration was done on the quasar 3C454.3. The amplitude and phase calibration were performed on 3C454.3 and the nearby quasar 2230+114. Only data with phase noise better than 40 deg were used. The maximum position errors at 3.2 mm introduced by such phase noise is . The flux calibration is based on the PdBI primary calibrator MWC 349. The fluxes of 3C454.3 (resp. 2230+114) varied from 7 to 4 Jy (resp. 4 to 2.4 Jy) during the 3 years observing period.
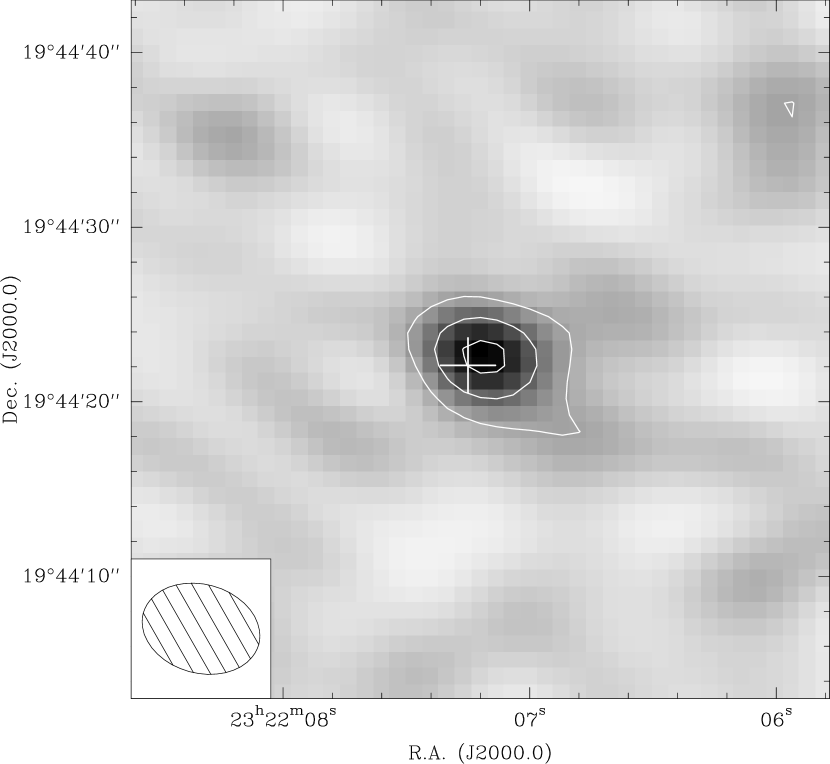
A standard calibrated table was produced and analyzed both by direct fits in the plane (as this avoids the deconvolution step) and by making the deconvolved image shown in Fig. 2. Both methods confirm that the [Ci] emission is i) detected, ii) not resolved by our observations and iii) centered on the optical position which is also the phase center of the observations. The two latter points allow us to derive the source spectrum from the real part of the average of all the complex visibilities. The main advantage of this method is to directly obtain the spectrum from simple operations instead of applying the usual fitting procedures in the plane. Any further processing (smoothing, fitting) was performed using the class software.
The final [Ci] spectrum at a velocity resolution of 90 km s-1 is displayed in Fig. 1 together with the spectrum of the 43 transition of CO. The image of the [Ci] emission is shown in Fig. 2. The [Ci] fine-structure line is clearly detected at the same redshift as the CO emission with a peak flux density of (including the continuum flux of 0.31 mJy). Table 1 summarizes the line parameters derived from continuum + Gaussian fits.
3 Results and Discussion
The integrated flux of the [Ci] line is , a factor of 5 lower than the CO(43) line. A Gaussian fit yields a line width of and a line center displaced by relative to CO(43). Due to the weak signal to noise ratio of the [Ci] data, the difference in the line position with the higher quality CO(43) data should not be over-interpreted. The [Ci] line flux implies a line luminosity of or (see, e.g., Solomon et al. 1997 for the definition of the line luminosity). The [Ci] luminosity in PSS 2322+1944 is thus about a factor 2 lower than in the case of the Cloverleaf where , as derived from the [Ci] velocity-integrated flux of Barvainis et al. (1997).
The continuum emission is detected at 96 GHz with , which is consistent for dust emission with the available photometric data at higher frequency. The FIR spectral energy distribution of PSS 2322+1944 is well reproduced with a grey body of temperature K and a dust emissivity (Beelen et al. 2004).
The detection of the [Ci] emission line in PSS 2322+1944 allows us to estimate the mass of neutral carbon . Since the transition (at GHz) is not observed, we assume that the transition is optically thin as is the case for the Cloverleaf (Weiß et al. 2003). Under these assumptions, we can express the mass of neutral carbon as a function of
| (1) |
where is the excitation temperature and is the Ci partition function. Assuming that is equal to the temperature of the warm dust , the mass of neutral carbon in PSS 2322+1944 amounts to , or after correction for lens amplification (). Although the excitation temperature of the neutral carbon can be different than (as observed for the Cloverleaf - see Weiß et al. 2003), the derived mass depends only weakly on . For a range of [Ci] excitation temperatures from 30 to 100 K, the mass of neutral carbon in PSS 2322+1944 would vary from 1.2 to .
| Source | C† | CO†† | C+ | CO/C | (C+CO)/ | Ref. | ||||
|---|---|---|---|---|---|---|---|---|---|---|
| [L⊙] | [L⊙] | [L⊙] | [L⊙] | |||||||
| PSS 2322+1944(a) | 4.12 | 6.6 | [1] | |||||||
| Cloverleaf(a) | 2.56 | – | 21.7 | – | [2] | |||||
| Arp220 | 0.018 | 2.2 | [3] | |||||||
| NGC253 | 0.0008 | 10.0 | [4] | |||||||
| Galactic Center(b) | – | 3.8 | [5] |
NOTE. – † Total C i luminosity. †† CO luminosity up to . The luminosities are corrected for lensing: for PSS 2322+1944 (Carilli et al. 2003) and for the Cloverleaf (Venturini & Solomon (2003). The central of the Galaxy. References: [1] This paper – [2] Weiß et al. (2003); Barvainis et al. (1997); A. Weiß(private communication) – [3] Gérin & Phillips (1998) – [4] Bayet et al. (2004) – [5] Fixsen et al. (1999).
Compared to the mass of molecular gas of after correcting for amplification (Cox et al. 2002; Carilli et al. 2003), the derived mass of [Ci] implies a carbon abundance relative to H2 of [Ci]/[H2], indicating near to solar abundances in this high-redshift system. Similar values are derived by Weiß et al. (2004). This relative carbon abundance is close to the maximum value of found for Galactic dense molecular clouds with opacities of , a value which does not vary within a factor of a few for larger ’s (Frerking et al. 1989).
The [Ci] and lines are major gas coolants. In the Cloverleaf, the line is 2.2 times stronger than the line (Weiß et al. 2003). To estimate the carbon cooling, we may assume a similar ratio for PSS 2322+1944. To compare this to the CO cooling, we added the observed CO line luminosities of PSS 2322+1944 up to , where for the unobserved transitions we adopt the prediction of the LVG model of Carilli et al. (2002). In PSS 2322+1944, we find that the CO/[Ci] luminosity ratio is 6, as compared to a ratio of 20 for the Cloverleaf (see Table 2). However, the total mass of [Ci] remains somewhat smaller than that of CO (see Carilli et al. 2002).
Compared to the far-IR luminosity of PSS 2322+1944, (corrected for lensing), the CO and [Ci] cooling represents of the far-IR continuum, again not very different from the ratio of derived for the Cloverleaf (Table 2). The recent search of the red-shifted [Cii] fine-structure line in PSS 2322+1944 implies an upper limit to the [Cii] line luminosity of , a weakness which is typical for high- IR luminous galaxies (Benford et al. 2004). The CO and C cooling is therefore more than half of the cooling due to . The [Cii] line remains the main cooling line of the gas.
Finally, the [Ci] luminosity relative to the integrated far-IR luminosity is a good measure of the intensity of the non-ionizing UV radiation field in galaxies, because in photodissociation regions the column density of neutral carbon is mostly insensitive to the UV field, whereas the far-IR emission is directly proportional to the strength of the UV field (see, e.g., Kaufman et al. 1999; Gérin & Phillips 2000). For PSS 2322+1944, this ratio is indicating a UV radiation field of a few 1000 times larger than in the solar vicinity. Both this ratio and the implied strength of the UV illumination are comparable to the values derived for the other IR luminous galaxies and the galactic center listed in Table 2.
As in the case for local starburst galaxies such as NGC253, CO is a more important coolant than C in both PSS 2322+1944 and the Cloverleaf by about one order of magnitude (Table 2) - see also Schilke et al. (1993) and Bayet et al. (2004). Similarly, in starburst galaxies or in galactic nuclei (including the Milky Way), the molecular gas is warm therefore populating the higher CO levels which contribute to the cooling.
The detection of the red-shifted [Ci] transition line in the gravitationally lensed QSO PSS 2322+1944 enables to further constrain the physical conditions of the neutral gas and to compare the major line (C, CO and ) and far-IR luminosities in this high- galaxy. Together with the recent [Ci] detections in other sources at high redshift (Weiß et al. 2004), these results illustrate the potential of studying neutral carbon or species other than CO in high- sources, a field which will clearly fully develop as soon as more sensitive submillimeter arrays, such as the Atacama Large Millimeter Array (ALMA), will become operational.
Acknowledgements.
We thank the IRAM Plateau de Bure staff for their support in the observations. IRAM is supported by INSU/CNRS (France), MPG (Germany), and IGN (Spain). Estelle Bayet and the referee, Dr. Phil M. Solomon, are kindly acknowledged for helpful comments.References
- (1) Barvainis, R., Maloney, P., Antonucci, R., & Alloin, D. 1997, ApJ, 484, 695
- (2) Bayet, E., Gérin, M., Phillips, T.G., & Contursi, A. 2004, A&A, in press
- (3) Beelen, A., Benford, D., Cox, P., et al. 2004, submitted to ApJ
- (4) Benford, D., Cox, P., et al. 2004, submitted to ApJ
- (5) Bertoldi, F., Carilli, C., Cox, P., Fan, X., Strauss, M., Beelen, A., Omont, A., & Zylka, R. 2003, A&A, 406, L55
- (6) Bertoldi, F., Cox, P., Neri, R., et al. A&A, 409, L47
- (7) Carilli, C.L., Cox, P., Bertoldi, F. et al. 2002 ApJ 575, 145
- (8) Carilli, C.L., Lewis, G.F., Djorgovski, S.G., Mahabal, A., Cox, P., Bertoldi, F. & Omont, A., 2003, Science, 300, 773
- (9) Cox, P., Omont, A., Djorgovski, S., et al. 2002, A&A, 387, 406
- (10) Gérin, M. & Phillips T.G. 1998 ApJ 509, L17
- (11) Gérin, M. & Phillips T.G. 2000 ApJ, 537, 644
- (12) Greve, T., Bertoldi, F., Smail, I. et al. 2004, submitted to MNRAS
- (13) Fixsen, D.J., Bennett, C.L., & Mather, J.C. 1999, ApJ, 526, 207
- (14) Frerking, M.A., Keene, J., Blake, G.A., Phillips, T.G. 1989, ApJ, 344, 311
- (15) Kaufman, M.J., Wolfire, M.G., Hollenbach, D.J., & Luhman, M.L. 1999, ApJ, 527, 795
- (16) Omont, A., Cox, P., Bertoldi, F., McMahon, R.G., Carilli, C.L., & Isaak, K. 2001, A&A, 374, 371
- (17) Schilke, P., Carlstrom, J.E., Keene, J., & Phillips, T.G. 1993, ApJ, 417, L67
- (18) Spergel, D.N., Verde, L., Peiris, H., et al. 2003, ApJS, 148,175
- (19) Solomon, P.M., Downes, D., Radford, S.J., & Barrett, J.W. 1997, ApJ, 478, 14
- (20) Solomon, P.M., Vanden Bout, P.A., Carilli, C.L., & Guélin, M. 2003, Nature, 426, 636
- (21) Venturini, S. & Solomon, P.M. 2003, ApJ, 590, 740
- (22) Weiß, A., Henkel, C., Downes, D., & Walter, F. 2003, A&A, 409, L41
- (23) Weiß, A., Downes, D., Henkel, C., & Walter, F. 2004, A&A, in press