The Lyman- forest opacity and the metagalactic hydrogen ionization rate at
Abstract
Estimates of the metagalactic hydrogen ionization rate from the Ly forest opacity in QSO absorption spectra depend on the complex density distribution of neutral hydrogen along the line-of-sight. We use a large suite of high resolution hydrodynamical simulations to investigate in detail the dependence of such estimates on physical and numerical parameters in the context of CDM models. Adopting fiducial values for cosmological parameters together with published values of the temperature of the IGM and the effective optical depth, the metagalactic ionization rates which reproduce the Ly effective optical depth at are , respectively. The errors include estimates of uncertainties in the relevant physical parameters and the numerical accuracy of the simulations. We find the errors are dominated by the uncertainty in the temperature of the low-density IGM. The estimated metagalactic hydrogen ionization rate for the neutral hydrogen distribution in the current concordance CDM model is more than four times the value inferred for that in an Einstein-de Sitter model of the same r.m.s. density fluctuation amplitude . The estimated ionization rate is also more than double that expected from updated estimates of the emissivity of observed QSOs alone. A substantial contribution from galaxies appears to be required at all redshifts.
keywords:
methods: numerical - hydrodynamics - intergalactic medium - diffuse radiation - quasars: absorption lines.1 Introduction
In recent years, high resolution, high signal-to-noise quasi-stellar object (QSO) spectra (e.g. Lu et al. 1996; Kirkman & Tytler 1997; Kim et al. 2002), combined with hydrodynamical simulations (Cen, 1992; Zhang, Anninos & Norman, 1995; Hernquist et al., 1996; Miralda Escudé et al., 1996; Theuns et al., 1998), have provided fresh insight into the nature of the intergalactic medium (IGM). It is now widely accepted that the Ly forest arises from absorption by density fluctuations imposed on the warm photoionized IGM as suggested by analytical calculations (Bi, Börner & Chu 1992, Bi & Davidson 1997), and is a natural consequence of hierarchical structure formation within CDM-like models (see Rauch 1998 for a review).
One notable inconsistency with this paradigm has been the rather low values of inferred from early hydrodynamical simulations of the Ly forest if scaled to appropriate assumptions for the IGM temperature (e.g. Rauch et al. 1997). However, the matter density , baryon density , amplitude of mass fluctuations and the parameterised Hubble constant , as well as the gas temperature and the Ly effective optical depth, ln, all influence such an estimate. This has led to a wide range of estimates for inferred from the Ly forest opacity using numerical simulations with different assumptions (Rauch et al. 1997; Theuns et al. 1998; Haehnelt et al. 2001; McDonald & Miralda Escudé 2001; Hui et al. 2002; Schaye et al. 2003; Sokasian, Abel & Hernquist 2003; Meiksin & White 2003, 2004; Tytler et al. 2004). This complicates the comparison with determinations of the ionization rate from estimates of the integrated emission from observed QSOs and/or galaxies (e.g. Haardt & Madau 1996, hereafter HM96; Madau, Haardt & Rees 1999) and estimates using the proximity effect (e.g. Bajtlik, Duncan & Ostriker 1988, Bechtold 1994, Cooke, Espey & Carswell 1997, Scott et al. 2000) which both also have rather large uncertainties. Furthermore, Steidel et al. (2001), in a study of Lyman break galaxies at , suggested that the intensity of the ionizing background may be a factor of a few larger than in the model of HM96 due to a large contribution from star-forming galaxies.
In this paper we present new estimates of the metagalactic hydrogen ionization rate using Ly forest opacity measurements taken from the literature. Our approach expands on previous studies in that we examine the dependence of upon the various cosmological and astrophysical parameters using a large suite of hydrodynamical simulations. In section 2 we present an overview of our numerical code and our method for obtaining from artificial Ly spectra. We examine how depends on a wide variety of parameters in section 3, and compare our results to previous estimates using the same technique in section 4. In section 5 we present our best values for at and consider the implications for sources of ionizing radiation. Section 6 contains our summary and conclusions.
2 From mean flux to ionization rate
2.1 The fluctuating Gunn-Peterson approximation
At redshifts where the Ly forest is commonly observed, density fluctuations in the low density, unshocked baryons closely follow those of the underlying dark matter (Zhang et al., 1998). The balance between photoheating of unshocked gas and cooling due to the adiabatic expansion of the Universe results in a power law temperature-density relation for the normalised gas density , where (Hui & Gnedin, 1997). This is often referred to as the effective equation of state of the IGM, for which typically, and . Additionally, in photoionization equilibrium the Ly optical depth, , is proportional to the density of neutral hydrogen, . Neglecting collisional ionization, which is an acceptable approximation at the low densities associated with Ly forest absorbers, , where is the gas density, is the temperature and is the hydrogen ionization rate per atom. Combining these relations gives a simple power law expression relating the optical depth of Ly absorbers to the physical properties of the hydrogen gas (Weinberg et al., 1999). This relation has been termed the Fluctuating Gunn-Peterson Approximation (FGPA).
The optical depth due to Ly absorption for a homogeneous distribution of hydrogen gas in an isotropically expanding Universe was discussed by Gunn & Peterson (1965). The FGPA applies to an inhomogeneous IGM in photoionization equilibrium. Ignoring the effect of peculiar velocities and thermal broadening, the optical depth to Ly scattering is given by (e.g. Weinberg et al. 1999, McDonald & Miralda-Escudé 2001):
| (1) |
where is the baryonic matter density as a fraction of the critical density, for the present day Hubble constant , is the gas temperature at normalised density , at redshift and is a constant. The index is determined by the slope of the effective equation of state, and asymptotically approaches after reionization. For a flat Universe at redshifts the Hubble parameter can be approximated by . Thus, given the correct density distribution, velocity distribution and effective equation of state at redshift , the Ly optical depth should scale according to the parameter combination:
| (2) |
for redshifts (Rauch et al. 1997). This assumes that thermal broadening and peculiar velocities will not have a large effect on the optical depth distribution. At the densities and physical scales of the Ly forest absorbers Hubble broadening is expected to be dominant (Weinberg et al., 1997) which should make this a reasonable assumption.
We match the mean flux of artificial Ly spectra constructed from hydrodynamical simulations to observed values by linearly rescaling the simulated optical depths. If the FGPA approximation holds this corresponds to changing the parameter combination by the same factor. We have determined in this way. If independent estimates are available for , , , and , the magnitude of required to reproduce the observed mean flux can be derived. This assumes that the effect of absorption by fully neutral gas on the mean flux level is small, which should again be a reasonable assumption.
2.2 Numerical code
We proceed to investigate how depends on several cosmological and astrophysical parameters using a suite of hydrodynamical simulations. The simulations were run using a new version of the parallel TreeSPH code GADGET (Springel, Yoshida & White, 2001). GADGET-2 has the option of using a TreePM mode to perform the long range gravitational computations, which results in a significant reduction in computational run-time.
The conservative entropy formulation of Springel & Hernquist (2002) is used to model the SPH particles, and radiative cooling is included using the prescription of Katz, Weinberg & Hernquist (1996). We have used the UV background specified by HM96 based on observed counts of QSOs, but with artificially increased heating rates to explore the effect of gas temperature on . Our fiducial model uses a heating rate a factor of greater than the HM96 value in the optically thin limit which results in temperatures close to those observed in the IGM (Schaye et al., 2000; Bryan & Machacek, 2000; Ricotti et al., 2000). The fiducial temperatures at mean gas density we shall assume are at , based on the results of Schaye et al. (2000) which are consistent with He reionization at . At present there are only weak observational constraints on the index of the temperature density relation and its dependence on redshift (Ricotti et al., 2000; Schaye et al., 2000; McDonald et al., 2001). The plausible range is and in the following we will adopt as the fiducial value. Unless otherwise noted the temperatures of the gas have been rescaled such that the temperature at mean gas density has the above fiducial values and the index of the power-law temperature-density relation for low gas densities is . At higher gas densities the temperature-density relation asymptotes to as atomic cooling becomes important.
Star formation is included using a simplified prescription to maximise the speed of the simulations. All gas particles with and are converted into collisionless stars. Comparisons with identical simulations using the multi-phase model of Springel & Hernquist (2003) show little difference in the Ly absorption (Viel, Haehnelt & Springel, 2004). Additionally, all GADGET-2 feedback options have been disabled. The effect of feedback from galactic winds on the flux distribution is uncertain but is believed to be small (e.g. Theuns et al. 2002; Bruscoli et al. 2003; Desjacques et al. 2004). Simulations run by one of us (VS) indicate that the inclusion of winds only marginally alters the opacity of the Ly forest, such that the mean transmitted Ly flux predicted by different models varies to less than half a per cent. There also appears to be no monotonic trend of the mean transmitted flux with wind strength. It is, however, conceivable that more realistic implementations of galactic winds within our simulations may lead to a multi-phase medium with dense cool clouds, which may increase the Ly forest opacity and thus the estimated hydrogen ionization rate. We neglect this possibility in this work. Note that Theuns et al. (2002) find the inclusion of winds alters the mean transmission by per cent.
The simulation parameters are listed in Table LABEL:tab:param. For each model we have run a simulation with dark matter particles and gas particles within a comoving Mpc box with periodic boundary conditions. We find this to be the best compromise between accuracy and speed for our parameter study. For our fiducial model we have also run simulations with different box sizes and mass resolutions to test numerical convergence (see section 2.4). These are listed in Table LABEL:tab:param2. Note that the simulations with particles used for the parameter study do not give fully converged estimates of and we will later show results corrected for box size and resolution. In addition, we have run CDM and SCDM simulations with particles and box sizes of and comoving Mpc respectively, to mimic the simulations used in the seminal study of Rauch et al. (1997). The parameters are also listed in Table LABEL:tab:param.
| Name | UV | |||||
| Fiducial | 0.26 | 0.0240 | 0.72 | 0.85 | 0.95 | 3.3 |
| T1 | 0.26 | 0.0240 | 0.72 | 0.85 | 0.95 | 0.3 |
| T2 | 0.26 | 0.0240 | 0.72 | 0.85 | 0.95 | 1.0 |
| T3 | 0.26 | 0.0240 | 0.72 | 0.85 | 0.95 | 2.0 |
| T4 | 0.26 | 0.0240 | 0.72 | 0.85 | 0.95 | 4.0 |
| M1 | 0.17 | 0.0240 | 0.72 | 0.85 | 0.95 | 3.3 |
| M2 | 0.40 | 0.0240 | 0.72 | 0.85 | 0.95 | 3.3 |
| M3 | 0.70 | 0.0240 | 0.72 | 0.85 | 0.95 | 3.3 |
| M4 | 1.00 | 0.0240 | 0.72 | 0.85 | 0.95 | 3.3 |
| S1 | 0.26 | 0.0240 | 0.72 | 0.50 | 0.95 | 3.3 |
| S2 | 0.26 | 0.0240 | 0.72 | 0.70 | 0.95 | 3.3 |
| S3 | 0.26 | 0.0240 | 0.72 | 1.00 | 0.95 | 3.3 |
| S4 | 0.26 | 0.0240 | 0.72 | 1.20 | 0.95 | 3.3 |
| CDM | 0.40 | 0.0150 | 0.65 | 0.79 | 0.95 | 3.3 |
| SCDM | 1.00 | 0.0125 | 0.50 | 0.70 | 1.00 | 1.0 |
| Name | Box size | SPH | Mass resolution |
|---|---|---|---|
| comoving Mpc | particles | /gas particle | |
| 15-400 | 15 | ||
| 30-400 | 30 | ||
| 15-100 | 15 | ||
| 30-200 | 30 | ||
| 60-400 | 60 | ||
| 30-100 | 30 | ||
| 15-200 | 15 |
The simulations were started at , with initial conditions generated using the CDM transfer functions of Eisenstein & Hu (1999). The initial gas temperature was and the gravitational softening length was comoving kpc. The simulations were run on COSMOS, a 152 Gb shared memory Altix 3700 with 152 1.3 GHz Itanium2 processors hosted at the Department of Applied Mathematics and Theoretical Physics (Cambridge).

2.3 Method for determining from simulations
Artificial Ly spectra are constructed at from random lines-of-sight (LOS) parallel to the box boundaries (e.g. Theuns et al. 1998). Each LOS consists of pixels. We mimic the noise on high resolution QSO spectra by adding Gaussian distributed noise with a total . The simulated optical depths we use are divided by a constant factor of 1.225 to correct the hydrogen recombination coefficient used in our simulations, which is taken from Cen (1992). As noted by Rauch et al., this value of is around larger than the calculation of Abel et al. (1997) within the relevant temperature range for unsaturated absorption in the Ly forest. Abel et al. base their fit for on the data of Ferland et al. (1992).
To determine we rescale the optical depths of the artificial spectra to match the mean observed flux of the Ly forest at . We use the central values of from the fitting formula of Schaye et al. (2003), based on a sample of high resolution QSO spectra, such that: . The uncertainties on these values were estimated by binning the errors on presented in Table 5 of Schaye et al. (2003) into redshift bins of width . These values have been corrected for absorption from metal lines and Ly systems with damping wings. We rescale the optical depth in each pixel by a constant factor to reproduce at the appropriate redshift. Hence, for a set of spectra with a total of pixels:
| (3) |
where is optical depth in each pixel of the simulated spectra. The value of required to reproduce from the simulated spectra is then calculated.
2.4 The effect of box size and mass resolution on the ionization rate
We firstly vary the box size and resolution of simulations of our fiducial model to assess their effect on the value of . The simulation box must be large enough to include long wavelength density perturbations and represent a fair sample of the Universe while retaining adequate resolution. The left panel of fig. 1 shows for different box sizes at fixed mass resolution. As the box size increases, the simulated optical depths decrease; low density gas responsible for Ly absorption falls into the haloes formed in the simulation, producing larger and emptier voids. A smaller is thus required to reproduce the observed optical depth. The data have almost converged for a box size of comoving Mpc, with a difference of less than per cent between the inferred from the and models.
The right panel illustrates the effect of changing the mass resolution on for fixed box sizes of and comoving Mpc. Increasing the mass resolution decreases the optical depth as higher resolution simulations resolve smaller haloes. More gas is taken from the low density IGM and a smaller value of is required to match the observed mean flux. Simulations with less than gas particles within a comoving Mpc box do not achieve adequate numerical convergence. The difference between calculated from the and simulations is on average per cent. Comparison of the simulation with and particles within a comoving Mpc box shows that a further increase in resolution reduces by an extra per cent.
Unfortunately, simulations are too computationally expensive for the purpose of exploring a large parameter space. We compromise by taking our fiducial model to have gas particles within a comoving Mpc box; the value of we infer will be systematically high by around per cent due to the combined error from box size and resolution. Hereafter, all results based on simulations with particles within a comoving Mpc box will be reduced by this factor to correct for box size and resolution. Note that this correction is likely to be a lower limit to the true correction required; our highest resolution simulations may not yet have reached numerical convergence. We will account for this uncertainty in our error analysis in section 5.1.
3 Scaling relations for from simulated absorption spectra
It is implicit in the FGPA scaling relation that the density and velocity distribution, along with the effective equation of state of the Ly absorbers remain unchanged for different values of , , , and . Hence, when inferring from hydrodynamical simulations and subsequently rescaling with different parameters, it is generally assumed that:
| (4) |
(e.g. Rauch et al. 1997, McDonald & Miralda-Escudé 2001). However, it is not clear if this relation is an accurate approximation. Altering is likely to alter the gas density distribution, and thermal broadening may produce a deviation from the scaling based on the temperature dependence of the recombination coefficient. In addition, the dependence of on the polytropic index of the effective equation of state is unclear. Although hydrodynamical simulations predict at low density, if He reionization occurs at (Reimers et al., 1997; Schaye et al., 2000; Bernardi et al., 2003) the effective equation of state for the low density gas may become isothermal. Radiative transfer effects may also raise the temperature of the gas and blur the monotonic relation between temperature and density (Abel & Haehnelt, 1999; Bolton, Meiksin & White, 2004). Finally, changing will affect by changing the density distribution of the gas.
We test the validity of equation 4 using our suite of hydrodynamical simulations. The motivation for this is two-fold: first, it is important to understand the physical processes which alter the value of we infer from simulations; second, we wish to determine how scales with the input parameters, allowing us to place joint constraints upon them. We do not discuss the scaling with and , since our analysis revealed that the FGPA scaling relation holds extremely well for these parameters.
3.1 The dependence of on temperature


The left panel of fig. 2 shows our test of the FGPA scaling relation for the gas temperature at mean density using five simulations with photoheating rates [0.3,1.0,2.0,3.3,4.0] times the HM96 values. We expect the ionization rate to decrease as the HM96 photoheating rate is raised; the hydrogen recombination rate scales as , so for larger temperatures there is less neutral hydrogen. We find a modest deviation from the scaling (shown as the dotted curves) at low temperatures, probably due to thermal broadening of absorption features, an effect which is strongest at . The fiducial model with its higher gas temperatures will have relatively broader absorption features, producing more Ly absorption and thus requiring a larger value of than if thermal broadening were absent. The FGPA scaling relation for the fiducial model will slightly over-predict the value of at lower temperatures. The same process also occurs for gas temperatures higher than the fiducial model; the absorbers are thermally broadened to a greater extent so the scaling relation under-predicts the ionization rate. This effect is much more apparent at higher redshifts when the spatial density of Ly absorbers is greater. Note that the temperature dependence of the gas pressure may also contribute to the deviation from the scaling. We perform a least squares fit on the data to obtain the following scaling for with temperature:
| (5) |
where at . We shall adopt these scaling relations (shown as solid curves) from here onwards.
3.2 The dependence of on
The dependence of the hydrogen ionization rate on the polytropic index is shown in the right panel of fig. 2. The value of is varied by artificially rescaling the effective equation of state of our existing fiducial simulation data by pivoting the temperature-density relation around the mean gas density (Viel, Haehnelt & Springel, 2004). Note that the actual slope of the effective equation of state predicted by the numerical simulations is . This will not account for any dynamical effects the different temperatures have on the gas distribution, but it will model thermal broadening and the change in neutral hydrogen density correctly, thus providing a reasonable approximation. Note that the data point with the largest is for our simulation of the fiducial model with no scaling of . It is clear from fig. 2 that the inferred ionization rate has a non-negligible dependence on . At and increases with . A flatter effective equation of state produces hotter gas at densities less than the cosmic mean with a lower neutral hydrogen fraction. As most of the Ly absorption is produced by this gas, decreasing will decrease the amount of absorption and hence lower the inferred ionization rate. The dependence of on is much stronger at compared to . However, at , the trend is opposite; the ionization rate decreases with increasing , albeit with a weak dependence. This can be explained by considering the density evolution of the Ly absorbers. With decreasing redshift, the mean gas density decreases. By , the optical depth in regions of average density and below has become so low that these contribute very little to the overall effective optical depth. The absorption is almost entirely due to overdense regions. Decreasing the polytropic index will lower the temperature of this gas, increasing the neutral hydrogen fraction and slightly increasing the effective optical depth. The inferred ionization rate increases slightly with decreasing as a consequence. In a similar manner to before, we perform a least squares fit on the data to obtain a scaling relation for the ionization rate with the polytropic index :
| (6) |
where at . These scaling relations are shown in fig. 2 as the solid curves.
3.3 The dependence of on
The FGPA scaling relation assumes that the ionization rate per atom scales as . For this to be true, the density distribution of the neutral hydrogen gas must remain the same for different values of . We test this scaling relation using five simulations with and show the results in the left panel of fig. 3. As before, the plotted values are rescaled to match the fiducial temperatures, , corrected for box size and resolution and are shown with the best fitting curves to the data. The scaling around the fiducial model is indicated by the dotted lines. This becomes a poorer fit to the data as is increased, and overestimates the value of substantially. It is worth stressing that all the models shown in the left panel of fig. 3 have the same normalisation at a scale of Mpc for the dark matter linear power spectrum (). In order to understand why the discrepancy with the expected trend is so big we performed a new run for the Einstein-de Sitter (M4) model and normalised the power spectrum to have the same fluctuation amplitude as the fiducial model at the scale of , roughly corresponding to the Jeans length. The filled points in the left panel of fig. 3 indicate the new values of we infer; one can see that these values are in better agreement with the theoretical curve, showing that is more sensitive to the r.m.s. fluctuations on a fixed velocity scale. This suggests that the r.m.s. fluctuation amplitude at the Jeans scale is more relevant.
Fig. 4 shows the probability density function (PDF) of the volume weighted gas density as a fraction of the mean at for our fiducial model and the Einstein-de Sitter (M4) model. The density distribution of the Einstein-de Sitter model peaks at lower density, explaining the much lower required to match the observed mean flux. In the Einstein-de Sitter model a greater proportion of the gas has fallen into haloes. Different gas density distributions are not accounted for in the FGPA scaling relation. Comparisons of parameters such as and inferred from simulations with different matter distributions using the FGPA gives misleading results. A least squares fit to our data yields
| (7) |
where at .

3.4 The dependence of on
The magnitude of , the mass fluctuation amplitude within Mpc spheres, also alters the required . For small , there is less small scale power and the collapse of structures is less advanced. This produces a narrower volume weighted density PDF with a larger average density. This decreases the mean flux of the simulated spectra if the ionization rate is kept fixed. A larger is thus required to reproduce the observed effective optical depth.

The right panel of fig. 3 shows for at redshifts . Tytler et al. (2004) present a similar plot in their fig. 16, where they construct curves relating and , normalised to the predicted ionization rate at from Madau, Haardt & Rees (1999). The central curve in their plot gives the and they require to reproduce . We find a weaker dependence of on . We use similar values for , , , the UV heating rate, and the slightly lower value of , which Tytler et al. use, will change our results only by a small amount (see section 3.5). The small difference in redshift should also not alter the results significantly, and the resolution and box size of our simulations will also not account for the difference; increasing these systematically lowers . The most likely reason for this discrepancy are differences in the modelling techniques for our respective cosmological simulations (O’Shea et al., 2003). Tytler et al. use the Eulerian code ENZO (Norman & Bryan, 1999). This models the gas component using a piecewise parabolic method, whereas we use a Lagrangian SPH code. A least squares fit to our results gives:
| (8) |
where at .
3.5 The dependence of on
To determine the intensity and evolution of using the FGPA we must assume a value for the effective optical depth, . Measurements of the effective optical depths have been made by a number of authors (e.g Press, Rybicki & Schneider 1992, Kim et al. 2001, Songalia & Cowie 2002, Bernardi et al. 2003, Schaye et al. 2003). The values obtained from low-resolution, low-S/N data by Press, Rybicki & Schneider and Bernardi et al. appear to be systematically higher than those obtained by the other groups, mainly from high-resolution data (see Viel, Haehnelt & Springel 2004 for a discussion). The differences are primarily due to the systematic uncertainties in the continuum fits. Tytler et al. make an analysis of continuum fitting errors by comparing the true and fitted continua for sets of artificial spectra. They find that they can obtain a fit which is on average good to within 1-2 per cent, except for very low S/N spectra. Some agreement is emerging that the lower values from the higher quality data are more appropriate. Statistical errors from the presence of metal absorption features and high column density absorbers also contribute to the uncertainty in (Viel et al., 2004).
Fig. 5 shows the value of we infer from our fiducial model at by varying the effective optical depth, and hence mean observed flux, to which the simulated optical depths are scaled to match. At , a change in of , which is consistent with the variation in estimates, results in almost a factor of two difference in the required hydrogen ionization rate. An accurate estimate of and the errors associated with the measurement are required to determine ; at even a small change in the assumed will change the inferred ionization rate appreciably. The best fitting curve to the data is:
| (9) |
where at .
4 Comparison with previous estimates from simulations
4.1 Hydrodynamical codes
In this section we shall make a direct comparison between our data and the results of other authors. Firstly, we consider two simulations which are similar to the CDM and SCDM models analysed by Rauch et al. (1997). The simulations have identical cosmological parameters, box size and resolution. Our CDM model differs from that analysed by Rauch et al., since we use an SPH code rather than an Eulerian grid code. We try to approximate the different temperatures of the models by increasing the photoheating rate to times the HM96 value for our CDM simulation. This results in similar temperatures as those given by Rauch et al. at (this is only redshift for which the temperature was published). The optical depths of our artificial spectra are scaled to match the mean flux used by Rauch et al., corrected for continuum fitting: and at for the CDM and SCDM models respectively. Mimicking Rauch et al., we rescale by a factor , setting . Unlike in the rest of the paper, we have not corrected our data for numerical effects or rescaled the temperatures to match our fiducial values of and .

Fig. 6 shows the redshift dependence of inferred from the CDM and SCDM models as diamonds and triangles respectively. The solid lines give our data and the Rauch et al. data are plotted as dotted lines. Rauch et al. conclude the large difference between obtained using the CDM and SCDM models is primarily due to different gas temperatures in the respective simulations. The gas temperature at mean density in their SCDM model is about a half of that in the CDM model at . We suggest the values of , and used in each of the simulations will also alter . The different amounts by which the optical depths of the artificial spectra are scaled will also produce a small difference in , but this change will be negligible compared to the effect of the other parameters. In our simulations the smaller temperature of the SCDM simulation counteracts the effect of different and and we find rather similar values for both simulations. The values for our CDM simulation are larger than those in Rauch et al. while those for the SCDM simulation are smaller. Unfortunately the only information about the thermal state of the gas provided by Rauch et al. is at which makes a accurate comparison difficult. Although we attempt to match the gas temperature in our models at to those given by Rauch et al., this agreement is probably not good at higher redshifts, particularly for the CDM model. The gas temperatures of the Rauch et al. models result from different reionization histories instead of artificially increased photoheating rates. The UV background of their CDM model ionizes He at , which may lower the polytropic index . The in the Rauch et al. CDM simulation may thus have been lower than that in our simulations. This would make the discrepancy smaller.
Schaye et al. (2003) utilise a hydrodynamical simulation based on a modified version of the SPH code HYDRA (Couchman, Thomas & Pearce, 1995) to examine the metallicity of the IGM. Their model consists of a periodic box of comoving Mpc with dark matter particles and gas particles. The parameters they adopt are , , , and with a UV background designed to reproduce the effective equation of state constrained by Schaye et al. (2000). The optical depths of the artificial Ly spectra are scaled to match the same mean flux as ours. They find the required to match the mean flux of the Ly forest at are . Rescaling our fiducial model values of to match the cosmological parameters used by Schaye et al. reduces our values by around per cent to . We remove the correction for box size and resolution from these values to allow a fair comparison. These are consistent with Schaye et al. (2003), allowing for the unknown differences between the exact thermal state of the low density gas in the two simulations. Theuns, Schaye & Haehnelt (2000) also run simulations using HYDRA to study the broadening of Ly absorption lines in QSO spectra. Their reference model consists of dark matter particles and gas particles within a periodic box of comoving Mpc, with the same cosmological parameters used by Schaye et al. and the UV background specified by Haardt & Madau (1996). This produces a temperature of at mean cosmic density. To reproduce an effective optical depth of at they require , based on the value of quoted in their paper. Scaling our fiducial data to match their parameters reduces our value by per cent to . Although the mass resolution of our simulations is comparable, we obtain a smaller value because of our larger simulation box size.
Most recently, Tytler et al. (2004) made a detailed analysis of the Ly forest at , using a set of moderate resolution QSO spectra and compared it to a large hydrodynamical simulation run with the Eulerian code ENZO. Including uncertainties on the value of , and , they find a joint constraint of . They use a hydrodynamical simulation on a grid in a comoving Mpc box, with =, , , and and a UV background specified by Madau, Haardt & Rees (1999) with an artificially increased He photo-heating rate. Our fiducial result at rescaled to match the cosmological parameters and at assumed by Tytler et al. gives . This value is in reasonable agreement with the Tytler et al. result, again allowing for differences between the exact gas temperatures and numerical method. Note, however that Tytler et al. found a different scaling of with (see section 3.4 for details).
4.2 Pseudo-hydrodynamical codes
Several authors have also considered this problem using pseudo-hydrodynamical codes (e.g Gnedin & Hui, Gnedin 1998, Meiksin & White 2003, 2004). These approximate methods sacrifice accuracy for speed, allowing a much larger parameter space to be explored. Providing the accuracy of these approximations and the parameter ranges they model effectively are well controlled, they can provide an alternative method for modelling the IGM. Gnedin (1998) concludes that observational constraints on the column density distribution of the Ly forest are consistent with the intensity of the UV background remaining constant in the redshift range . Meiksin & White (2004), in a study of UV background fluctuations, find the mean flux of the IGM is reproduced with at . They adopt =, , , and , and impose and effective equation of state with and . Meiksin & White (2001) find that the spectral properties of the Ly forest obtained from their code are reproduced to within per cent of those found using fully hydrodynamical simulations. These results can thus be considered to be consistent with ours.
5 The Metagalactic Hydrogen Ionization Rate
5.1 The error budget
| Parameter | Fiducial values and uncertainties |
|---|---|
| [11200, 17800, 12500]5000 K | |
| 0.260.04 | |
| [0.1300.021, 0.3620.036, 0.8050.070] | |
| 1.30.3 | |
| 0.0240.001 | |
| 0.850.05 | |
| 0.720.04 |
| Parameter | |||
|---|---|---|---|
| Numerical | 10 | 10 | 10 |
| 1 | |||
| 6 | |||
| 6 | 6 | 6 | |
| Total |
We now proceed to place joint constraints on the metagalactic hydrogen ionization rate using independent estimates for several cosmological and astrophysical parameters. We adopt the values listed in Table LABEL:tab:fiducial. The values of and are based on the results of Schaye et al. (2000) and we assume the Ly effective optical depth advocated by Schaye et al. (2003). The cosmological parameters are consistent with the results of Spergel et al. (2003), based on their analysis of the cosmic microwave background anisotropy. Using our scaling relations, we estimate the error on the values of from our fiducial simulation, corrected for box size and resolution. The total error is calculated by adding the individual contributions in quadrature, with the percentage error on contributed by each parameter listed in Table LABEL:tab:errors. We make the conservative assumption of an additional numerical uncertainty of per cent to take into account numerical convergence and the modest differences with numerical simulations of other authors. The total percentage errors on are per cent at , with the largest contribution coming from the uncertainty in the gas temperature. There is also a large contribution from the uncertainty in the effective optical depth, especially at . Interestingly, the uncertainty in also gives a substantial contribution to the total error budget. This is primarily due to the sensitivity of on due to changes in the r.m.s. fluctuations of the gas density at the Jeans scale. Other uncertainties are less important, in particular , and . This contrasts with the conclusion of Tytler et al., who find is the biggest contribution to the uncertainty on . However they find a stronger dependence of on than we do, and they do not investigate the contribution of uncertainties in or to this error. Note also that inhomogeneities in the UV background may increase estimates of by up to twenty per cent if the UV background is dominated by emission of QSOs (Gnedin & Hamilton 2002; Croft 2004; Meiksin & White 2004). We will conclude in section 5.2. that QSOs contribute less than half of the ionizing UV background. We will therefore neglect a possible error due to inhomogeneities in the UV background. Using our fiducial model, we find the Ly effective optical depth of the IGM at is reproduced by .
5.2 Comparison with other observational estimates
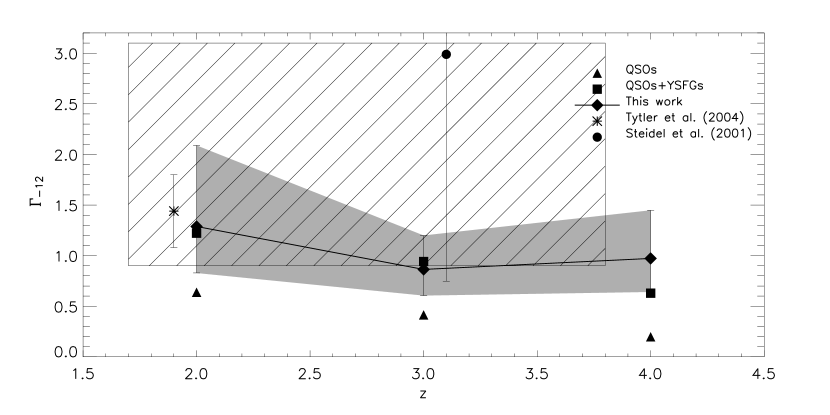
We compare our results with other observational estimates of in fig. 7. Our estimates are plotted as filled diamonds, with the error bound shown by the dark grey shaded region. The filled triangles show the metagalactic hydrogen ionization rate computed from the updated UV background model of Madau, Haardt & Rees (1999), hereafter MHR99 (Francesco Haardt, private communication). The values quoted here are smaller by more than a factor of two than those presented in the work of HM96, primarily due to different assumptions about the emissivity of the ionizing sources, and to a lesser extent upon the assumed cosmology. The rates are based on the QSO optical luminosity function of Boyle et al. (2000), with a redshift evolution similar to that of MHR99, aside from a steeper evolution for to fit data from the SDSS survey (Fan et al. 2001). These values are computed assuming the current cosmological concordance model, and also include the contribution of diffuse radiation from re-processing by the IGM (e.g. HM96). Our data appear to be inconsistent with the IGM being kept ionized by QSOs at . For comparison, the filled squares give calculated using the QSO rate above, plus an additional source in the form of Young Star Forming Galaxies (YSFGs). The YSFG rates are based on the models of Bruzual & Charlot (1993), assuming a Salpeter IMF, a constant star formation rate, an age of Myr, and a star formation history as in MHR99. The very uncertain escape fraction is assumed to be . Note that at low redshift the observed value is less than half this (Leitherer et al., 1995; Fernández-Soto, Lanzetta & Chen, 2003).
These ionization rates are in good agreement with our results, suggesting that a substantial contribution from galaxies appears to be required at all redshifts. Note, however that there are still substantial uncertainties in the estimates of the ionization rate due to QSOs and galaxies. Hunt et al. (2004), Croom et al. (2004) and Barger et al. (2004) all suggest that the faint end slope of the luminosity function of optically and UV bright QSOs is shallower than the extrapolation from the Boyle et al. data, which may further lower the expected contribution by QSOs. On the other hand Scott et al. (2004) find that the UV spectrum of low luminosity QSOs is substantially harder than that of bright QSOs which may somewhat increase their contribution to the UV background. The main uncertainty in the estimate for the ionization rate due to the UV emission of galaxies is the escape fraction of ionizing photons. However, the improved estimates for the QSO emissivity are so low that there should now be little doubt that the UV background cannot be dominated by QSOs over the full redshift range . Aguirre et al. (2004) come to similar conclusions in their study of the Si /C ratio of the associated metal absorption in Ly forest spectra.
Constraints on from the proximity effect measurements of Scott et al. (2000) are shown by the hatched box, based on a set of 99 moderate resolution QSO spectra. Similar results have been obtained by Cooke et al. (1997). Allowance has been made for variation in the spectral indices of QSOs and differences in systemic redshifts measured from the [O ] or Mg line and Ly emission. Our results are consistent with the lower end of these estimates. The filled circle gives the we calculate assuming a spectral index of using the metagalactic ionizing radiation intensity, , inferred from Lyman-break galaxies (LBGs) (Steidel et al., 2001). Steidel et al. quote at based on observations of the bluest 25 per cent of LBGs. We offset the data point from for clarity, and the upper error limit extends beyond the range of the plot. We estimate the maximum error on this result to be a factor of to allow for the possibility that the per cent of LBGs which are redder may contribute negligibly to the UV background. Note that Giallongo et al. (2002) found an upper limit to the escape fraction from two bright LBGs which is about a factor four lower than that measured by Steidel et al.. There are further uncertainties due to the mean free path of ionizing photons assumed by Steidel et al. and the spectral index that we assumed.
Finally we also plot the value of inferred by Tytler et al. (2004) in their study of the Ly forest at . The error bars include the uncertainties in , and , based on scaling from their hydrodynamical simulations.
6 Conclusions
We have examined the dependence of the ionization rate per hydrogen atom on cosmological and astrophysical parameters using hydrodynamical simulations. This is the first time all these parameters have been studied using fully hydrodynamical SPH simulations with high resolution in large boxes. We find that the gas temperature, the effective optical depth and the mass fraction have a marked effect upon the hydrogen ionization rate, in addition to the baryon fraction , , and the Hubble constant. We find that scales around our fiducial model as
| (10) |
where we tabulate the indices of equation in Table LABEL:tab:param3. We stress that this scaling relation is likely to be somewhat model dependent and should not be applied to models with parameters very different from our fiducial model without further checks. However, it does provide a clear picture of the degeneracies which exist between and other parameters within our simulations, and is independent of assumptions about the gas distribution, effective equation of state and ionized gas fraction of the low density IGM. In particular, the Ly optical depth at fixed r.m.s. fluctuation amplitude is more strongly dependent on than the FGPA suggests due to changes in the gas density distribution. Thermal broadening also produces a deviation from the FGPA scaling for temperature, although this change is much less dramatic. Consequently, we urge caution when using the FGPA scaling relation, especially if comparing models with differing . We find good agreement with estimates of from the Ly forest opacity by other authors if differences in the assumed cosmological, astrophysical and numerical parameters are taken into account.
| 2 | -0.68 | -0.04 | -1.00 | -0.90 | -1.44 |
|---|---|---|---|---|---|
| 3 | -0.62 | 0.34 | -1.04 | -0.99 | -1.61 |
| 4 | -0.59 | 0.55 | -1.16 | -1.26 | -1.68 |
In recent years, compelling observational evidence has led to the acceptance of a standard cosmological model which is flat, has low matter density and a substantial contribution of dark energy to the total energy density. Within this ’concordance’ cosmological model the current generation of hydrodynamical simulations predict values for the metagalactic hydrogen ionization rate, required to reproduce the effective Ly optical depth of the IGM in the range , which are about a factor of four larger than those in an Einstein-de Sitter model with the same r.m.s. density fluctuation amplitude . The ionization rates estimated from the Ly forest opacity are more than a factor two larger than estimates from the integrated flux of optically/UV bright observed QSOs alone. This discrepancy increases with increasing redshift. We confirm the findings of Tytler et al. (2004) at that the estimated ionization rates from simulations of a CDM concordance model are in reasonable agreement with the estimates of the integrated ionizing flux from observed QSOs plus a significant contribution from galaxies as in the model of MHR99. A model where the UV background is dominated by emission from QSOs appears to be inconsistent with the Ly forest data in the complete redshift range . The estimates of the ionization rate are also in agreement with the lower end of the range of estimates from the proximity effect.
There are still many issues which need to be resolved. In particular, better constraints on the thermal history of the IGM are required. Additional physics such as radiative transfer, galactic feedback and metal enrichment may need to be incorporated into simulations in a more realistic fashion. However, our estimate of the errors on most likely accounts for the modest changes expected from these processes, suggesting we have obtained a consistent constraint on the metagalactic hydrogen ionization rate.
Acknowledgements
We are grateful to Francesco Haardt for making his updated UV background model available to us. This research was conducted in cooperation with SGI/Intel utilising the Altix 3700 supercomputer COSMOS at the Department of Applied Mathematics and Theoretical Physics in Cambridge and on the Sun Linux cluster at the Institute of Astronomy in Cambridge. COSMOS is a UK-CCC facility which is supported by HEFCE and PPARC. We also acknowledge support from the European Community Research and Training Network “The Physics of the Intergalactic Medium”. This research was supported in part by the National Science Foundation under Grant No. PHY99-07949. JSB, MGH and MV thank PPARC for financial support. We also thank the referee, Joop Schaye, for a helpful report.
References
- Abel et al. (1997) Abel T., Anninos P., Zhang Y., Norman M.L., 1997, NewA, 2, 181
- Abel & Haehnelt (1999) Abel T., Haehnelt M.G., 1999, ApJ, 520, L13
- Aguirre et al. (2004) Aguirre A., Schaye J., Kim T.-S., Theuns T., Rauch M., Sargent W.L.W., 2004, ApJ, 602, 38
- Barger et al. (2004) Barger A.J., Cowie L.L., Mushotzky R.F., Yang Y., Wang W.-H., Steffen A.T., Capak P., 2004, preprint (astro-ph/0410527)
- Bajtlik, Duncan & Ostriker (1988) Bajtlik S., Duncan R.C., Ostriker J.P., 1988, ApJ, 327, 570
- Bechtold (1994) Bechtold J., 1994, ApJS, 91, 1
- Bernardi et al. (2003) Bernardi M. et al., 2003, AJ, 125, 32
- Bi, Börner & Chu (1992) Bi H.G., Börner G., Chu Y., 1992, A&A, 266, 1
- Bi & Davidson (1997) Bi H.G., Davidson A.F., 1997, ApJ, 479, 523
- Bolton, Meiksin & White (2004) Bolton J., Meiksin A., White M., 2004, MNRAS, 348, L43
- Boyle et al. (2000) Boyle B.J., Shanks T., Croom S.M., Smith R.J., Miller L., Loaring N., Heymans C., 2000, MNRAS, 317, 1014
- Bruscoli et al. (2003) Bruscoli M., et al., 2003, MNRAS, 343, 51
- Bruzual & Charlot (1993) Bruzual A.G., Charlot S., 1993, ApJ, 405, 538
- Bryan & Machacek (2000) Bryan G.L., Machacek M.E., 2000, ApJ, 534, 57
- Cen (1992) Cen R., 1992, ApJS, 78, 341
- Cooke, Espey & Carswell (1997) Cooke A.J., Espey B., Carswell B., 1997, MNRAS, 284, 552
- Couchman, Thomas & Pearce (1995) Couchman H.M.P., Thomas P.A., Pearce F.R., 1995, ApJ, 452, 797
- Croft (2004) Croft R.A.C., 2004, ApJ, 610, 642
- Croom et al. (2004) Croom S.M., Smith R.J., Boyle B.J., Shanks T., Miller L., Outram P.J., Loaring N.S., 2004, MNRAS, 349, 1397
- Desjacques et al. (2004) Desjacques V., Nusser A., Haehnelt M.G., Stoehr F., 2004, MNRAS, 350, 879
- Eisenstein & Hu (1999) Eisenstein D.J., Hu W., 1999, ApJ, 511, 5
- Fan et al. (2001) Fan X., et al., 2001, ApJ, 122, 2833
- Ferland et al. (1992) Ferland G.J., Peterson B.M., Horne K., Welsh W.F., Nahar S.N., 1992, ApJ, 387, 95
- Fernández-Soto, Lanzetta & Chen (2003) Fernández-Soto A., Lanzetta K.M., Chen H.-W., 2003, MNRAS, 342, 1215
- Giallongo et al. (2002) Giallongo E., Cristiani S., D’Odorico S., Fontana A., 2002, ApJ, 568, L9
- Gnedin (1998) Gnedin N.Y., 1998, MNRAS, 299, 392
- Gnedin & Hamilton (2002) Gnedin N.Y., Hamilton A.J.S., 2002, MNRAS, 334, 107
- Gnedin & Hui (1998) Gnedin N.Y., Hui L., 1998, MNRAS, 296, 44
- Gunn & Peterson (1965) Gunn J.E., Peterson B.A., 1965, ApJ, 142, 1633
- Haardt & Madau (1996) Haardt F., Madau P., 1996, ApJ, 461, 20 (HM96)
- Haehnelt et al. (2001) Haehnelt M.G., Madau P., Kudritzki R., Haardt F., 2001, ApJ, 549, L151
- Hui et al. (2002) Hui L., Haiman Z., Zaldarriaga M., Alexander T., 2002, ApJ, 564, 525
- Hui & Gnedin (1997) Hui L., Gnedin N., 1997, MNRAS, 292, 27
- Hunt et al. (2004) Hunt M.P., Steidel C.C., Adelberger K.L., Shapley A.E., 2004, ApJ, 605, 625
- Hernquist et al. (1996) Hernquist L., Katz N., Weinberg D.H., Miralda-Escudé J., 1996, ApJ, 457, L51
- Katz, Weinberg & Hernquist (1996) Katz N., Weinberg D.H., Hernquist L., 1996, ApJS, 105, 19
- Kim, Cristiani & D’Odorico (2001) Kim T.-S., Cristiani S., D’Odorico S., 2001, A&A, 373, 757
- Kim et al. (2002) Kim T.-S., Carswell R.F., Cristiani S., D’Odorico S., Giallongo E., 2002, MNRAS, 335, 555
- Kirkman & Tytler (1997) Kirkman D., Tytler D., 1997, ApJ, 484, 672
- Leitherer et al. (1995) Leitherer C., Ferguson H.C., Heckman T.M., Lowenthal J.D., 1995, ApJ, 454, L19
- Lu et al. (1996) Lu L., Sargent W.L.W., Womble D.S., Takada-Hidai M., 1996, ApJ, 472, 509
- Madau, Haardt & Rees (1999) Madau P., Haardt F., Rees M.J., 1999, ApJ, 585, 34 (MHR99)
- McDonald et al. (2001) McDonald P., Miralda-Escudé J., Rauch M., Sargent W.L.W., Barlow T.A., Cen R., 2001, ApJ, 562, 52
- McDonald & Miralda-Escudé (2001) McDonald P., Miralda-Escudé J., 2001, ApJ, 549, L11
- Meiksin & White (2001) Meiksin A., White M., 2001, MNRAS, 324, 141
- Meiksin & White (2003) Meiksin A., White M., 2003, MNRAS, 342, 1205
- Meiksin & White (2004) Meiksin A., White M., 2004, MNRAS, 350, 1107
- Miralda Escudé et al. (1996) Miralda Escudé J., Cen R., Ostriker J.P., Rauch M., 1996, ApJ, 471, 582
- Norman & Bryan (1999) Norman M.L., Bryan G.L., 1999, in: ASSL Vol. 240: Numerical Astrophysics, 19
- O’Shea et al. (2003) O’Shea B.W., Nagamine K., Springel V., Hernquist L., Norman M.L., 2003, preprint (astro-ph/0301265)
- Press, Rybicki & Schneider (1993) Press W.H., Ribicki G.B., Schneider D.P., 1993, ApJ, 414, 64
- Rauch et al. (1997) Rauch M. et al., 1997, ApJ, 489, 7
- Rauch (1998) Rauch M., 1998, ARA&A, 36, 267
- Reimers et al. (1997) Reimers D., Kohler S., Wisotzki L., Groote D., Rodriguez-Pascual P., Wamsteker W., 1997, A&A, 327, 890
- Ricotti et al. (2000) Ricotti M., Gnedin N., Shull M., 2000, ApJ, 534, 41
- Scott et al. (2000) Scott J., Bechtold J., Dobrzycki A., Kulkarni V.P., 2000, ApJS, 130, 67
- Scott et al. (2004) Scott J.E., Kriss, G.A., Brotherton M., Green R.F., Hutchings J., Shull J.M., Zheng W., 2004, ApJ, 615, 135
- Schaye et al. (2000) Schaye J., Theuns T., Rauch M., Efstathiou G., Sargent W.L.W., 2000, MNRAS, 318, 817
- Schaye et al. (2003) Schaye J., Aguirre A., Kim T.-S., Theuns T., Rauch M., Sargent W.L.W., 2003, ApJ, 596, 768
- Sokasian, Abel & Hernquist (2003) Sokasian A., Abel T., Hernquist L., 2003, MNRAS, 340, 473
- Songalia & Cowie (2002) Songalia A., Cowie L.L., 2002, AJ, 123, 2183
- Spergel et al. (2003) Spergel et al., 2003, ApJS, 148, 175
- Springel & Hernquist (2002) Springel V., Hernquist L., 2002, MNRAS, 333, 649
- Springel & Hernquist (2003) Springel V., Hernquist L., 2003, MNRAS, 339, 289
- Springel, Yoshida & White (2001) Springel V., Yoshida N., White S.D.M., 2001, NewA, 6, 79
- Steidel et al. (2001) Steidel C.C., Pettini M., Adelberger K.L., 2001, ApJ, 546, 665
- Theuns et al. (1998) Theuns T., Leonard A., Efstathiou G., Pearce F., Thomas P.A., 1998, MNRAS, 301, 478
- Theuns et al. (2000) Theuns T., Schaye J., Haehnelt M.G., 2000, MNRAS, 315, 600
- Theuns et al. (2002) Theuns T., Viel M., Kay S., Schaye J., Carswell B., Tzanavaris P., 2002, ApJ, 578, L5
- Tytler et al. (2004) Tytler D. et al., 2004, preprint (astro-ph/0403688)
- Weinberg et al. (1997) Weinberg D.H., Hernquist L., Katz N., Croft R., Miralda-Escudé J., 1997, in P Petitjean & S. Charlot, eds, Proceedings of the 13th IAP Colloquium, Structure and Evolution of the Intergalactic Medium, p.133
- Weinberg et al. (1999) Weinberg D. et al., 1999, in A.J. Banday, R.K. Sheth, L.N. da Costa, eds, Evolution of large scale structure: from recombination to Garching, p.346
- Viel et al. (2004) Viel M., Haehnelt M.G., Carswell R.F., Kim T.-S., 2004, MNRAS, 349, L33
- Viel, Haehnelt & Springel (2004) Viel M., Haehnelt M.G., Springel V., 2004, MNRAS, 354, 184
- Zhang, Anninos & Norman (1995) Zhang Y., Anninos P., Norman M.L., 1995, ApJ, 453, L57
- Zhang et al. (1998) Zhang Y., Meiksin A., Anninos P., Norman M.L., 1998, ApJ, 495, 63