1]Centre d’Etude Spatiale des Rayonnements, 31028 Toulouse, France 2]Institute of Astronomy, Madingley road, CB3 0HA, Cambridge, UK 3]Laboratoire d’Astrophysique Observatoire de Grenoble, BP 53 F-38041 GRENOBLE Cédex 9, France 4]Service d’Astrophysique, DSM/DAPNIA/SAp, CEA-Saclay, Bat. 709, L’Orme des Merisiers, F-91 191 Gif-sur-Yvette, Cedex, France 5]Cavendish Laboratory, University of Cambridge, Madingley Road, Cambridge CB3 0HE, UK 6] Université Paris 7 Denis-Diderot 2 place Jussieu 75251 Paris Cedex 05, France 7] INAF - Osservatorio Astronomico di Brera, via E. Bianchi 46, 23807 Merate, Italy 8]INTEGRAL Science Data Center, Chemin d’Écogia 16, 1290 Versoix, Switzerland
INTEGRAL observation of Cyg X-1 in an intermediate state
Abstract
We present preliminary results of an observation of Cygnus X-1 with INTEGRAL performed on June 7-11 2003. Both spectral and variability properties of the source indicate that Cygnus X-1 was in an intermediate state. As expected during state transitions, we find an anticorrelation between the 3-10 keV and the 15 GHz radio fluxes and a strong correlation between the 3-200 keV hardness and radio flux.
keywords:
Gamma-rays; X-ray binaries; black holes; Individual: Cyg X-11 Introduction
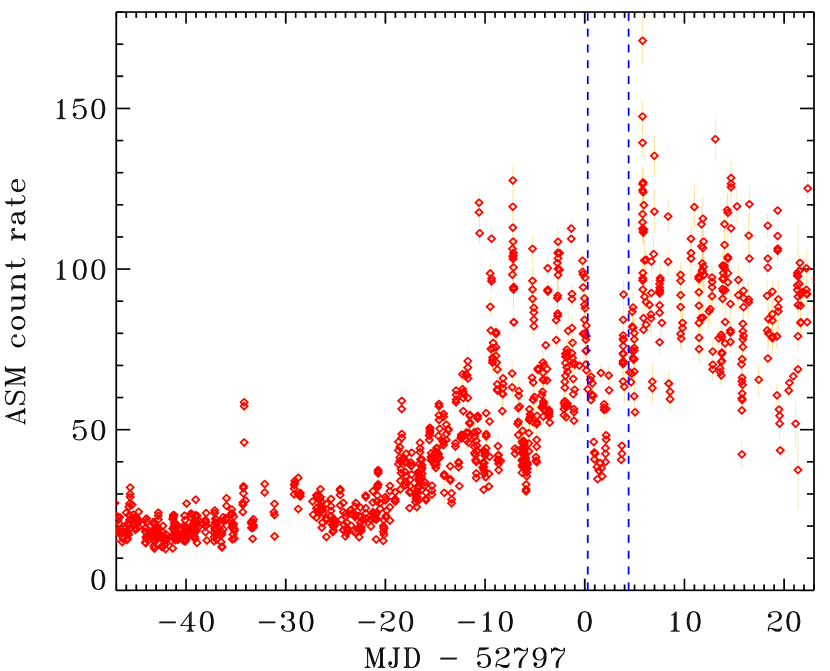
Cygnus X-1 is the prototype of black hole candidates. Since its discovery in 1964 (Bowyer et al. 1965), it has been intensively observed by all the high energy instruments, from soft X-rays to -rays. It is a persistent source most often observed in the so-called low/hard state, characterised by a relatively low flux in the soft X-rays ( 1 keV) and a high flux in the hard X-rays ( keV). In the hard state, the high energy spectrum can be roughly described by a power-law with spectral index varying in the range 1.4-2.2, and a nearly exponential cut-off at a characteristic energy of a few hundred keV (see e.g. Gierlinski et al. 1997). Occasionally, the source switches to the high soft state. The high energy power-law is then much softer () and the bolometric luminosity is dominated by a thermal component peaking at a few keV. Finally, there are also intermediate states in which the source exhibit a relatively soft hard X-ray spectrum () and a moderately strong soft thermal component (Belloni et al. 1996; Mendez & van der Klis 1997). The intermediate state often, but not always, appears when the source is about to switch from one state to the other. When it is not associated with a state transition, it is interpreted as a ‘failed state transition’. Until 1998 the source used to spend nearly 90 % of its time in the hard state. In the recent years however there have been more intermediate states and soft states (see Zdziarski et al. 2002, Pottschmidt et al. 2003, Gleissner et al. 2004). Cygnus X-1 represents a prime target for the INTEGRAL mission (Winkler et al. 2003) launched in 2002 October, which instruments cover an unprecedented spectral coverage at high energy, ranging from 3 keV to several MeV. Cygnus X-1 was extensively observed (600 ks) during the calibration phase of the mission (Bouchet et al. 2003, Pottschmidt et al. 2003, Bazzano et al. 2003). At that time, the source presented all the characteristics of the hard state. In this paper we report preliminary results of the first observation of Cygnus X-1 in the open time programme. This 300 ks observation was performed on 2003 June 7-11 (rev 79/80) with a 5x5 dithering pattern (the effective exposure time was 275 ks for JEM-X2, 292 ks for IBIS, and 296 ks for SPI). At this epoch, the RXTE All Sky Monitor count rate of Cyg X-1 was larger than in typical hard states by up to a factor of 4, and the light curve of Cyg X-1 shows strong X-ray activity characteristic of state (or failed state) transitions (see Fig. 1). We also combine the INTEGRAL data with the results of coordinated radio observations (15 GHz) performed with the Ryle telescope.

2 Spectrum and variability
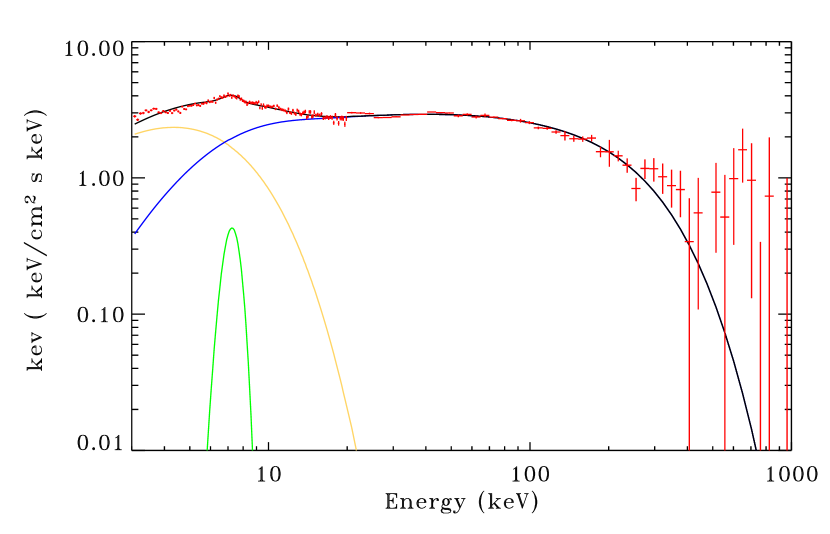
The data were processed using the OSA-3 software. Above 20 keV, given the current calibration of ISGRI, we restrict our spectral modelling to the SPI data. In addition, we use JEM-X in the 3-20 keV but warn that significant calibration problems are reported below 10 keV. The broad band JEM-X/SPI spectrum cannot be represented by a single power-law. In addition, a strong soft component affecting the whole 3-15 keV band is required. On the other hand, at high energies, the SPI data provide a highly significant evidence for a cut-off (or at least, a break) at about 100 keV. In order to estimate the intrinsic spectral slope, we fitted the joint JEM-X/SPI spectrum in the 8-50 keV range, where the effects of the soft component and high energy break, are not too strong. The best fit spectral index was =2.140.1. The spectrum is thus rather soft with respect to typical hard state spectra (1.7), but harder than the soft state spectra (2.5). The modelling of the broad band (3 keV-1 MeV) combined JEM-X/SPI spectrum definitely requires a multi-component model. As a preliminary attempt, we used a comptonised spectrum (COMPTT, =60 keV, =0.68) plus a disk blackbody (=1.7 keV) and a Gaussian line (=7.1 keV). The average deconvolved spectrum and model are shown in Fig. 2. We also attempted to include a neutral reflection bump component but the fit resulted in a very low reflection amplitude (R2 10-2). The apparent absence of reflection hump together with a strong iron line in the JEM-X spectrum is really puzzling. This could imply that the reflecting medium is strongly ionised and/or relativistically smeared and we plan to investigate such models. However, calibration problems in the JEM-X spectrum and/or the lowest energy range of SPI is also a strong possibility. We further note that the value of the fit parameters are only indicative since, as already mentioned, large uncertainties in the calibration remain in the present version of the software. Moreover, intra-observation spectral variability could also affect the shape of the averaged spectrum and the physical parameters derived from the fitting procedure. Despite these uncertainties, we can conclude that together with the behaviour of the ASM light curves, the relative softness of the spectrum as well as the presence of the strong soft component in the JEM-X band suggest that the source was in an intermediate state.
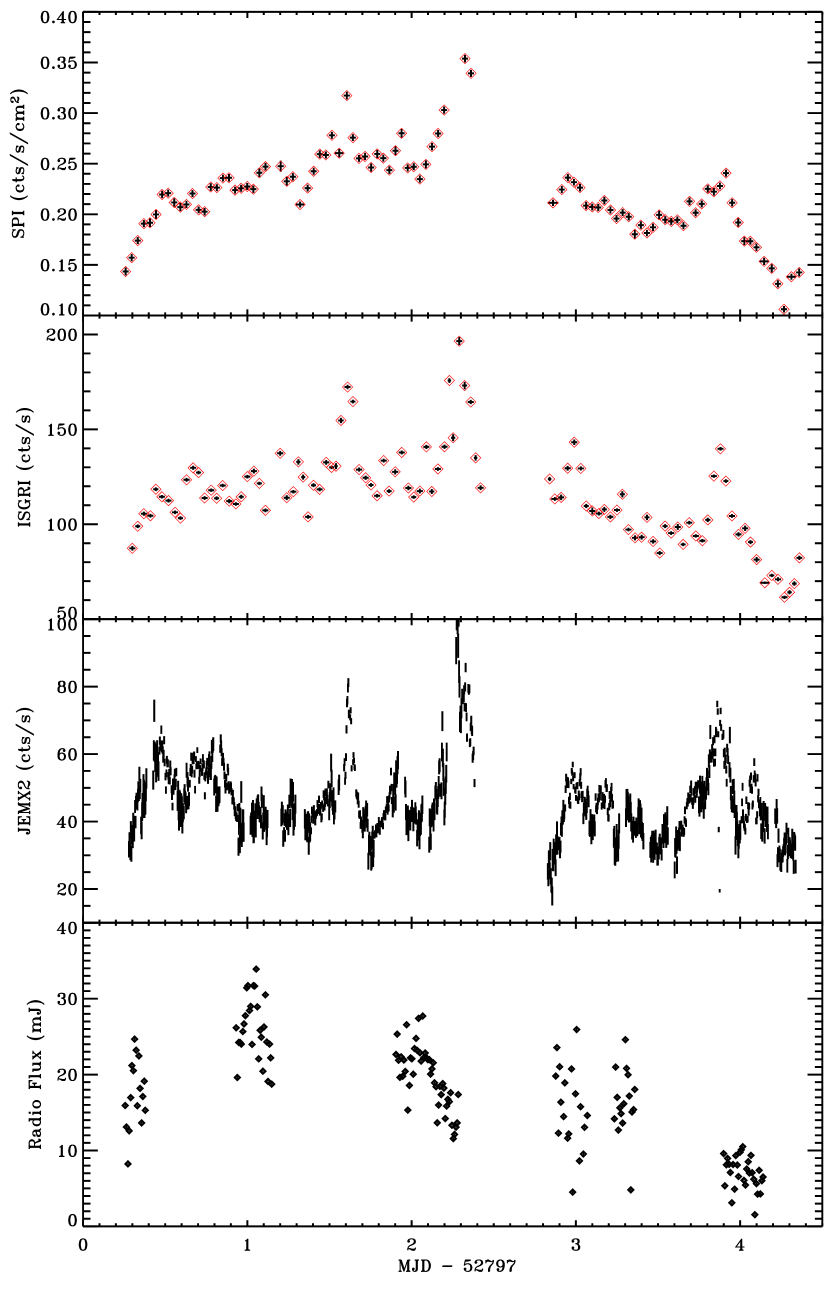
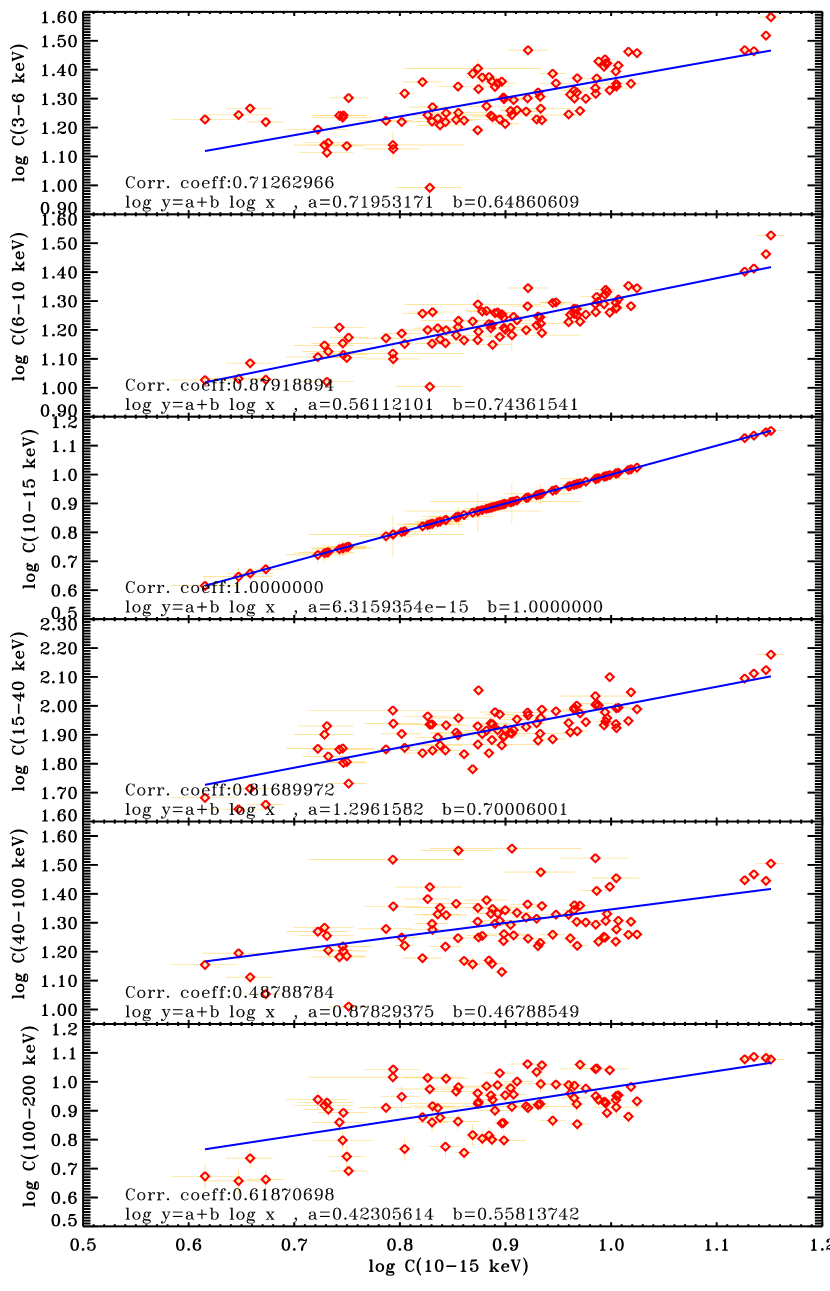
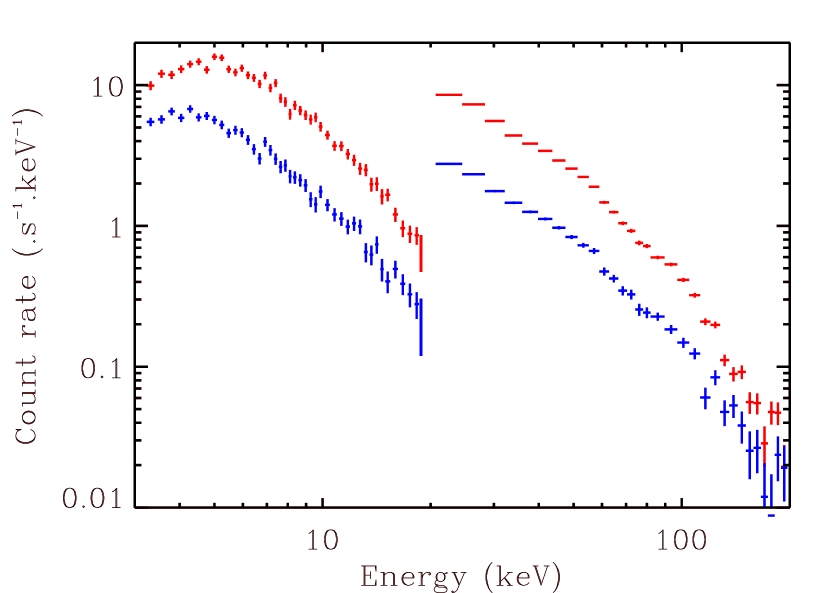
The light curves provided by JEM-X, SPI, IBIS and the Ryle telescope are shown in Fig. 3. We note that the JEM-X and ISGRI light curves are affected by the dithering mode. For instance depending on the offset angle the ISGRI flux of a source can vary by more than 20 %, especially below 40 keV. On time scales of hours, the variability appears to be dominated by changes in the overall luminosity with only weak spectral variability. In the energy range considered (3-200 keV), the 30 min average fluxes in different bands are all correlated with each other (see Fig. 4). There is however significant evidence for spectral changes when the overall luminosity increases. Fig. 5 compares the spectra obtained for the minimum and maximum luminosities in our observation. This figure shows that the higher luminosity spectrum is slightly softer above 100 keV and much harder below 7 keV. The latter, if not caused by calibration problems, could be due to a larger temperature of the thermal disc component in the higher flux pointing. On the other hand, in the 7-100 keV band, there is no hint for any spectral variability despite the overall luminosity differing by a factor of about 3.
3 Radio/High energy correlation
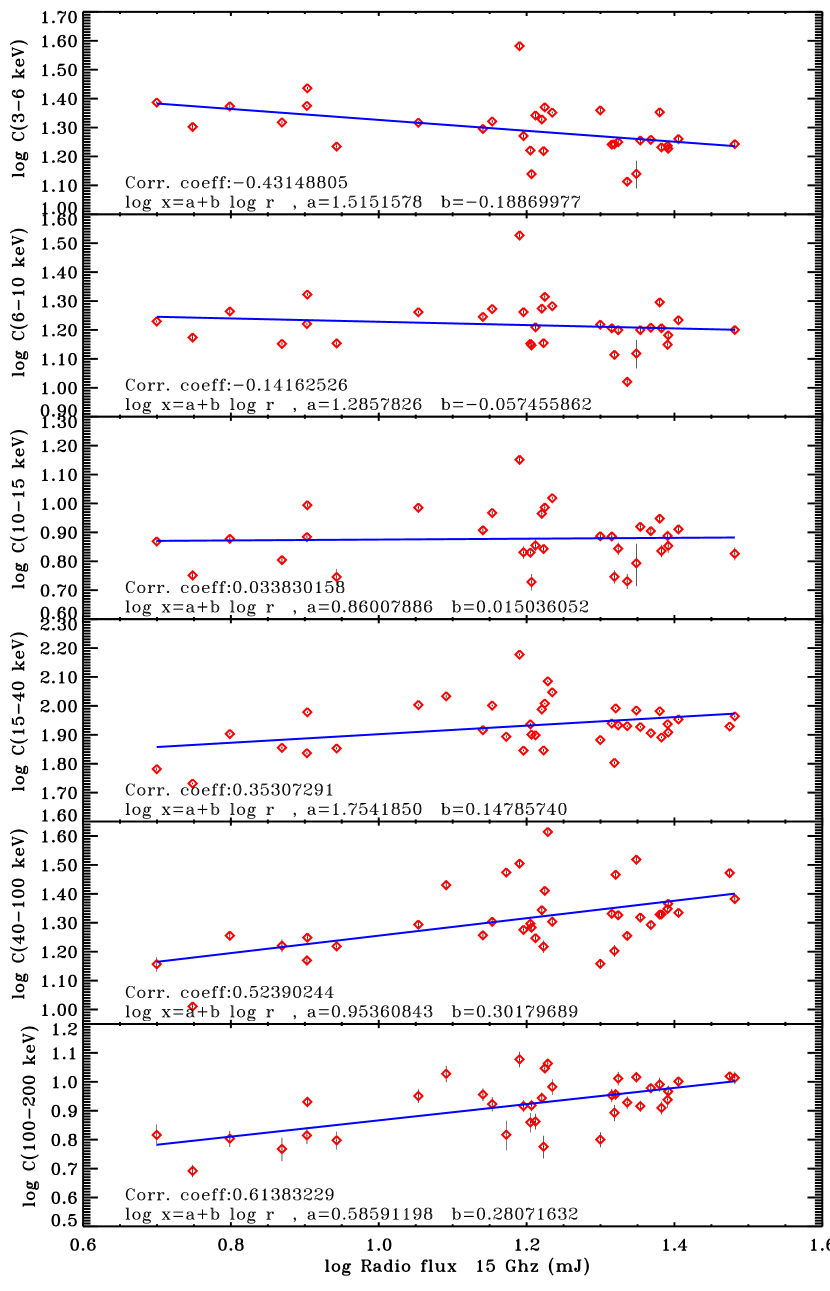
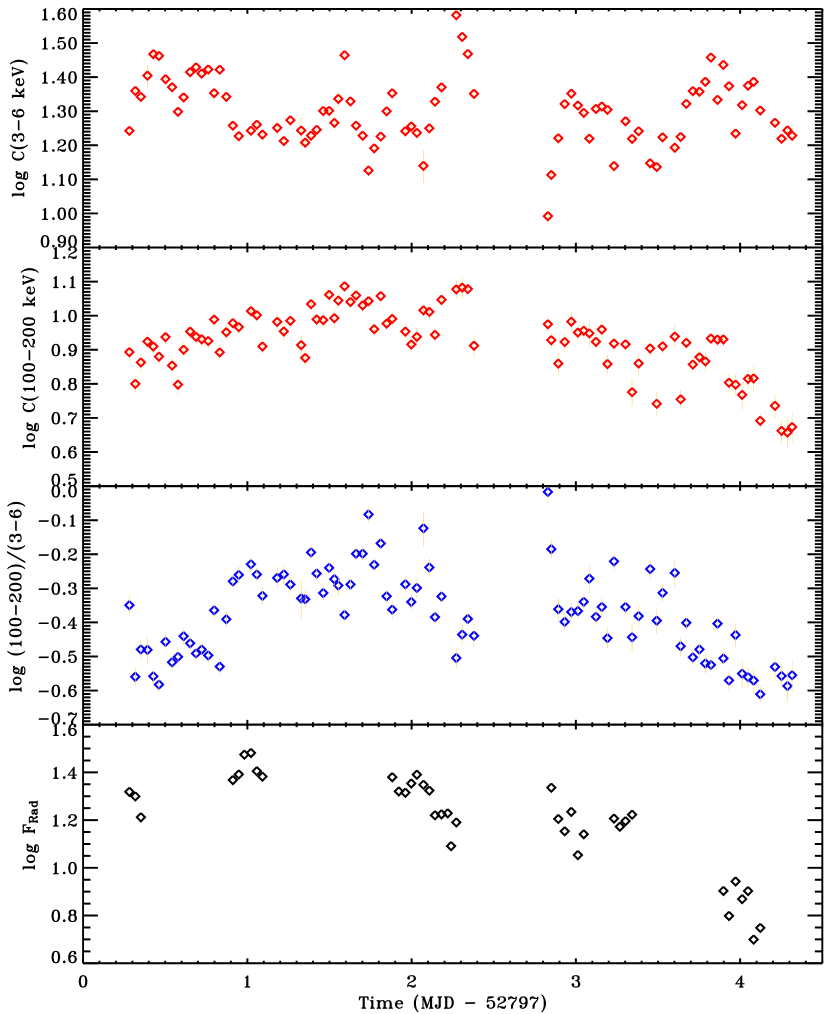
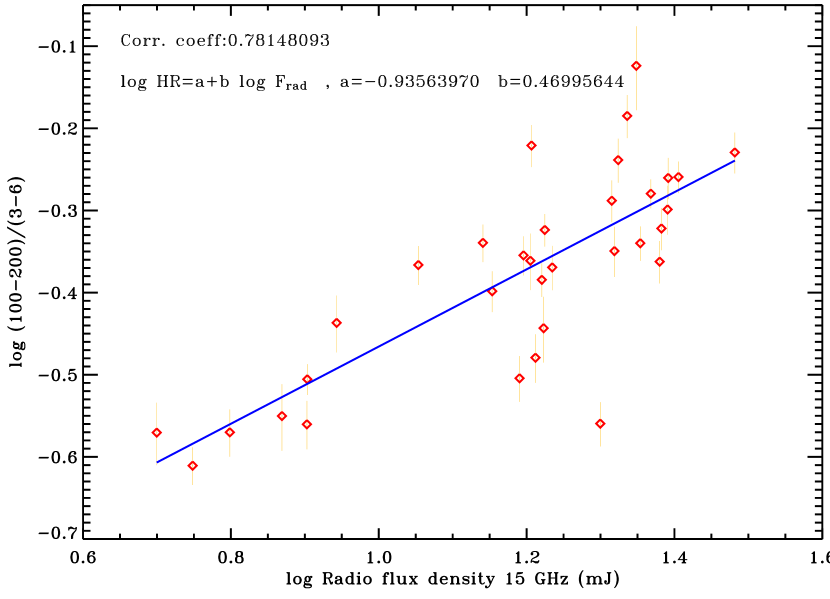
The radio flux tends to be anti-correlated with the X-ray flux (3-15 keV) and correlated with the soft gamma-rays (15 keV). This dependence of the INTEGRAL/radio flux correlation (shown in Fig. 6) suggests that the fluctuations of the radio luminosity is associated with a pivoting of the high energy spectrum, with the pivot point located around 10-15 keV. As a consequence, there is a strong correlation between the hardness of the high energy spectrum and the radio flux (see Fig. 7 and Fig. 8). Therefore, on time scales of hours, the radio jet activity is correlated with hardening of the high energy spectrum rather than high energy luminosity. This result strongly differs from what is usually reported in the hard state of Cygnus X-1 and other sources. Indeed, the radio flux is then positively correlated with the soft X-ray emission (3 - 25 keV, Corbel et al. 2000, 2003; Gallo, Fender, Pooley 2003). Nevertheless, as mentioned above, the variability and spectrum of the source suggest that during our observation, Cygnus X-1 was not in a typical hard state but in an intermediate state. Actually, the transition from hard to soft state is known to be associated with a quenching of the radio emission (Corbel et al. 2000; Gallo, Fender, Pooley 2003). As the transition to the soft state also corresponds to a strong softening of the spectrum, this is consistent with the correlation between hardness and radio flux: when, during the observation, the source gets closer to the soft state the spectrum softens and simultaneously the radio flux decreases. We note that a recent analysis of Ryle and RXTE data of Cyg X-1 (Gleissner et al., 2004, A&A, submitted) interestingly shows the same correlation tendencies during failed state transitions (Ryle/PCA: moderate anti-correlation, Ryle/HEXTE: correlation) as reported here, albeit on timescales from weeks to years.
References
- Bazzano et al. (2003) Bazzano, A., et al. 2003, A&A, 411, L389
- Belloni et al. (1996) Belloni, T., Mendez, M., van der Klis, M., et al., 1996, ApJl, 472, L107
- Bouchet et al. (2003) Bouchet L., et al. 2003, A&A, 411, L377
- bowyer et al. (1965) Bowyer, S., Byram, E.T., Chubb, T.A., Friedman, M., 1965, Sci, 147, 394
- Corbel et al. (2000) Corbel, S., et al., 2000, A&A, 359, 251
- Corbel et al. (2003) Corbel, S., Nowak, M. A., Fender, R. P., Tzioumis, A. K., & Markoff, S. 2003, A&A, 400, 1007
- Gallo, Fender, & Pooley (2003) Gallo, E., Fender, R. P., & Pooley, G. G. 2003, MNRAS, 344, 60
- Gierliński et al. (1999) Gierliński, M., et al., MNRAS, 309, 496
- Gierlinski et al. (1997) Gierlinski, M., et al., 1997, MNRAS, 288, 958
- Gleissner et al. (2004) Gleissner, T., et al., A&A, 414, 1091
- Mendez & van der Klis (1997) Mendez, M. & van der Klis, M. 1997, ApJ, 479, 926
- Pottschmidt et al. (2003) Pottschmidt, K., et al. 2003, A&A, 411, L383
- Winkler et al. (2003) Winkler, C., et al. 2003, A&A, 411, L1
- Zdziarski, Poutanen, Paciesas, & Wen (2002) Zdziarski, A. A., Poutanen, J., Paciesas, W. S., & Wen, L. 2002, ApJ, 578, 357