33email: zong-hong.zhu@nao.ac.jp
Generalized Chaplygin gas as a unified scenario of dark matter/energy: observational constraints
Although various cosmological observations congruously suggest that our universe is dominated by two dark components, the cold dark matter without pressure and the dark energy with negative pressure, the nature and origin of these components is yet unknow. The generalized Chaplygin gas (gCg), parametrized by an equation of state, , was recently proposed to be a candidate of the unified dark matter/energy (UDME) scenarios. In this work, we investigate some observational constraints on it. We mainly focus our attention on the constraints from recent measurements of the X-ray gas mass fractions in clusters of galaxies published by Allen et al. (2002,2003) and the dimensionless coordinate distances to type Ia supernovae and Fanaroff-Riley type IIb radio galaxies compiled by Daly and Djorgovski (2003). We obtain the confidence region on the two parameters fully characterizing gCg, and , from a combined analysis of these databases, where is the energy density of gCg at present. It is found that and , at a 95% confidence level, which is consistent within the errors with the standard dark matter + dark energy model, i.e., the case of . Particularly, the standard Chaplygin gas () is ruled out as a feasible UDME by the data at a 99% confidence level.
Key Words.:
cosmological parameters — cosmology: theory — distance scale — supernovae: general — radio galaxies: general — X-ray: galaxies:clusters.1 Introduction
Two dark components are invoked to explain the current cosmological measurements: the cold dark matter (CDM) without pressure and the dark energy (DE) with negative pressure (for a recent review, see Peebles & Ratra 2003). The first one contributes , and is mainly motivated to interprete galactic rotation curves and large scale structure formation (e.g. Longair 1998), while the second one () provide a mechanism for acceleration discovered by distant type Ia supernovae (SNeIa) observations (Perlmutter et al. 1998, 1999; Riess et al. 1998, 2001), and offset the deficiency of a flat universe, favoured by the measurements of the anisotropy of CMB (de Bernardis et al. 2000; Balbi et al. 2000, Durrer et al. 2003; Bennett et al. 2003; Melchiorri & Odman 2003; Spergel et al. 2003), but with a subcritical matter density parameter , obtained from dynamical estimates or X-ray and lensing observations of clusters of galaxies(for a recent summary, see Turner 2002). There are a huge number of candidates for DE in the literature, such as a cosmological constant (Carroll et al. 1992; Krauss and Turner 1995; Zhu 1998; Sahni 2002; Padmanabhan 2003), the so-called “X-matter” (Turner and White 1997; Zhu, Fujimoto and Tatsumi 2001; Lima and Alcaniz 2002; Lima, Cunha and Alcaniz 2003; Gong 2004; Chen 2004), and quintessence (Ratra and Peebles 1988; Caldwell et al. 1998; Sahni and Wang 2000; Gong 2002; Sahni et al. 2003; Padmanabhan and Choudhury 2003) etc.. However, neither CDM nor DE has laboratory evidence for its existence directly. In this sense, our cosmology depends on two untested entities. It would be nice if a unified dark matter/energy (UDME) scenario can be found in which these two dark components are different manifestations of a single fluid (Padmanabhan & Choudhury 2002; Wetterich 2002; Matos & Ureña-López 2000).
Recently, the generalized Chaplygin gas (gCg) was proposed as such a unification, which is an exotic fluid with the equation of state as follows
| (1) |
where and are two parameters to be determined. It was originally suggested by Kamenshchik et al. (2001) with , and later on extended by Bento et al. (2002) to gCg. This simple and elegant model smoothly interpolates between a nonrelativistic matter phase () and a negative-pressure dark energy phase () (Bento et al. 2002; Bilić et al 2002) and moreover it admits a well established brane interpretation (Kamenshchik et al. 2001; Bento et al. 2002; Bilić et al 2002). It is promising to be a candidate of the UDME. Such a possibility has triggered, quite recently, a wave of interest aiming to constrain the gCg model using various cosmological observations, such as SNeIa (Fabris et al. 2002; Makler et al. 2003a,b; Bean and Dore 2003; Colistete et al. 2003; Silva and Bertolami 2003; Cunha, Alcaniz and Lima 2004; Bertolami et al. 2004), the CMB anisotropy measurements (Bento et al. 2003a,b; Bean and Dore 2003; Amendola et al. 2003), the gravitational lensing surveys (Dev, Jain and Alcaniz 2003, 2004; Silva and Bertolami 2003; Makler et al. 2003b; Chen 2003a,b), the X-ray gas mass fraction of clusters (Cunha, Alcaniz and Lima 2004; Makler et al. 2003b), the large scale structure (Bilić et al. 2002; Bean and Dore 2003; Multamäki et al. 2004), and the age measurements of high- objects (Alcaniz, Jain and Dev 2003). But the results are disperse and somewhat controversial, with some of them claiming good agreement between data and the gCg model while the rest ruling it out as a feasible UDME.
In this work, we shall consider the observational constraints on the parameter space of gCg arising from the X-ray gas mass fractions of clusters of galaxies published by Allen et al. (2002, 2003) and the dimensionless coordinate distances to SNeIa and Fanaroff-Riley type IIb (FRIIb) radio galaxies compiled by Daly and Djorgovski (2003). We perform a combined analysis of these databases and obtain at a 95% confidence level, and , a parameter range within which the gCg could be a candidate for UDME. However, the standard Chaplygin gas with is ruled out as a UDME by the data at a 99% level. The plan of the paper is as follows. In the next section, we provide a brief summary of the gCg and basic equations relevant to our work. Constraints from the X-ray gas mass fractions in galaxy clusters are discussed in section 3. In section 4 we discuss the bounds imposed by the dimensionless coordinate distances to SNeIa and FRIIb radio galaxies. Finally, we present a combined analysis, our conclusion and discussion in section 5.
2 The generalized Chaplygin gas: basic equations
We consider a flat universe that contains only baryonic matter and the gCg (we ignore the radiation components in the universe that are not important for the cosmological tests considered in this work). Then the Friedmann equation is simply given by . Both of the baryonic matter and the gCg components satisfy the relativistic energy-momentum conservation equation, , where is the scale factor of the universe and ‘’ stands for the derivative relative to cosmic time. From for the baryonic matter and the equation of state of Eq.(1) for the gCg component, we have
| (2) |
where and are the energy densities of the baryonic matter and the gCg at present respectively, and is a substitution of the parameter . The scale factor is related to the observable redshift as . Now we evaluate the dimensionless coordinate distance, , the angular diameter distance, , and the luminosity distance, , as functions of redshift as well as the parameters of the model. The three distances are simply related to each other by . We define the redshift dependence of the Hubble paramter as , where kms-1Mpc-1 is the present Hubble constant. The HST key project result is (Freedman et al. 2001). Parametrizing the model as , we get function as (Bento et al.2003a,b; Cunha et al. 2004; Alcaniz et al. 2003)
| (3) | |||||
where is the density parameter of the baryonic matter component. The observed abundances of light elements together with primordial nucleosynthesis give (O’Meara et al. 2001). Then, it is straightforward to show that the distances are given by
| (4) | |||||
3 Constraints from the X-ray gas mass fraction of galaxy clusters
As the largest virialized systems in the universe, clusters of galaxies provide a fair sample of the matter content of the whole universe (White et. al. 1993). A comparison of the gas mass fraction of galaxy clusters, , inferred from X-ray observations, with determined by nucleosynthesis can be used to constrain the density parameter of the universe directly (White & Frenk 1991; Fabian 1991; White et. al. 1993; White & Fabian 1995; Evrard 1997; Fukugita, Hogan & Peebles 1998; Ettori & Fabian 1999). Sasaki (1996) and Pen (1997) showed that the data of clusters of galaxies at different redshifts can also, in principle, be used to constrain other cosmological parameters decribing the geometry of the universe. This is based on the fact that the measured values for each cluster of galaxies depend on the assumed angular diameter distances to the sources as . The ture, underlying cosmology should be the one which make these measured values to be invariant with redshift (Sasaki 1996; Pen 1997; Allen at al. 2003). However, various uncertainties in previous measurements have seriously complicated the application of such methods.
Recently, Allen et al. (2002; 2003) reported precise measurements of the profiles for 10 relaxed clusters determined from the Chandra observational data. Except for Abell 963, the profiles of the other 9 clusters appear to have converged or be close to converging with a canonical radius , which is defined as the radius within which the mean mass density is 2500 times the critical density of the universe at the redshift of the cluster (Allen et al. 2002, 2003). The gas mass fraction values of these 9 clusters are shown in Figure 1. With the reduced systematic uncertainties, Allen et al. (2002; 2003) successfully applied a method similar to those proposed by Sasaki (1996) and Pen (1997) to the data and obtained a tight constraint on and an interesting constraint on cosmological constant. We will use this database to constrain the gCg model as a UDME. Following Allen et al. (2002), we have the model function as
| (5) |
where the bias factor (Bialek et al. 2001; Allen et al. 2003) is a parameter motivated by gas dynamical simulations, which suggest that the baryon fraction in clusters is slightly depressed with respect to the Universe as a whole (Bialek et al. 2001). The term represents the change in the Hubble parameter from the defaut value of and the ratio accounts for the deviations of the gCg model from the default standard cold dark matter (SCDM) cosmology. Note that is the effective matter density parameter (Cunha et al. 2004; Makler et al. 2003b), i.e., the coefficient of the term scaling as in equation (3) when the gCg behaves like dust or equivalently . It is easy to show that, . We should keep in mind that the bias factor value for a gCg model might be different from the value given above, which leads to a systematic error in this kind of analysis. Because linearly scales the X-ray mass fraction, , in Eq.(5), lowering (raising) it by would cause the fitting value of to decrease (increase) by a similar amount.

A minimization method is used to determine the gCg model parameters and as follows (Allen et al. 2003)
| (6) | |||||
where refers to equation (5), is the measured with the defaut SCDM cosmology, and is the symmetric root-mean-square errors ( refers to the th data point, with totally 9 data). The summation is over all of the observational data points.
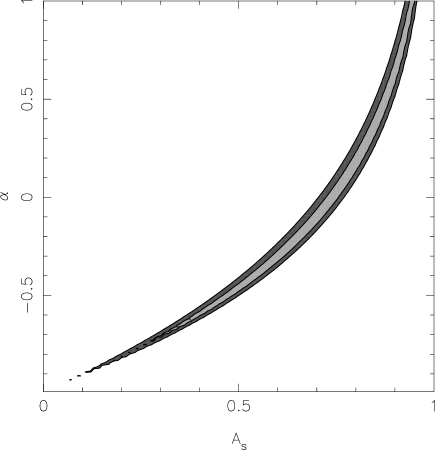
The results of our analysis for the gCg model are displayed in Figure 2. We show 68% and 95% confidence level contours in the (,) plane using the lower shaded and the lower plus darker shaded areas respectively. The best fit happens at and . Although the data constrain efficiently the parameter plane into a narrow strip, the two parameters, and , are highly degenerate. This degeneracy can also be seen clearly from the relation, . It has been shown that the X-ray gas mass fraction is mostly sensitive to no matter what the cosmological model is (Allen et al. 2002, 2003; Zhu et al. 2004a,b). In our case, a precise determination of is expected, hence forming a narrow strip in the () plane composed of a bundle of curves given by const.. In order to determine and respectively, an independent measurement of or is needed. We will show that, in the next section, the dimensionless coordinate distances to SNeIa and FRIIb radio galaxies are well appropriate for this purpose, because the data are only sensitive to .
4 Constraints from the dimensionless coordinate distance data
Motivated by deriving the expansion rate and the acceleration rate of the universe as functions of redshift, Daly and Djorgovski (2003) compiled a large database of the dimensionless coordinate distance measurements estimated from the observations of SNeIa and FRIIb radio galaxies, and successfully applied it for their purpose. We will show this sample provides a precise determination of , and well breaks the degeneracy presented in the X-ray gas mass fraction test.
The database consists in the 54 SNeIa in the “primary fit C” used by Perlmutter et al. (1999), the 37 SNeIa published by Riess et al. (1998), the so far highest redshift supernova 1997ff presented by Reiss et al. (2001), and the 20 FRIIb radio galaxies studied by Daly and Guerra (2002). The authors used the B-band magnitude-redshift relation, , to determine for each supernova, where is the “Hubble-constant-free” -band absolute magnitude at maximum of a SNIa. For the 14 supernovae that are present in both the Perlmutter et al. (1999) and Riess et al. (1998) samples, we will use their average values of with appropriate error bars (see Table 4 of Daly and Djorgovski 2003). Therefore we totally have 78 SNeIa data points which are shown as solid circles in Figures 3. The dimensionless coordinate distances of FRIIb radio galaxies were estimated through the method proposed by Daly (1994) (see also Guerra, Daly, and Wan 2000; Podariu et al. 2003; Daly and Djorgovski 2003). We use their values of for 20 FRIIb radio galaxies obtained using the best fit to both the radio galaxy and supernova data (see Table 1 of Daly and Djorgovski 2003), that are shown as empty squares in Figure 3.

We determine the model parameters and by minimizing , where refers to the theoretical prediction from equation (4), is the observed dimensionless coordinate distances of SNeIa and FRIIb radio galaxies, and is the uncertainty.
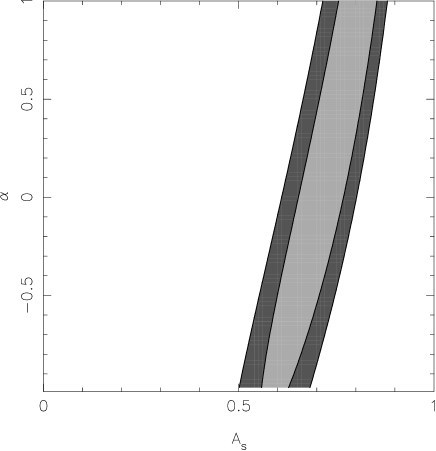
Figure 4 displays the results of our analysis for the gCg model. We show 68% and 95% confidence level contours in the (, ) plane using the lower shaded and the lower plus darker shaded areas respectively. The best fit happens at and . It is clear from the figure, that the dimensionless coordinate distance test alone constrains well into a narrow range, but limits weakly. However, it is just appropriate for our purpose, to break the degeneracy presented in the X-ray gas mass fraction test of last section. As we shall see in Sec.5, when we combine these two tests, we could get very stringent constraints on both and , hence test the gCg as a UDME scenario efficiently.
5 Combined analysis, conclusion and discussion
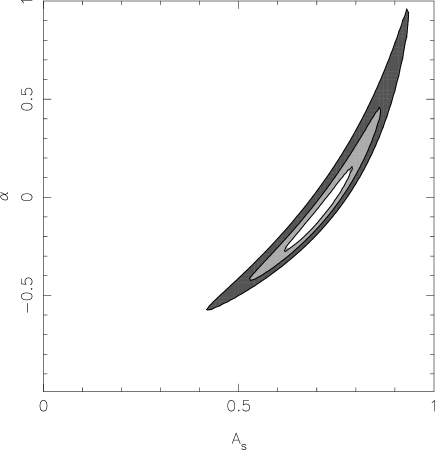
Figure 5 displays the results of our combined analysis of the constraints from the X-ray gas mass fractions of galaxy clusters and the dimensionless coordinate distances to SNeIa and FRIIb radio galaxies. We show 68%, 95% and 99% confidence level contours in the (, ) plane. The best fit happens at and . As it shown, although there is a highly degeneracy between and in the X-ray mass fraction test, and the dimensionless coordinate distance test is sensitive to only, a combination of the two data sets gives at a 95% confidence level that and , a very stringent constraint on the gCg. These are the parameter ranges of the gCg permitted by the data as a candidate of UDME, which is consistent within the errors with the standard dark matter + dark energy scenario, i.e., the case of . Particularly, the standard Chaplygin gas with is ruled out as a feasible UDME by the data at a 99% confidence level. Using the CMBR power spectrum measurements from BOOMERANG (de Bernardis et al. 2002) and Archeops (Benoit et al. 2003), together with the SNeIa constraints, Bento et al. (2003a) obtained, , and , which is comparable with our results.
More recently, Bertolami et al. (2004) analyzed the gCg model in the light of the latest SNeIa data (Tonry et al. 2003, Barris et al. 2004). They considered both the flat and non-flat models. For the flat case, their best fit values for [] are given by [0.79, 0.999] and [0.936, 3.75] with and without the constraint respectively. Particularly, up to 68% confidence level, the , i.e., the CDM case, is clearly excluded, though it is consistent at 95% confidence level (Bertolami et al. 2004). The authors considered the scenario in which the gCg unified all matter and energy components, while in our analysis, only dark matter and dark energy are unified as the gCg. This might be one factor responsible for the difference between their results and ours. Another even more important factor is we make heavy use of the X-ray gas mass fraction in clusters, which prefers to . This kind of analysis depends on the assumption that the values should be invariant with redshift, which has been criticised by a minority of workers in the field. For example, a recent comparison of distant clusters observed by XMM-Newton and Chandra satellites with available local cluster samples indicate a possible evolution of the – relation with redshift, i.e., the standard paradigm on cluster gas physics need to be revised (Vauclair et al. 2003). We should keep this point in mind when we compare the results mentioned above.
Besides various dark energy models (see, e.g., Peeble and Ratra 2003), several possible mechanisms without any DE component have been also proposed for acceleration of the universe, such as brane world cosmologies (Randall and Sundrum 1999a,b; Alcaniz, Jain and Dev 2002; Deffayet, Dvali and Gabadadze 2002; Jain, Dev and Alcaniz 2002, 2003), and Cardassian expansion model (Freese and Lewis 2002; Zhu and Fujimoto 2002,2003,2004). However, it must be more interesting if a UDME can be found in which a single fluid plays the role of both CDM and DE. The generalized Chaplygin gas is such a intriguing candidate, which deserves to explore its various observational effects (Kamenshchik et al. 2001; Bento et al. 2002;2003a,b; Bilić et al 2002; Bean and Dore 2003; Cunha, Alcaniz and Lima 2004; Makler et al. 2003b). In this paper we have focused our attention on two observables, the X-ray gas mass fraction and the dimensionless coordinate distance. We have shown that stringent constraints on the parameters and , that completely characterize the scenario, can be obtained from the combination analysis of the X-ray mass fractions of galaxy clusters and the dimensionless coordinate distances to SNeIa and FRIIb radio galaxies. It is natually hopeful that, with a more general analysis such as a joint investigation on various cosmological observations, one could show clearly if this scenario of UDME constitutes a feasible description of our universe.
Acknowledgements.
I would like to thank S. Allen for sending us their compilation of the X-ray mass fraction data and his help. My thanks go to the anonymouse referee for valuable comments and useful suggestions, which improved this work very much. This work was supported by the National Natural Science Foundation of China and the National Major Basic Research Project of China (G2000077602). I am also grateful to all TAMA & LCGT members and the staff of NAOJ for their hospitality and help during his stay.References
- Alcaniz et al. (2002) Alcaniz, J. S., Jain, D. and Dev, A. 2002, Phys. Rev. D, 66, 067301
- Alcaniz et al. (2003) Alcaniz, J. S., Jain, D. and Dev, A. 2003, Phys. Rev. D, 67, 043514
- (3) Allen S.W., Schmidt R.W., Fabian A.C., 2002, MNRAS, 334, L11
- (4) Allen S.W., Schmidt R.W., Fabian A.C., Ebeling, H. 2003, MNRAS, 342, 287
- (5) Amendola, L., Finelli, L. F., Burigana, C. and Carturan, D. 2003, JCAP, 0307, 005
- (6) Balbi, A. et al. 2000, ApJ, 545, L1
- (7) Barris, B. J. et al. 2004, ApJ, 602, 571
- (8) Bean, R. and Dore, O. 2003, Phys. Rev. D, 68, 023515
- (9) Bennett, C. L. et al. 2003 ApJS, 148, 1
- (10) Benoit, A. et al. 2003, A&A, 399, L25
- (11) Bento, M. C., Bertolami, O and Sen, A. A. 2002, Phys. Rev. D, 66, 043507
- (12) Bento, M. C., Bertolami, O and Sen, A. A. 2003a, Phys. Rev. D, 67, 063003
- (13) Bento, M. C., Bertolami, O., and Sen, A. A. 2003b, Phys.Lett.B, 575, 172
- (14) Bertolami, O., Sen, A. A., Sen, S. and Silva, P. T. 2004, astro-ph/0402387
- (15) Bialek J.J., Evrard A.E., Mohr J.J., 2001, ApJ, 555, 597
- (16) Bilić, N., Tupper, G. B., & Viollier, R. D. 2002, Phys.Lett.B, 535, 17
- Caldwell et al. (1998) Caldwell, R., Dave, R., and Steinhardt, P. J. 1998, Phys. Rev. Lett., 80, 1582
- Carroll et al. (1992) Carroll, S., Press, W. H. and Turner, E. L. 1992, ARA&A, 30, 499
- (19) Chen, D. M. 2003a, ApJ, 587, L55
- (20) Chen, D. M. 2003b, A&A, 397, 415
- Chen (2004) Chen, D. M. 2004, A&A, 418, 387
- (22) Colistete Jr, R., Fabris, J. C., Gon alves, S. V. B. and de Souza, P. E. 2003, astro-ph/0303338
- (23) Cunha, J. V., Lima, J. A. S. and Alcaniz, J. S. 2004, Phys. Rev. D, 69, 083501
- (24) Daly, R. A. 1994, ApJ, 426, 38
- (25) Daly, R. A., & Guerra, E. J. 2002, AJ, 124, 1831
- (26) Daly, R. A. and Djorgovski, S. G. 2003, ApJ, 597, 9
- (27) de Bernardis, P. et al. 2000, Nature, 404, 955
- (28) de Bernardis, P. et al. 2002, ApJ, 564, 559
- (29) Deffayet, C., Dvali, G. and Gabadadze, G. 2002, Phys. Rev. D, 65, 044023
- (30) Dev, A., Jain, D. and Alcaniz, J. S. 2003, Phys. Rev. D, 67, 023515
- (31) Dev, A., Jain, D. and Alcaniz, J. S. 2004, A&A, 417, 847
- (32) Durrer, R., Novosyadlyj, B. and Apunevych, S. 2003, ApJ, 583, 33
- (33) Ettori S. and Fabian A.C., 1999, MNRAS, 305, 834
- (34) Evrard A.E., 1997, MNRAS, 292, 289
- (35) Fabian A.C., 1991, MNRAS, 253, L29
- (36) Fabris, J. C., Goncalves, S. V. B. and de Souza, P. E. 2002, astro-ph/0207430
- (37) Freedman W. et al., 2001, ApJ, 553, 47
- (38) Freese, K. and Lewis, M. 2002, Phys.Lett.B, 540, 1
- (39) Fukugita M., Hogan C.J. and Peebles P.J.E., 1998, ApJ, 503, 518
- (40) Gong, Y. 2002, Class.Quan.Grav., 19, 4537
- (41) Gong, Y. 2004, astro-ph/0401207
- (42) Guerra, E. J., Daly, R. A., & Wan, L. 2000, ApJ, 544, 659
- (43) Jain, D., Dev, A. and Alcaniz, J. S. 2002, Phys. Rev. D, 66, 083511
- (44) Jain, D., Dev, A. and Alcaniz, J. S. 2003, Class.Quan.Grav., 20, 4163
- (45) Kamenshchik, A., Moschella, U. and Pasquier, V. 2001, Phys.Lett.B, 511, 265
- Krauss and Turner (1995) Krauss, L. M. and Turner, M. S. 1995, Gen. Rel. Grav., 27, 1137
- (47) Lima J. A. S. & Alcaniz J. S. 2000b, A&A, 357, 393
- Lima et al. (2003) Lima, J. A. S., Cunha, J. V. and Alcaniz, J. S. 2003, Phys. Rev. D, 68, 023510
- (49) Longair, M. S. 1998, Galaxy Formation (Springer-Verlag Berlin Heidelberg)
- (50) Makler, M., Oliveira, S. Q., & Waga, I. 2003a, Phys.Lett.B, 555, 1
- (51) Makler, M., Oliveira, S. Q., & Waga, I. 2003b, Phys. Rev. D, 68, 123521
- (52) Matoa,T. and Ureña-López,A. 2000, Class.Quan.Grav., 17, L75
- (53) Melchiorri, A. and Odman, C. 2003, Phys. Rev. D, 67, 081302(R)
- (54) Multamäki, T., Manera, M. and Gaztañaga, E. 2004, Phys. Rev. D, 69, 023004
- (55) O’Meara J.M. et al. 2001, ApJ, 552, 718
- (56) Padmanabhan, T. 2003, Phys. Rept. 380, 235
- (57) Padmanabhan, T. and Choudhury, T. R. 2002, Phys. Rev. D, 66, 081301
- (58) Padmanabhan, T. and Choudhury, T. R. 2003, MNRAS, 344, 823
- (59) Peebles, P. J. E. and Ratra, B. 2003, Rev. Mod. Phys. 75, 559
- (60) Pen U., 1997, New Astron., 2, 309
- (61) Perlmutter, S. et al. 1998, Nature, 391, 51
- (62) Perlmutter, S. et al. 1999, ApJ, 517, 565
- (63) Podariu, S., Daly, R. A., Mory, M. P. and Ratra, B. 2003, ApJ, 584, 577
- (64) Randall, L. and Sundrum, R. 1999a, Phys. Rev. Lett., 83, 3370
- (65) Randall, L. and Sundrum, R. 1999b, Phys. Rev. Lett., 83, 4690
- Ratra and Peebles (1988) Ratra, B. and P.J.E. Peebles, P. J. E. 1988, Phys. Rev. D, 37, 3406
- (67) Riess, A. G. et al. 1998, AJ, 116, 1009
- (68) Riess, A. G. et al. 2001, ApJ, 560, 49
- (69) Sahni,V. 2002, Class.Quant.Grav. 19, 3435
- (70) Sahni,V. and Wang,L. 2000, Phys. Rev. D, 62, 103517
- (71) Sahni, V., Saini, T. D., Starobinsky, A. A. and Alam, U. 2003, JETP Lett. 77, 201
- (72) Sasaki, S. 1996, PASJ, 48, L119
- (73) Silva, P. T. and Bertolami, O. 2003, ApJ, 599, 829
- (74) Spergel, D. N. et al. 2003 ApJS, 148, 175
- (75) Tonry, J. L. et al. 2003, ApJ, 594, 1
- (76) Turner, M. S. 2002, ApJ, 576, L101
- Turner and White (1997) Turner, M. S. and White, M. 1997, Phys. Rev. D, 56, R4439
- (78) Vauclair, S. C., Blanchard, A. and Sadat, R. et al. 2003, A&A, 412, L37
- (79) Wetterich, C. 2002, Phys. Rev. D, 65, 123512
- (80) White S.D.M. and Fabian A.C., 1995, MNRAS, 273, 72
- (81) White S.D.M. and Frenk C.S., 1991, ApJ, 379, 52
- (82) White S.D.M., Navarro J.F., Evrard A.E., Frenk C.S., 1993, Nature, 366, 429
- (83) Zhu, Z. -H. 1998, A&A, 338, 777
- (84) Zhu, Z. -H. and Fujimoto, M. -K. 2002, ApJ, 581, 1
- (85) Zhu, Z. -H. and Fujimoto, M. -K. 2003, ApJ, 585, 52
- (86) Zhu, Z. -H. and Fujimoto, M. -K. 2004, ApJ, 602, 12
- (87) Zhu, Z. -H., Fujimoto, M. -K. and He, X. -T. 2004a, A&A, 417, 833
- (88) Zhu, Z. -H., Fujimoto, M. -K. and He, X. -T. 2004b, ApJ, 603, 365
- (89) Zhu, Z. -H., Fujimoto, M. -K. and Tatsumi, D. 2001, A&A, 372, 377