Multicolor Surface Photometry of Lenticulars I. The Data
Abstract
We present in this paper multicolor surface and aperture photometry in the and bands for a sample of 34 lenticular galaxies from the UGC catalogue. From surface photometric analysis, we obtain radial profiles of surface brightness, colors, ellipticity, position angle and the Fourier coefficients which describe the departure of isophotal shapes from purely elliptical form and find the presence of dust lanes, patches and ring like structure in several galaxies in the sample. We obtain total integrated magnitudes and colors and find that these are in good agreement with the values from the RC3 catalogue. Isophotal colors are correlated with each other, following the sequence expected for early-type galaxies. The color gradients in lenticulars are more negative than the corresponding gradients in ellipticals. There is a good correlation between and color gradients, and the mean gradient in the and colors are , , magnitude per dex in radius respectively.
Subject headings:
galaxies: lenticular - galaxies: photometry - galaxies: fundamental parameters1. Introduction
Hubble (1936) introduced lenticular (S0) galaxies as a morphological transition class between ellipticals and early-type spirals. The lenticular galaxies have disks with luminosity ranging from ten to hundred percent of the bulge luminosity, but without any conspicuous spiral arms. From their appearance, and also their stellar content, they seem to be more like ellipticals rather than spirals, and have often been misclassified due to this fact.
It has been suggested (van den Bergh 1994) that there could be different, but overlapping, sub-populations amongst the lenticulars. There are several scenarios possible for the formation of these galaxies. They could be of primordial origin, or could have been formed by the stripping of gas from spirals, which changes the morphology (Abadi, Moore & Bower 1999), or through the mergers of unequal-mass spirals (Bekki 1998). There could be a significant difference in the ages of disks and bulges, in which case they should have different stellar population, leading to different colors. Bothun & Gregg (1990) found that bulges and disks of lenticulars were well separated in the vs diagram which they interpreted to mean that the disks are younger than bulges by 3-5 Gyr. But Peletier & Balcells (1996) found that the color differences between the disks and bulges are much smaller than those found by Bothun & Gregg (1990), and inferred that the disks are only slightly younger than bulges, with the difference in age being in the range 0-3 Gyr. In a study of 12 highly inclined lenticulars, Michard & Poulain (2000) found that disks were often redder than bulges, which indicates that there could be large concentration of dust in the disks. A detailed multiband study of the morphology of representative samples of lenticulars, with possible separation of bulge and disk components, and comparison of their properties with those of ellipticals, and with the bulges and disks of spirals will be very important in addressing these and other possibilities.
We have observed a sample of 34 lenticular galaxies in the optical and infrared bands, and present in this paper their surface and aperture photometry, together with color profiles and mean color gradients. We will in a subsequent publication present a decomposition of the surface brightness distribution of the galaxies into bulge and disk components using the decomposition technique developed by Wadadekar, Robbason & Kembhavi (1999). Using the results of the decomposition, it should be possible to see where the lenticulars are situated relative to the fundamental plane of ellipticals (see e. g. Jorgensen, Franx & Kjaergaard 1996 and references therein) and the photometric plane for ellipticals and the bulges of spiral galaxies (Khosroshahi, Wadadekar & Kembhavi 2000a and 2000b). With multiband data, it might be possible to determine in this manner the bulge-to-disk luminosity ratios of these galaxies in different bands, as well as the distribution of different colors as a function of distance from the center in the bulge and disk components separately, thus facilitating the comparison with other galaxy types. Our data set will be very useful for detailed comparison with other galaxy types, as well as in constraining stellar population models for the lenticulars.
The present paper deals with the details of the sample selection, observations, data reduction and analysis. This paper is organized as follows : the selection criteria for the sample, details of observations and the technique used in data reduction are described in 2. The analysis and results from the surface photometry and aperture photometry are discussed in 3. The distribution of color gradients are discussed in 4 and a summary of the results is presented in 5. An appendix contains comments on individual galaxies.
| Galaxy | Type | Diameter | ||||
|---|---|---|---|---|---|---|
| () | (arcmin) | |||||
| UGC 00080 | NGC 0016 | 3.0 | 1.8x1.0 | 0.010194 | 12.50 | 20.93 |
| UGC 00491 | NGC 0252 | 1.0 | 1.5x1.1 | 0.016645 | 13.40 | 21.65 |
| UGC 00859 | NGC 0473 | 0.0 | 1.7x1.1 | 0.007118 | 13.20 | 19.82 |
| UGC 00926 | NGC 0499 | 2.5 | 1.6x1.3 | 0.014673 | 13.00 | 21.55 |
| UGC 01250 | NGC 0670 | 2.0 | 2.0x1.0 | 0.012352 | 13.10 | 20.76 |
| UGC 01823 | NGC 0890 | 3.0 | 2.5x1.7 | 0.013323 | 12.50 | 22.31 |
| UGC 01964 | NGC 0940 | 2.0 | 1.2x1.0 | 0.017319 | 13.40 | 21.64 |
| UGC 02039 | NGC 0969 | 2.0 | 1.7x1.6 | 0.015054 | 13.50 | 21.51 |
| UGC 02187 | NGC 1040 | 2.0 | 1.7x0.8 | 0.016054 | 14.00 | 21.06 |
| UGC 02322 | NGC 1106 | 1.0 | 1.8x1.8 | 0.014467 | 13.70 | 21.39 |
| UGC 03087 | 2.0 | 0.8x0.6 | 0.033010 | 14.20 | 22.28 | |
| UGC 03178 | NGC 1671 | 2.0 | 1.1x0.9 | 0.021270 | 13.90 | 21.63 |
| UGC 03452 | NGC 2208 | 2.0 | 1.7x1.0 | 0.018763 | 14.00 | 21.26 |
| UGC 03536 | 2.0 | 1.1x0.6 | 0.015641 | 14.40 | 20.86 | |
| UGC 03567 | 2.0 | 1.0x0.8 | 0.020164 | 14.20 | 21.26 | |
| UGC 03642 | 2.0 | 1.5x1.1 | 0.015004 | 13.50 | 21.47 | |
| UGC 03683 | 2.0 | 2.0x1.3 | 0.019076 | 14.10 | 21.53 | |
| UGC 03699 | NGC 2332 | 2.0 | 1.5x1.0 | 0.019467 | 14.00 | 21.52 |
| UGC 03792 | 0.0 | 1.8x1.3 | 0.020608 | 14.00 | 21.46 | |
| UGC 03824 | 2.0 | 0.9x0.8 | 0.017866 | 14.40 | 20.76 | |
| UGC 04347 | NGC 2563 | 2.0 | 2.1x1.5 | 0.014944 | 13.70 | 21.06 |
| UGC 04767 | 2.0 | 1.3x1.1 | 0.024127 | 14.00 | 21.80 | |
| UGC 04901 | NGC 2804 | 2.0 | 2.2x2.0 | 0.028099 | 14.00 | 22.23 |
| UGC 05292 | NGC 3032 | 2.0 | 2.0x1.8 | 0.005114 | 13.00 | 19.43 |
| UGC 06013 | 2.0 | 0.9x0.8 | 0.021898 | 13.90 | 21.69 | |
| UGC 06389 | NGC 3648 | 2.0 | 1.3x0.8 | 0.006631 | 13.50 | 19.50 |
| UGC 06899 | NGC 3971 | 2.0 | 1.4x1.2 | 0.022489 | 13.90 | 21.75 |
| UGC 07142 | NGC 4143 | 2.0 | 2.3x1.4 | 0.003616 | 12.00 | 20.03 |
| UGC 07473 | NGC 4350 | 2.0 | 3.0x1.4 | 0.004140 | 11.50 | 20.48 |
| UGC 07880 | NGC 4638 | 3.0 | 2.2x1.4 | 0.003883 | 12.20 | 19.64 |
| UGC 07933 | NGC 4673 | 5.0 | 1.0x0.9 | 0.022856 | 13.70 | 21.99 |
| UGC 08675 | NGC 5273 | 2.0 | 2.8x2.5 | 0.003616 | 12.70 | 19.24 |
| UGC 09200 | NGC 5580 | 2.0 | 1.8x1.8 | 0.010814 | 13.60 | 20.46 |
| UGC 09592 | NGC 5784 | 2.0 | 1.9x1.8 | 0.017912 | 13.70 | 21.78 |
| UGC 11178 | NGC 6599 | 2.0 | 1.3x1.2 | 0.010120 | 13.70 | 20.30 |
| UGC 11356 | NGC 6703 | 2.5 | 2.5x2.3 | 0.008209 | 12.40 | 21.14 |
| UGC 11781 | 2.0 | 1.4x1.1 | 0.015501 | 13.70 | 21.74 | |
| UGC 11972 | NGC 7248 | 2.5 | 1.7x0.9 | 0.014627 | 13.60 | 21.22 |
| UGC 12443 | NGC 7539 | 2.0 | 1.5x1.2 | 0.020174 | 13.70 | 21.88 |
| UGC 12655 | 2.0 | 1.4x0.9 | 0.017269 | 14.00 | 21.24 | |
Note. — Columns (1) and (2) give the UGC catalogue number and NGC catalogue number respectively, column (3) gives the morphological type from the RC3 catalogue, columns (4) and (5) give the diameter (in arcmin) along the major and minor axis respectively, and the redshift from NASA Extragalactic Database (NED), column (6) give the photographic magnitude from the UGC catalogue and column (7) give the absolute B magnitude for .
2. Observations and data reduction
2.1. The sample
Our sample consists of 40 bright and medium sized galaxies, classified as lenticulars, from the Uppsala General Catalogue of Galaxies (UGC). The UGC is essentially complete to a limiting major-axis diameter of one and/or to a limiting apparent magnitude of 14.5 on the blue prints of the Palomar Observatory Sky Survey (POSS). Coverage is limited to the sky north of declination . For our sample we selected galaxies with apparent blue magnitude brighter than , diameter and declination in the range . The sample galaxies are listed in Table 1. Our sample, though not complete, is representative of lenticular galaxies in the field with the above properties.
2.2. Optical imaging
Our optical -band observations were carried out with the Observatorio Astrofísico Guillermo Haro 2.1-m telescope at Cananea, Mexico. We used a Tektronics CCD of pixel format at the Cassegrain focus of the telescope with pixel binning, resulting in a scale of pixel-1 and a field of view of . Typically two exposures each of ten, five and five minutes in , and bands respectively were taken for each galaxy. Exposure times were reduced if the central pixels were close to saturation. Twilight sky exposures were taken for flat-fielding purposes. Several bias frames were obtained at the start and end of each night. All the observations were carried out in three runs in December 2001, February 2002 and October 2002. A total of 34 galaxies were observed in the optical bands. For the galaxies UGC 1964, 3178, 4901, 6013 and 7933 from the observed set, the quality of the images was not good enough for photometric analysis. Table 2 contains a detailed log of the observations.
2.3. Near infrared imaging
We obtained images of all 40 sample galaxies in the near infrared band with the Observatorio Astronomico Nacional 2.1-m telescope at San Pedro Martir, Mexico. The CAMILA instrument (Cruz-Gonzalez et al. 1994), which hosts a NICMOS 3 detector of 256256 pixel format, was used in the imaging mode with the focal reducer configuration in all our observations. This results in a spatial resolution of pixel-1 and a total field of view of . Each observation consisted of a sequence of object and sky exposures, with the integration time of an individual exposure limited by the sky counts (or in some cases the nucleus), which was kept well below the non-linear regime of the detector. A typical image sequence consisted of 10 exposures, six on the object and four on the sky. The net exposure times were typically of 10 minutes. A series of twilight and night-sky images were taken for flat-fielding purposes. The observations were carried out in four runs in December 2000, March 2001, October 2001 and March 2002.
The sky conditions for both optical and near infrared observations were generally photometric and the seeing FWHM was in the range 1–2 on different nights. The average sky brightness was 21.14, 20.72, 20.18 and 12.27 magnitude arcsec-2 in the and bands, respectively. The sky brightness in the band also includes the background emitted by the warm optics.
| Galaxy | Date of Observation | Exposure Time (sec) | Seeing FWHM (arcsec) | |||||||
|---|---|---|---|---|---|---|---|---|---|---|
| UGC 00080 | 04-10-2002 | 10-10-2001 | 1200 | 360 | 540 | 750 | 2.24 | 2.07 | 2.03 | 1.56 |
| UGC 00491 | 05-10-2002 | 12-10-2001 | 1200 | 600 | 600 | 750 | 1.85 | 2.18 | 2.18 | 1.52 |
| UGC 00859 | 14-12-2001 | 09-10-2001 | 1200 | 600 | 600 | 900 | 2.41 | 2.81 | 2.64 | 1.76 |
| UGC 00926 | 05-10-2002 | 10-10-2001 | 1200 | 360 | 540 | 750 | 1.80 | 1.66 | 1.78 | 1.49 |
| UGC 01250 | 04-10-2002 | 10-10-2001 | 1200 | 600 | 600 | 900 | 2.31 | 2.10 | 2.01 | 1.48 |
| UGC 01823 | 14-12-2001 | 09-10-2001 | 1200 | 600 | 600 | 750 | 2.43 | 2.78 | 2.67 | 1.61 |
| UGC 01964 | 14-12-2001 | 09-10-2001 | 1200 | 600 | 600 | 900 | 2.10 | 2.09 | 2.18 | 1.60 |
| UGC 02039 | 05-10-2002 | 12-10-2001 | 1200 | 600 | 600 | 600 | 1.91 | 2.11 | 2.01 | 1.64 |
| UGC 02187 | … | 10-10-2001 | …. | … | … | 900 | … | … | … | 1.47 |
| UGC 02322 | … | 09-10-2001 | …. | … | … | 780 | … | … | … | 1.49 |
| UGC 03087 | 08-02-2002 | 24-03-2002 | 1200 | 540 | 540 | 480 | 2.16 | 1.98 | 2.14 | 2.06 |
| UGC 03178 | 09-02-2002 | 23-03-2002 | 1200 | 600 | 600 | 320 | 2.02 | 1.87 | 1.87 | 1.75 |
| UGC 03452 | 14-12-2001 | 16-12-2000 | 1200 | 600 | 600 | 600 | 2.55 | 2.76 | 2.63 | 1.58 |
| UGC 03536 | 08-02-2002 | 26-03-2002 | 1200 | 540 | 540 | 105 | 2.14 | 2.01 | 2.05 | 1.54 |
| UGC 03567 | 07-02-2002 | 28-02-2002 | 1200 | 600 | 600 | 750 | 2.17 | 1.97 | 2.04 | 1.92 |
| UGC 03642 | 09-02-2002 | 26-02-2002 | 1200 | 720 | 720 | 750 | 1.86 | 2.04 | 1.90 | 1.48 |
| UGC 03683 | 08-02-2002 | 23-03-2002 | 1200 | 600 | 600 | 750 | 2.26 | 2.26 | 1.97 | 2.07 |
| UGC 03699 | 05-10-2002 | 12-10-2001 | 600 | 360 | 540 | 750 | 2.58 | 2.58 | 2.59 | 1.89 |
| UGC 03792 | 14-12-2001 | 10-10-2001 | 1200 | 600 | 600 | 750 | 2.28 | 2.69 | 2.43 | 1.85 |
| UGC 03824 | 07-02-2002 | 26-03-2002 | 1800 | 600 | 600 | 105 | 2.13 | 2.13 | 2.24 | 1.66 |
| UGC 04347 | 14-12-2001 | 08-03-2001 | 1200 | 600 | 600 | 540 | 2.51 | 2.71 | 2.55 | 1.88 |
| UGC 04767 | 08-02-2002 | 24-03-2002 | 1200 | 600 | 600 | 600 | 2.42 | 2.07 | 2.08 | 1.92 |
| UGC 04901 | 09-02-2002 | 26-03-2002 | …. | 600 | 600 | 105 | … | 1.75 | 1.85 | 1.45 |
| UGC 05292 | … | 07-06-2001 | …. | … | … | 900 | … | … | … | 1.67 |
| UGC 06013 | 07-02-2002 | 08-02-2001 | …. | 600 | 600 | 840 | … | 2.50 | 2.07 | 1.64 |
| UGC 06389 | 08-02-2002 | 23-03-2002 | 1200 | 540 | 540 | 700 | 1.92 | 2.05 | 2.03 | 1.89 |
| UGC 06899 | 08-02-2002 | 23-03-2002 | 1200 | 600 | 600 | 840 | 1.96 | 1.97 | 1.94 | 1.27 |
| UGC 07142 | … | 23-03-2002 | …. | … | … | 450 | … | … | … | 2.07 |
| UGC 07473 | 09-02-2002 | 22-03-2002 | 900 | 450 | 270 | 260 | 2.12 | 2.13 | 2.08 | 1.43 |
| UGC 07880 | 09-02-2002 | 25-03-2002 | 1200 | 270 | 600 | 500 | 2.37 | 2.64 | 2.41 | 1.79 |
| UGC 07933 | 07-02-2002 | 08-03-2002 | …. | 540 | 540 | 840 | … | 2.47 | 2.26 | 1.79 |
| UGC 08675 | 08-02-2002 | 22-03-2002 | 1200 | 600 | 540 | 310 | 2.04 | 1.91 | 1.82 | 1.63 |
| UGC 09200 | … | 07-03-2001 | …. | … | … | 840 | … | … | … | 1.50 |
| UGC 09592 | … | 24-03-2002 | …. | … | …. | 600 | … | … | … | 1.92 |
| UGC 11178 | 04-10-2002 | 22-03-2002 | 900 | 600 | 600 | 240 | 2.15 | 2.06 | 2.20 | 1.39 |
| UGC 11356 | 05-10-2002 | 23-03-2002 | 1200 | 240 | 360 | 420 | 1.91 | 1.91 | 1.91 | 1.80 |
| UGC 11781 | 04-10-2002 | 09-10-2001 | 900 | 600 | 600 | 540 | 1.99 | 1.94 | 2.07 | 1.83 |
| UGC 11972 | 05-10-2002 | 10-10-2001 | 900 | 540 | 360 | 900 | 2.07 | 1.79 | 1.78 | 1.50 |
| UGC 12443 | 14-12-2001 | 12-10-2001 | 1200 | 600 | 600 | 900 | 2.87 | 2.89 | 2.92 | 1.56 |
| UGC 12655 | 04-10-2002 | 09-10-2001 | 1200 | 600 | 600 | 120 | 2.24 | 1.98 | 2.12 | 1.59 |
2.4. Data reduction
The basic data reduction for both the optical and near infrared images involved subtraction of the bias and sky frames, division by flat field frames, registration of the images to a common co-ordinate system and then stacking all the images of a given galaxy in each filter. Night to night variations of the optical bias frames were negligible, and hence bias frames of an entire run were stacked together using the median algorithm to form a master bias frame, which was then subtracted from all the other frames. Preparation of the optical flat fields followed the conventional technique, wherein bias subtracted flats were stacked and the resultant frame was normalized to its mean value to form a master flat in each filter. Bias subtracted images of the program galaxies were divided by the normalized flat field in the corresponding filter. The optical images suffered from a stray light problem that resulted in a gradient in the sky background, which roughly ran through one of the diagonals of the CCD chip. The gradient was found to be stable throughout each run and the mean counts scaled linearly with exposure time. After several experiments, we found that the best way to get rid of the gradient was to subtract a mean blank sky image from the data images. For this purpose, special blank fields were observed in each filter with exposure times matching the typical exposure times of the object frames. In the December 2001 run, three blank sky frames were used in each filter to prepare a median gradient image, while in the February 2002 run, six frames were used. The adopted procedure eliminated any gradient from the sky background.
For the images, a bias frame taken immediately before an object exposure was subtracted as part of the data acquisition. A master flat field for each night of observing was prepared as follows. The night-sky flats were first stacked and then subtracted from stacked twilight flats. The frames obtained in this fashion for each run were then combined and normalized to the mean value of the resultant frame to form a master flat. The sky frames of each sequence of observations were combined and the resultant image was subtracted from each of the object frames to get a sky-subtracted image. Flat fielding was done by dividing the sky subtracted images of the object by the normalized master flat. The resulting images were aligned to a common co-ordinate system using common stars in the frames and then combined using the median operation. Only good images (as defined in the CAMILA manual — see Cruz-Gonzalez et al. 1994) were used in the combination. The resulting combined images were aligned to corresponding images from the Digitized Sky Survey (DSS). As a final step of the reduction procedure, the mutually aligned optical images were aligned to the image coordinate system. The transformed star positions in the images agreed to within as judged from the coordinates of common stars.
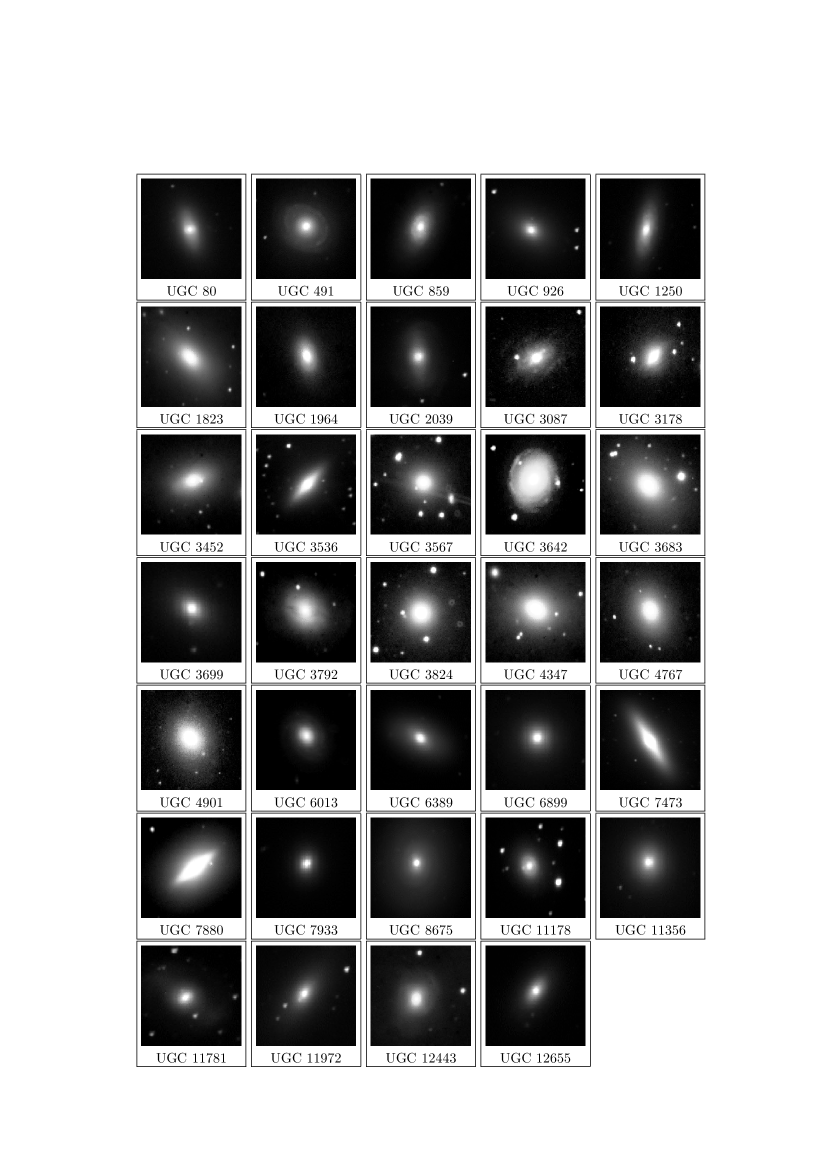
All image reductions were carried out using the Image Reduction and Analysis Facility (IRAF111IRAF is distributed by National Optical Astronomy Observatories, which are operated by the Association of Universities for Research in Astronomy, Inc., under cooperative agreement with the National Science Foundation.) and the Space Telescope Science Data Analysis System (STSDAS). The IRAF external package color was used to make color composite images, by combining images taken in three different bands, and or and . Gray-scale representation of these color composite images are shown in Fig. 1, where North is up and East is to the left.
2.5. Photometric calibration
Dipper Asterism stars in the M 67 field were observed to enable accurate photometric calibration of our optical observations. The stars in this field span a wide color range (), which includes the range of colors of the program galaxies, and hence are suitable for obtaining the transformation coefficients to the Cousins system defined by Bessell (1990). The transformation equations are
| (1) | |||||
| (2) | |||||
| (3) |
where and are standard magnitudes, and are extinction corrected instrumental magnitudes, and are the zero points and and the color coefficients in bands and respectively. Typical extinction coefficients for the observatory (0.20, 0.11 and 0.07 for and bands respectively) were used. Considering that the objects and the standard stars were observed as close to the meridian as possible, and in none of the cases the airmass exceeded 1.3, the error introduced due to possible variation in the extinction coefficients is less than 0.02 magnitude. Coefficients and were obtained by using the standard magnitudes of Chevalier & Ilovaisky (1991). Resulting values of and are given in Table 3. The relatively large color coefficient on the -band calibration is due to the non-standard nature of the filter used in the observations. The stability of the on a given night was checked using at least two other standard fields from the Landolt Selected Areas (Landolt 1992). The standard fields observed during our runs are SA 110232, PG 2336+004, Rubin 149 and PG 1323086. Overall, the zero points within a single night agreed to within 0.02 magnitudes. Night-to-night variation of the zero point was also within 0.02 magnitudes.
The detector and filter system combination that we used for the near infrared observations is identical to that used in the observations of standards by Hunt et al. (1998), and hence the color coefficients are expected to be negligibly small. We verified this by observing fields AS17 and AS36, which contain stars spanning a wide range of colors. We observed at least 2 standard fields each night, each field containing more than one star and some fields such as AS17 containing 5 stars. The -band zeropoints was obtained for each night as the mean of zero points from different stars and the average value is = .
For reddening corrections due to galactic extinction we adopt the values given by Schlegal et al. (1998) for each filter in the optical range. For near infrared observations we use the extinction law given by Rieke et al. (1985). When galaxies at different redshift are seen through a fixed passband, the collected light comes from different wavelength ranges in the rest frame of the respective galaxies. -correction is used to transform the rest frame magnitudes of each object to the passband of the filter. We have used an approximate form of the -correction, applicable for small , from Persson et al. (1979), Frei et al. (1994) and Fukugita et al. (1995). For the four filters we have, , , and respectively, where is the redshift of the galaxy. We have listed the combination of Galactic extinction and -correction for individual galaxies in Table 4.
| Filter | Zero point | Color coefficient |
|---|---|---|
| February 2002 | ||
| 22.880.03 | 0.0950.016 | |
| 23.490.02 | 0.0750.010 | |
| 22.450.05 | 0.4080.081 | |
| October 2002 | ||
| 22.600.03 | 0.0950.016 | |
| 23.210.04 | 0.0750.010 | |
| 22.150.03 | 0.4080.081 |
3. Analysis
3.1. Sky background
An accurate estimation of the sky background is a crucial step in surface photometric analysis, as even small uncertainties in determining the sky can lead to significant errors in the estimation of the galaxy surface brightness and color profiles, especially where the surface brightness becomes comparable to or less than the sky brightness. In those cases where the galaxy image is small enough that the frame contains portions of the sky unaffected by the galaxy, it is possible to estimate the sky using the “boxes method” (see Peletier et al. 1990a), where the background is estimated from a series of boxes chosen avoiding the sample galaxy, foreground stars and any other contaminating objects which may be present. We have used 20 boxes of size pixels near the corners of the CCD frame, and have adopted the mean of the median count in these boxes as the sky background. The rms dispersion over the mean of 20 boxes is found to be 0.6% of the mean in the , and bands and 0.2% of the mean in the band. When a galaxy is so large that the whole frame is affected by it, use of the boxes method leads to overestimation of the background. In such cases, the background can be determined by fitting a power-law of the form I(r) = sky + I(0) r-α to the outer parts of the surface brightness profile. Following Jorgensen et al. (1992) and Goudfrooij et al. (1994), we fit the function to the region of the profile with typically, separately for and 3, and use the mean of the respective best-fit constant values as the background. The error in the sky background estimation is taken to be half the difference of the sky values obtained for the two fits. We have used both the techniques for all galaxies in our sample, and find that in most cases the two methods agree within magnitude (i.e. 1 difference), because of the small size of the galaxies relative to the CCD frame. In the case of the galaxies UGC 4347, 7473, 7880, 8675 and UGC 11356, which cover most of the frame, the power-law fit provides a background which is magnitude (i.e. 10 difference) fainter than the boxes method, and we adopt the former as the background estimation. In the band images, the background is already subtracted from the many individual frames for each galaxy during the pre-processing stage (see ). However, to check for any residual background which may be present in processed frames used in the analysis, we have again applied the two techniques for the background estimation. We find that the two estimates agree very well ( magnitude, except in two cases where the agreement is within magnitude).
| Galaxy | Galactic extinction correction | |||||||
|---|---|---|---|---|---|---|---|---|
| UGC 00080 | 13.010.04 | 0.950.01 | 1.540.01 | 3.340.04 | 0.25 | 0.06 | 0.10 | 0.20 |
| UGC 00491 | 13.460.05 | 0.970.02 | 1.610.01 | 3.360.05 | 0.32 | 0.07 | 0.13 | 0.27 |
| UGC 00859 | 13.410.03 | 0.780.01 | 1.280.01 | 3.220.06 | 0.41 | 0.09 | 0.16 | 0.30 |
| UGC 00926 | 13.320.05 | 1.020.01 | 1.660.01 | 3.590.03 | 0.36 | 0.08 | 0.14 | 0.29 |
| UGC 01250 | 13.530.03 | 0.810.01 | 1.370.01 | 3.320.04 | 0.36 | 0.08 | 0.14 | 0.29 |
| UGC 01823 | 12.580.03 | 0.960.01 | 1.530.01 | 3.370.04 | 0.39 | 0.09 | 0.15 | 0.31 |
| UGC 02039 | 13.380.08 | 0.970.02 | 1.590.02 | 3.480.05 | 0.57 | 0.13 | 0.22 | 0.44 |
| UGC 03087 | 14.600.07 | 0.620.05 | 1.090.05 | 3.720.18 | 0.42 | 0.10 | 0.17 | 0.35 |
| UGC 03452 | 13.700.07 | 1.090.01 | 1.690.01 | 3.690.04 | 0.74 | 0.17 | 0.29 | 0.56 |
| UGC 03536 | 13.390.09 | 1.020.01 | 1.600.01 | 3.620.03 | 0.54 | 0.12 | 0.21 | 0.42 |
| UGC 03567 | 14.360.06 | 1.030.01 | 1.610.01 | 3.540.05 | 0.44 | 0.10 | 0.18 | 0.36 |
| UGC 03642 | 13.510.05 | 0.910.02 | 1.500.02 | 3.390.07 | 0.26 | 0.06 | 0.11 | 0.23 |
| UGC 03683 | 13.720.06 | 1.040.01 | 1.640.01 | 3.760.04 | 0.48 | 0.11 | 0.19 | 0.39 |
| UGC 03699 | 14.130.12 | 1.080.01 | 1.710.01 | 3.640.02 | 0.45 | 0.10 | 0.18 | 0.37 |
| UGC 03792 | 14.070.05 | 1.100.01 | 1.750.01 | 3.570.05 | 0.38 | 0.09 | 0.15 | 0.32 |
| UGC 03824 | 14.220.05 | 0.990.01 | 1.570.01 | 3.300.05 | 0.31 | 0.07 | 0.13 | 0.27 |
| UGC 04347 | 13.400.04 | 1.010.01 | 1.570.01 | 3.570.04 | 0.25 | 0.06 | 0.10 | 0.22 |
| UGC 04767 | 14.260.05 | 0.990.01 | 1.530.01 | 3.550.05 | 0.19 | 0.04 | 0.08 | 0.21 |
| UGC 06389 | 13.570.03 | 0.930.01 | 1.450.01 | 3.350.05 | 0.11 | 0.02 | 0.04 | 0.10 |
| UGC 06899 | 14.010.04 | 0.880.01 | 1.420.01 | 3.370.06 | 0.17 | 0.04 | 0.08 | 0.19 |
| UGC 07473 | 12.010.02 | 0.930.01 | 1.460.01 | 3.390.03 | 0.13 | 0.03 | 0.05 | 0.10 |
| UGC 07880 | 12.140.03 | 0.910.01 | 1.390.01 | 3.240.04 | 0.12 | 0.03 | 0.05 | 0.09 |
| UGC 08675 | 12.500.03 | 0.800.02 | 1.310.02 | 3.200.09 | 0.05 | 0.01 | 0.02 | 0.05 |
| UGC 11178 | 13.710.06 | 0.890.01 | 1.270.01 | 3.680.04 | 0.70 | 0.16 | 0.27 | 0.51 |
| UGC 11356 | 12.290.07 | 0.950.01 | 1.530.01 | 3.520.04 | 0.41 | 0.09 | 0.16 | 0.31 |
| UGC 11781 | 14.230.07 | 1.180.01 | 1.870.01 | 3.860.03 | 1.12 | 0.26 | 0.43 | 0.82 |
| UGC 11972 | 13.900.06 | 1.140.01 | 1.820.01 | 3.790.02 | 0.76 | 0.17 | 0.29 | 0.56 |
| UGC 12443 | 13.940.04 | 0.990.01 | 1.520.01 | 3.360.05 | 0.52 | 0.12 | 0.21 | 0.42 |
| UGC 12655 | 14.090.05 | 0.930.01 | 1.530.01 | 3.500.04 | 0.32 | 0.07 | 0.13 | 0.27 |
Note. — Column (2) gives the measured uncorrected total magnitude, column (3) to (5) give the measured , , and color indices, columns (6) to (9) give the combination of Galactic foreground extinction and correction.
3.2. Surface Photometry : Isophotal analysis
We have fitted ellipses to the isophotes in our and band images, using the task ELLIPSE in the STSDAS package available in IRAF. The fitting algorithm used is described in detail by Jedrzejewski (1987), and uses the intensity distribution along a trial ellipse, which can be expressed as a Fourier series
| (4) |
where is the ellipse eccentric anomaly, is the mean intensity along the ellipse and , are harmonic amplitudes.
The fitting was started a few arcseconds from the center of the galaxy image to minimize the effect of seeing, and stopped at the isophotes where the mean count becomes comparable to three times the error in the sky background. Stars, bad pixels etc. were identified in the first round of the fitting procedure and masked in the next run. All the parameters including the center of the ellipse were allowed to vary during the fitting. Variation in ellipse center was found to be small (), which provides a check on the accuracy of the sky subtraction. We repeated the fitting process with different modes of sampling and different starting major-axis lengths to check the stability of the extracted parameters.
The fitting procedure provides the mean intensity (surface brightness), the ellipticity and the position angle of the major-axis of the best fit ellipse, as a function of the semi-major axis length. The band surface brightness profile, and the and color profiles are shown for all the galaxies in Fig. 2. The profiles of the ellipticity, position angle and the Fourier coefficients respectively in the and bands for one galaxy (UGC 7880) are shown in Fig. 3. Tables and plots of surface brightness and color profiles as well as the profiles of the ellipticity, position angle and the Fourier coefficients respectively in the and bands for all the galaxies in the sample are available at http://iucaa.ernet.in/sudhan/s0.html. Some description of the profiles for individual galaxies is provided in the Appendix.
Color measurements of galaxies involving frames with different seeing full width at half maximum (FWHM) can lead to errors at small radii, and in particular within the seeing disk which has to be approached for measuring nuclear colors. These errors have been discussed by Franx et al. (1989), Peletier et al. (1990a) and Goudfrooij et al. (1994), who have derived a cutoff radius for color profiles and discarded colors measured inside this limit, which is usually . Idiart et al. (2002) used a method of equalization of the FWHMs to reduce error due to different seeing FWHM but this method is feasible only if the frames involved in color measurement are observed in quick succession. For our observations the seeing FWHM was nearly the same for the optical and bands, but significantly better in band as indicated by Table 2. We have therefore degraded the images to the mean FWHM of the optical band images for each galaxy. The color profiles shown in Fig. 2 were obtained using the degraded band images.
| Galaxy | r1 | r2 | |||
|---|---|---|---|---|---|
| (arcsec) | (arcsec) | ||||
| UGC 00080 | 3.40 | 28.05 | 0.090.01 | 0.140.04 | 0.220.02 |
| UGC 00491 | 3.40 | 51.00 | 0.250.03 | 0.260.03 | 0.250.00 |
| UGC 00859 | …. | ….. | ….. | ….. | ….. |
| UGC 00926 | 3.40 | 34.00 | 0.210.01 | 0.240.01 | 0.230.02 |
| UGC 01250 | …. | …. | ….. | ….. | 0.780.02 |
| UGC 01823 | 3.40 | 34.00 | 0.010.00 | 0.020.01 | 0.200.01 |
| UGC 02039 | 3.40 | 09.35 | 0.160.01 | 0.230.01 | 0.290.00 |
| UGC 03087 | …. | …. | ….. | ….. | ….. |
| UGC 03452 | 3.40 | 09.35 | 0.120.00 | 0.150.00 | 0.400.00 |
| UGC 03536 | 3.40 | 09.35 | 0.140.00 | 0.190.00 | 0.210.00 |
| UGC 03567 | 3.40 | 09.35 | 0.090.00 | 0.110.00 | 0.220.00 |
| UGC 03642 | 3.40 | 13.60 | 0.250.00 | 0.300.00 | 0.200.02 |
| UGC 03683 | 3.40 | 13.60 | 0.160.00 | 0.160.00 | 0.350.05 |
| UGC 03699 | 3.40 | 17.00 | 0.050.01 | 0.120.01 | 0.330.01 |
| UGC 03792 | 3.40 | 17.00 | 0.340.01 | 0.540.01 | 0.720.02 |
| UGC 03824 | 3.40 | 21.25 | 0.180.01 | 0.190.01 | 0.060.04 |
| UGC 04347 | 3.40 | 22.95 | 0.060.00 | 0.090.00 | 0.290.01 |
| UGC 04767 | 3.40 | 18.70 | 0.120.01 | 0.210.01 | 0.120.02 |
| UGC 06389 | 3.40 | 22.95 | 0.150.00 | 0.230.01 | 0.270.01 |
| UGC 06899 | 3.40 | 17.85 | 0.190.01 | 0.200.01 | 0.230.01 |
| UGC 07473 | 3.40 | 17.00 | 0.140.00 | 0.210.00 | 0.420.01 |
| UGC 07880 | 3.40 | 16.15 | 0.180.01 | 0.230.01 | 0.260.01 |
| UGC 08675 | 5.95 | 53.55 | 0.090.00 | 0.110.01 | 0.190.01 |
| UGC 11178 | 3.40 | 17.85 | 0.100.01 | 0.170.01 | 0.290.02 |
| UGC 11356 | 3.40 | 21.25 | 0.130.01 | 0.190.01 | 0.240.01 |
| UGC 11781 | 3.40 | 08.50 | 0.120.00 | 0.150.00 | 0.450.02 |
| UGC 11972 | 3.40 | 19.55 | 0.080.01 | 0.110.01 | 0.250.01 |
| UGC 12443 | 3.40 | 14.45 | 0.100.00 | 0.180.01 | 0.160.01 |
| UGC 12655 | 3.40 | 14.45 | 0.170.00 | 0.240.01 | 0.290.01 |
| Our sample | () | () | () |
| Ellipticals | () | () | () |
| (Peletier et al. 1990a & b) | |||
| Bulges of disk galaxies | … | () | … |
| (Peletier & Balcells 1997) |
Note. — The number of galaxies used to obtain the listed mean values are indicated in brackets. See 4 for details.
3.3. Integrated magnitudes
In this work we obtain the total magnitude of each galaxy in all the bands by integrating the light within the isophote corresponding to = 25 mag arcsec-2 in each band. To obtain the and colors, however, we integrate out only to the radius at which the error in is 0.1 mag arcsec-2 (the radius where the dotted horizontal line intersects the profile in Fig. 2). The colors obtained in this manner are consistent with those obtained using total magnitude as defined above, within the estimated errors. However, the errors on integrated colors obtained in this manner are substantially lower (typically 0.01 vs 0.04 in , 0.01 vs 0.04 in , and 0.05 vs 0.12 in colors). We also obtain total magnitudes measured to = 20 mag arcsec-2 in order to make comparison with 2MASS photometry. The measured total magnitudes and and colors along with the estimated errors for the 29 galaxies in the sample for which we have the necessary data are shown in Table 4. In Fig. 4 (left panel) we have compared our photometry with that in the literature. We have plotted (from bottom to top) the difference between (i-ii) our magnitude and color and those of RC3, (iii) our magnitude and that of UGC and (iv) our magnitude measured inside the isophote = 20 mag arcsec-2 and that of 2MASS, all against our magnitude. Agreement between our magnitude with that of RC3 is within the expected errors for all except two galaxies. Our total colors are systematically around 0.04 magnitude bluer than those of RC3. On the other hand, if we compare the color obtained by integrating only upto = 21 mag arcsec-2 (bulge color), the agreement between the colors is excellent. The agreement between our magnitude is also reasonably good. However it is important to note that 2MASS magnitudes correspond to = 20 mag arcsec-2 and considerable flux could be outside this radius e. g. our total magnitudes (measured inside the radius corresponding to = 25 mag arcsec-2) are systematically brighter by 0.4 magnitudes as compared to those of 2MASS. Hence magnitudes in the 2MASS catalog underestimate the total flux.
To check the internal consistency of our photometry we have plotted color-color diagrams as shown in Fig. 4 (right panel). In general, there is a good correlation between these independent color measurements and except for two galaxies UGC 3087 and UGC 11178, the estimated colors follow the sequence expected for early-type galaxies. Among these, UGC 3087 is clearly outside the 3 error estimation in all the three colors. This galaxy is known to harbor an active galactic nucleus, which clearly affects the color profiles in Fig. 2. Hence its colors are expected to depart significantly from the general correlation. UGC 11178, though is within the 2 error bar, is curious because it stands out in the plots, which are completely independent measurements. Further photometry would be required to understand the nature of this object. We exclude these two galaxies from further analysis.
3.4. Dust
We have used optical and band data to study the spatial distribution of dust. We have obtained extinction map in magnitude = , where is the observed image in same band, and is the smooth version of this image, obtained using the best fit ellipse parameters. Extinction map particularly helping in identifying non-axisymmetric structure. Color maps too are of help in identifying features with wavelength dependent intensity. We have noticed from the color and extinction maps that the lenticular galaxies UGC 3178, UGC 3536, UGC 3792, UGC 4347, UGC 7473 and UGC 7880 show clear evidence of the presence of dust in the form of lanes or patches. In all these cases there are differences in the ellipticity and position angle profiles, as well as in the higher order Fourier coefficients profiles, in the different bands. This indicates that such differences could be used as indicators of the possible presence of dust, even when the dust is not otherwise discernible (see e. g. Peletier et al. 1990a, Goudfrooij et al. 1994). The lenticular galaxy UGC 3792 has a very prominent dust lane along the major axis (see the appendix for details). We will present elsewhere a detailed study of the dust in our sample of galaxies.

![[Uncaptioned image]](/html/astro-ph/0411026/assets/x3.png)
FIG. 2 (continued)
![[Uncaptioned image]](/html/astro-ph/0411026/assets/x4.png)
FIG. 2 (continued)
![[Uncaptioned image]](/html/astro-ph/0411026/assets/x5.png)
FIG. 2 (continued)
![[Uncaptioned image]](/html/astro-ph/0411026/assets/x6.png)
FIG. 2 (continued)
4. Color Gradients
It is the usual practice to parameterize the color gradient over the galaxy as the slope , which is evaluated by making a straight line fit between an inner and an outer radius to the color profiles. The inner cutoff limit (r1) is taken to be 1.5 times the seeing FWHM (Peletier et al. 1990a), so that seeing effects are lessened. The outer limit (r2) is taken to be the point along the major axis at which the error on the mean surface brightness of the fitted ellipse reaches . It is seen from Fig. 2 that plots of color against the logarithm of the semi-major axis for most of our sample galaxies, have a reasonably linear form between the inner and outer cutoff. There are some cases (UGC 859, 1250 and 3087) for which the color profiles are non-linear between r1 and r2 because of the presence of a strong ring (UGC 859, 1250) or an AGN (UGC 3087), which makes reliable estimation of the color gradient is difficult. The and color gradients for our galaxies are given in Table 5.
The colors of the galaxies in our sample become bluer outwards, in keeping with the trend observed in ellipticals. The only exception to this is the positive gradient in the color of the galaxy UGC 4767. After excluding the galaxy UGC 3792 (which has a prominent dust lane), the mean logarithmic gradients in the and colors are , , magnitude per dex in radius respectively. A comparison of our mean color gradients with corresponding values from the literature for ellipticals and bulges of early-type spirals is shown in Table 6. The color gradients for lenticulars are more negative than the gradients for ellipticals, while the gradient for lenticulars is less negative than the corresponding gradient for bulges of early-type spirals. Our steeper color gradients could imply that the metallicity gradients are stronger in lenticulars and/or that there is more recent star formation in the outer parts of lenticulars as compared to those of ellipticals. Bothun & Gregg (1990) reported significant differences in the colors of bulges and disks in lenticulars which they interpret as being due to age difference, and not metallicity difference, between the bulge and disk components. The large rms error in the mean color gradient of our sample could be due to the different colors of the bulge and disk components and varying proportion of these in different lenticulars.
Correlation between different color gradients have been noted by various authors (Peletier et al. 1990a & b and Idiart et al. 2002 ) and have been used to derive information about the physical processes in galaxies. Such correlations are displayed in Fig. 5 for our sample. A clear correlation is seen between and gradients, with correlation coefficient 0.90 at a significance level better than 99.99 percent. Correlation between and gradient has been noticed for a sample of ellipticals by Peletier et al. (1990 a & b). From their data we obtain a correlation coefficient of 0.97 at a significance level better than 99.99 percent. The plot of against gradients shows large scatter, and we do not see any correlation of the type reported by Peletier et al. (1990b), but it should be noted that they used only 13 galaxies to derive the correlation. It is necessary to investigate how the separate bulge and disk color gradients affect the total color gradients and hence the correlation between them. We will address in the future these issues using a bulge-disk decomposition technique which will allow us to study the color distribution in these components separately.

5. Conclusions
In this paper we have presented detailed multicolor surface photometry performed with a CCD in the bands and a NICMOS detector in the band, for a sample of 34 lenticular galaxies from the UGC catalogue. The galaxies were chosen in an unbiased fashion from a subset of UGC lenticulars as explained in Section 2. We have obtained total integrated magnitudes and colors for all the galaxies using elliptical annuli from surface photometry, and find that these are in good agreement with values from the RC3 catalogue. Using isophotal analysis we have obtained radial profiles of the surface brightness, ellipticity, position angle, and higher order Fourier coefficients in all the bands. The profiles in the different bands are consistent with each other, and any differences can be attributed to the presence of dust and other features which produce wavelength dependent effects. We have used the surface brightness profiles to obtain color profiles, and logarithmic color gradients, and find that the gradients are negative, indicating that the colors of lenticulars become redder towards the center, as is the case with elliptical galaxies. We have shown that there is good correlation between and color gradients for lenticulars. Numerical profiles of all parameters that we have obtained from the isophotal analysis along with the color images are available at http://www.iucaa.ernet.in/sudhan/s0.html.
Our intention in obtaining the multiband data on lenticulars has been to study in detail these galaxies as a class, and to compare their properties with those of ellipticals and early type spirals. An important aspect of this study will be the decomposition of the lenticulars into bulge and disk components and the comparison of these separately with the bulges and disks in other types of galaxies where these components occur with varying degrees of prominence. We will use the results of the decomposition in a multiband study of the fundamental and photometric planes for lenticulars. We will also make a detailed study of the distribution of dust in lenticulars, particularly in those galaxies from our sample where there are prominent dust features and where we have multiband data at optical as well as near-infrared wavelengths.

UGC 3087 : Previous studies of UGC 3087 have mainly concentrated on its nuclear activity. It is a strong radio source (3C120) and the optical spectrum suggests a Seyfert 1 nucleus (Tadhunter et al. 1993). It has a faint optical jet in the same apparent direction as the radio jet. The optical jet is clearly visible in our images and distorts isophotal profiles in the inner region.
UGC 3178 : A dust feature is clearly visible in the band extinction map of this galaxy, and is also detectable from the isophotal analysis of and band images. The coefficient, position angle and ellipticity are different in and , which may be due to dust absorption in . Our and band images suffer from poor S/N.
UGC 3536 : This galaxy has a significant dusty disk and the coefficient is disky. The disk is also evident in the and color maps. There is a constant rise in ellipticity for semi-major axis length , beyond which there is a decrease, which could be because of the disk.
UGC 3642 : The images for this galaxy show some kind of spiral structure, but this is not evident in the extinction or color maps. The coefficient is positive in the outer regions.
UGC 3792 : This galaxy is classified as S0 in the UGC but as SA0/a in the RC3 catalogue, and has no previous reported photometric study. The galaxy has a prominent dust lane along the major axis which greatly affects the various profiles. This dust lane is most prominent in the band. The coefficient is positive in the outer region. There is a large color gradient in and , presumably because of the dust. A detailed study of this galaxy in the bands will be presented in a forthcoming paper.

UGC 4347 : Our and color and extinction maps of this galaxy reveal a large dust patch near the center. The profile is disky throughout the observed region. Forbes & Thomson (1992) have detected possible shells in this galaxy. The extinction images in all bands shows faint structures, which may be responsible for the non-zero values the of coefficient.
UGC 4767 : The position angle and ellipticity profile for this galaxy are different in the and bands for semi-major axis lengths , which could be because of a dust patch near the center of the galaxy. The various color maps also indicate the presence of the dust patch.
UGC 4901 : Our band image of this galaxy has poor S/N. The color maps in and show no features in the galaxy. The coefficient is positive towards the outer region, suggesting the presence of a faint disk.
UGC 7473 : This well studied edge-on lenticular galaxy forms a pair with NGC 4340. The surface brightness profile of this galaxy clearly indicates the presence of bulge and disk components. The Mg2 line strength profiles along the major and minor axis of the galaxy differ dramatically and convincingly indicate the presence bulge and disk components (Fisher, Franx & Illingworth 1996). Michard & Marchal (1993) described UGC 7473 as having a disk fully embedded in a spheroidal halo. A disk of rapidly rotating gas is present within the inner ; this is decoupled from the stellar component (Fisher 1997). A concentration of dust in the disk has been proposed by Michard & Poulain (2000). Our and color and extinction maps also reveal a clear inclined disk. The ellipticity rises from 0.2 to 0.61 over the observed region and the coefficient becomes significantly positive beyond , which reflects the presence of a strong disk.
UGC 7880 : This galaxy forms a pair with NGC 4635, with a separation of at . The ellipticity changes from 0.1 to 0.5 upto , and decreases beyond that. The coefficient is positive upto the point at which the ellipticity begins to decrease. This may be due to the presence of an inner disk, the presence of which is also indicated by the and color and extinction maps.
UGC 7933 : This galaxy is classified as S0 in the UGC, but as E1-2 in the RC3 catalogue. It forms a non-interacting pair with NGC 4670 at separation. The band image has poor S/N. The coefficient is positive towards the outer region. The color and extinction maps do not indicate any structure.
UGC 8675 : This is a little studied S0 galaxy hosting a Seyfert 1.5 nucleus, and has been classified as a SA0 galaxy in the RC3 catalogue. The isophotes of the galaxy are nearly circular and at the ellipticity becomes 0.15 which is consistent with the values obtained by De Robertis, Hayhoe & Yee (1998) and Pierre et al. (2000). A dust absorption pattern is seen near the nucleus in the and color and extinction maps. Pierre et al. (2000) have found from HST observations a U-shaped dust lane circling around the nucleus.
UGC 11178 : This galaxy has no previous reported photometric study. The extinction map show a ring like structure in all the bands. The ellipticity abruptly changes between 5 and , which could be because of the ring like structure. The coefficient is significantly positive upto . The color maps are featureless.
UGC 11356 : This is a face-on lenticular galaxy. A faint structure is apparent in extinction images in the optical bands near the center of the galaxy, but no features are obvious in the color maps.
UGC 11781 : This galaxy is classified as S0 in the UGC but as SAB in the RC3 catalogue. The presence of a bar is clear in the direct as well as extinction images. There is a dip in ellipticity profile at , where there is a change in the position angle profile as well. The coefficient is positive in this region.
UGC 12655 : The and color and extinction maps of this galaxy show a patchy region near the center of this galaxy. The coefficient is positive upto .
References
- (1) Abadi, M.G., Moore, B., & Bower, R.G. 1999, MNRAS, 308, 947
- (2) Bekki, K. 1998, ApJ, 504, 50
- (3) Bessell, M.S. 1990, PASP, 102, 1181
- (4) Bothun, G.D., & Gregg, M.D. 1990, ApJ, 350, 73
- (5) Chevalier, C., & Ilovaisky, S.A. 1991, A&AS, 90, 225
- (6) Cruz-Gonzalez, I., Carrasco, L., Ruiz, E., Salas, L., et al. 1994, RMxAA, 29, 197
- (7) De Robertis, M.M., Hayhoe, K., & Yee, H.K.C. 1998, ApJS, 115, 163
- (8) Fisher, D., Franx, M., & Illingworth, G. 1996, ApJ, 459, 110
- (9) Fisher, D. 1997, AJ, 113, 950
- (10) Forbes, D.A., & Thomson, R.C. 1992, MNRAS, 254, 723
- (11) Franx, M., Illingworth, G., & Heckman, T. 1989, AJ 98, 538
- (12) Frei, Z., & Gunn, J.E. 1994, AJ, 108, 1476
- (13) Fukugita, M., Shimasaku, K., & Ichikawa, T. 1995, PASP, 107, 945
- (14) Goudfrooij, P., Hansen, L., Jorgensen, H. E., et al. 1994, A&AS, 104, 179
- (15) Hubble, E.P. 1936, The Realm of the Nebulae, Yale Univ. Press, New Haven, reprinted by Dover Publ. Inc. New York (1958)
- (16) Hunt, L.K., Mannucci, F., Testi, L. et al. 1998, AJ, 115, 2594
- (17) Idiart, T.P., Michard, R., & de Freitas Pacheco, J.A. 2002, A&A, 383, 30
- (18) Jedrzejewski, R. I. 1987, MNRAS, 226, 747
- (19) Jorgensen, I., Franx, M., & Kjaergaard, P. 1992, A&AS, 95, 489
- (20) Jorgensen, I., Franx, M., & Kjaergaard, P. 1996, MNRAS, 280,167
- (21) Khosroshahi, H.G., Wadadekar, Y., & Kembhavi, A.K. 2000a, ApJ, 533, 162
- (22) Khosroshahi, H.G., Wadadekar, Y., Kembhavi, A.K., & Mobasher, B. 2000b, ApJ, 531, L103
- (23) Knapp, G.R., Guhathakurta, P., Kim, Dong-Woo, & Jura, M.A. 1989, ApJS, 70, 329
- (24) Landolt, A.U. 1992, AJ, 104, 340
- (25) Michard, R., & Marchal, J. 1993, A&AS, 98, 29
- (26) Michard, R. 2000, A&A, 369, 85
- (27) Michard, R., & Poulain, P. 2000, A&AS, 141, 1
- (28) Peletier, R.F., Davies, R.L., & Illingworth, G.D. 1990a, AJ, 100, 1091
- (29) Peletier, R.F., Valentijn, E.A., & Jameson, R.F. 1990b, A&A, 233, 62
- (30) Peletier, R.F., & Balcells, M. 1996, AJ, 111, 2238
- (31) Peletier, R.F., & Balcells, M. 1997, NewA, 1, 349
- (32) Persson, S.E., Frogel, J.A., & Aaronson, M. 1979, ApJS 39, 61
- (33) Pierre, F., Andrew, S.W., & Mulchaey, J. 2000, ApJS,128, 139
- (34) Pogge, R.W., & Eskridge, P.B. 1993, AJ, 106, 1405
- (35) Rieke, G.H. & Lebofsky, M.J. 1985, ApJ, 288, 618
- (36) Schlegel, D.J., Finkbeiner, D.P. & Davis, M. 1998, ApJ, 500, 525
- (37) Tadhunter, C.N., Morganti, R., di Serego-Alighieri, S., Fosbury, R.A.E., & Danziger, I.J. 1993, MNRAS, 263, 999
- (38) van den Bergh, S. 1994, AJ, 107, 153
- (39) Wadadekar, Y., Robbason, B. & Kembhavi, A.K. 1999, AJ, 117, 1219