Evolution of Cold Circumstellar Dust Around Solar-Type Stars
Abstract
We present submillimeter (CSO 350µm) and millimeter (SEST 1.2 mm, OVRO 3 mm) photometry for 125 solar-type stars from the FEPS Spitzer Legacy program that have masses between 0.5 and 2.0 M⊙ and ages from 3 Myr to 3 Gyr. Continuum emission was detected toward four stars with a signal to noise ratio : the classical T Tauri stars RX J1842.93532, RX J1852.33700, and PDS 66 with SEST, and the debris disk system HD 107146 with OVRO. RX J1842.93532 and RX J1852.33700 are located in projection nearby the R CrA molecular cloud with estimated ages of 10 Myr (Neuhäuser et al., 2000), while PDS 66 is a probable member of the 20 Myr old Lower Centaurus-Crux subgroup of the Scorpius-Centaurus OB association (Mamajek et al., 2004). The continuum emission toward these three sources is unresolved at the 24′′ SEST resolution and likely originates from circumstellar accretion disks, each with estimated dust masses of 5 M⊙. Analysis of the visibility data toward HD 107146 (age 80-200 Myr) indicates that the 3 mm continuum emission is centered on the star within the astrometric uncertainties and resolved with a gaussian-fit FWHM size of , or 185 AU120 AU. The results from our continuum survey are combined with published observations to quantify the evolution of dust mass with time by comparing the mass distributions for samples with different stellar ages. The frequency distribution of circumstellar dust masses around solar-type stars in the Taurus molecular cloud (age 2 Myr) is distinguished from that around 3-10 Myr and 10-30 Myr old stars at a significance level of 1.5 and 3 respectively. These results suggest a decrease in the mass of dust contained in small dust grains and/or changes in the grain properties by stellar ages of 10-30 Myr, consistent with previous conclusions. Further observations are needed to determine if the evolution in the amount of cold dust occurs on even shorter time scales.
1 Introduction
Most young ( 1 Myr) solar mass stars are surrounded by circumstellar disks (Strom et al., 1989). These disks have masses (Beckwith et al., 1990) and sizes (McCaughrean & O’Dell, 1996; Dutrey et al., 1996) comparable to that expected for the primitive solar nebula, and are thus the suspected sites for the formation of planetary systems. Indeed, the increasing number of planets discovered around main-sequence stars (Marcy, Cochran, & Mayor, 2000) strongly supports the notion that planet formation in circumstellar disks is a common occurrence. The physics of how planets form within circumstellar disks is unclear though and remains the subject of ongoing investigation (cf. Pollack et al. 1996 and Boss 2001). Since the direct detection of planets around young stars is challenging for current instrumentation, observational constraints on the planet formation process are frequently inferred from the evolutionary time scales of circumstellar disks.
The evolution of circumstellar disks has been studied primarily in the infrared by identifying stars that exhibit emission in excess of that expected from the stellar photosphere. Near-infrared band photometry of nearby star-forming regions (Strom et al., 1989; Haisch, Lada, & Lada, 2001), which probes the inner 0.1 AU of the disk around solar-type stars, suggest that the percentage of stars with 2-4µm excesses is 80% for 1 Myr stars and diminishes to 50% by an age of 3 Myr. The inner disk does persist to relatively old ages in at least some stars, as evidenced by the high fraction of stars (60%) with -band excesses in the 5-9 Myr Cha cluster (Lyo et al., 2003), the -band excess in the 7-17 Myr star PDS 66 (Mamajek, Meyer, & Liebert, 2002; Mamajek et al., 2004), and the disk accretion signatures in at least two members of the 10 Myr old TW Hydra association (Muzerolle et al., 2000). By ages of 10-15 Myr, the inner disk as traced by -band photometric excesses has diminished to nearly zero (Mamajek, Meyer, & Liebert 2002). Similarly, 10µm observations show that 20% of the stars in the TW Hydra association (Jayawardhana et al., 1999; Weinberger et al., 2004) exhibit evidence for dust between 0.1 AU and 1 AU, with the excess fraction falling to approximately 0 by 30 Myr in at least the Tucana-Horologium association (Mamajek et al., 2004). Far-infrared observations obtained with IRAS and ISO suggest disk evolution from 1-10 AU on similar time scales (Meyer & Beckwith, 2000), but are inconclusive on whether subsequent evolution is continuous (Spangler et al., 2001) or discrete (Habing et al., 1999, 2001; Decin et al., 2003).
Millimeter-wavelength continuum observations provide a complimentary picture of disk evolution by probing colder disk material that is not detectable in the near- and mid-infrared. Continuum surveys of stars in the Taurus (Beckwith et al. 1990, Osterloh & Beckwith 1995; see also Motte & André 2001), Oph (André & Montmerle 1994; see also Motte, André, & Neri 1998, Nürnberger et al. 1998, Johnstone et al. 2000), and Chamaeleon I&II (Henning et al., 1993) molecular clouds suggest that the median disk mass (including gas and dust components) around low-mass stars is 0.005 M⊙ for stellar ages of 1 Myr. Moreover, Beckwith et al. (1990) found no evidence of temporal evolution in the mass of cold, small ( 1 mm) dust particles between ages of 0.1 and 10 Myr. Zuckerman & Becklin (1993) conducted a continuum survey of stars in the Pleiades and Ursa Major and found that the dust masses decrease by at least two orders of magnitudes by an age of 300 Myr. Similar surveys of Lindroos binaries (A- and B- stars with ages of 10-200 Myr; see Jewitt 1994, Gahm et al. 1994, Wyatt, Dent, & Greaves 2004) and a limited sample of stars in the Pic Moving Group and Local Association (Liu et al., 2004) suggest that few massive disks ( 0.01 M⊙) survive beyond an age of 10 Myr.
Despite the substantial progress made by recent observations, our empirical understanding of the evolution of cold circumstellar dust remains incomplete. Analysis of the stellar ages in the Taurus molecular cloud (from which the Beckwith et al. 1990 sample was drawn) suggest that the apparent age spread can be attributed predominantly to observational uncertainties (Hartmann, 2001), and, therefore, studies of Taurus alone are insufficient to establish the time scales for disk evolution. The youngest nearby ( 200 pc) open clusters (e.g. Pleiades, IC 2602, Per) are frequently used to characterize the disk properties at ages of 50-120 Myr. Few stars have been studied at intermediate ages (3-30 Myr) though when planets of all masses are thought to be in their final assemblage stages. Lindroos binaries provide a few examples of these intermediate-age stars, but since these are systems where by definition the primary is an intermediate-mass star, they may not share the evolutionary history of “typical” solar-type stars.
In recent years, an increasing number of intermediate-aged, solar-type stars have been identified in nearby stellar associations and moving groups (see, e.g., Mamajek, Lawson, & Feigelson 2000; Neuhäuser et al. 2000; Mamajek, Meyer, & Liebert 2002; Wichmann, Schmitt, & Hubrig 2003; Song, Zuckerman, & Bessell 2003). Some of these stars are being observed by the Spitzer Legacy program “Formation and Evolution of Planetary Systems” (or FEPS; Meyer et al. 2004) as part of a photometric and spectroscopic survey of 325 solar-type stars. The mid- and far-infrared Spitzer observations will sensitive to relatively warm dust, and to survey for potentially cold dust around these stars, we conducted a millimeter-wavelength continuum survey of 125 stars in the FEPS sample. Figure 1 shows the sensitivity to dust mass of our millimeter continuum survey relative to that of IRAS and the upcoming FEPS Spitzer survey. As shown in this Figure, our observations are more sensitive to dust mass than IRAS 60 and 100µm data for dust colder than 25 K, and more sensitive than Spitzer 24µm, 70µm, and 160µm observations for dust colder than 30 K, 15 K, and 10 K respectively. (Note, however, that the sensitivity limits for IRAS 100µm and Spitzer 70/160 160µm observations depend on the local background level from cirrus.) Accordingly, we have initiated a millimeter-wavelength continuum survey of a substantial fraction of the FEPS sample. The primary advantage of these observations over previous studies is that they sample a large number of stars (125) spanning a small range of stellar masses (0.5-2 M⊙) to specifically address the time scale for the evolution of cold circumstellar dust around solar-type stars.
In §2, we summarize the sample selection and properties of the FEPS stars observed for this study. The telescopes and instruments used for these observations are described in §3, along with the data reduction procedures and the measured continuum fluxes. §4 summarizes the properties of the sources with detected millimeter continuum emission, and an analysis of the entire survey is presented in §5. The implications for disk evolution are discussed in §6, and §7 summarizes our conclusions.
2 Stellar Sample
The sources observed for this study were taken from the target list for the FEPS Spitzer Legacy program (Meyer et al., 2004), which consists of 325 stars with stellar masses between 0.5 M⊙ and 2 M⊙ and ages spanning from 3 Myr to 3 Gyr. The FEPS source list includes field stars, stellar clusters (Pleiades, Alpha Per, Hyades, and IC 2602), and members of the Scorpius-Centaurus OB association. Ages were assigned based on a number of considerations, including: i) pre-main-sequence evolutionary tracks for stars with ages 10 Myr, ii) the observed lithium equivalent width, iii) x-ray activity, iv) the strength of the Ca II H&K emission for a volume limited sample of solar-type stars ( 50 pc), and v) the association of stars with clusters or star-forming regions of known age. Distances were derived based upon Hipparcos parallaxes for nearby stars, kinematic distances for stars associated with young moving groups and associations (Mamajek et al. 2004, in preparation), and adopting nominal cluster distances for older clusters. Priority was placed on observing the youngest ( 300 Myr) and closest ( 100 pc) sources within the FEPS program.
Table 1 lists the 138 sources observed for this study along with the adopted distances. We emphasize that the adopted distances and especially the assigned ages are preliminary, and a detailed analysis of the properties of the FEPS sample is forthcoming (Hillenbrand et al. 2004, in preparation). While all of these sources were initially in the FEPS target list, 13 sources were subsequently dropped due to time limitations or because ancillary ground-based observations cast doubt on the preliminary assigned age. These 13 stars are listed separately in Table 1 for completeness and are otherwise not analyzed in this paper. None of the dropped sources were detected in the millimeter continuum with a signal to noise ratio . The 125 observed sources that are still included in the FEPS program are grouped into age bins that span a factor of 3 as indicated in Table 1. The sources observed here include 14 stars between the ages of 3 and 10 Myr, 11 with ages of 10-30 Myr, 39 with ages of 30-100 Myr, 39 with ages of 100-300 Myr, 8 with ages of 300-1000 Myr, and 16 with ages of 1-3 Gyr. Submillimeter continuum photometry has been previously presented for five FEPS sources observed here: Williams et al. (2004) detected 450µm and 850µm emission toward HD 107146, and and Liu et al. (2004) report upper limits to the 850µm flux toward HD 35850, HD 199143, HD 129333, and HD 77407. In addition, 13 sources, as indicated in Table 1, have a excess above the photospheric flux in one or more of the bands as determined by fitting a Kurucz model atmosphere to compiled optical and near-infrared photometry.
3 Observations and Data Reduction
3.1 OVRO
Millimeter continuum observations of 57 stars were obtained in the summer of 2002 and the spring and summer of 2003 using the Owens Valley Radio Observatory (OVRO) millimeter-wave interferometer. The array contains six 10.4 meter antennas, but during the summer months, only 3-5 antennas were typically operational at any one time. Data were obtained in either the OVRO “compact” or “low” configurations that provided a FWHM angular resolution of 5-10′′. Continuum data were recorded simultaneously in four, 1 GHz wide continuum channels, and starting in the summer of 2003, low spectral resolution (32.5 MHz) data were also recorded using the COBRA spectrometer. At the time of the observations, 7 of the 8 COBRA modules were functional, providing 7 GHz out of a possible maximum 8 GHz of bandwidth. When available, the COBRA spectral channels were averaged in 500 MHz intervals and used in place of the 1 GHz continuum data during the data analysis. The majority of the observations were obtained at a mean frequency of 101 GHz as a compromise between achieving low system temperatures and atmospheric phase stability (favoring low frequencies) and dust emissivity (favoring high frequencies). Seven sources were observed at a mean frequency of 112 GHz as part of a survey for 12CO(J=1–0) molecular line emission; only the continuum data are presented here. A phase and amplitude calibrator was observed every 15 minutes, and the data were flux calibrated by observing Neptune or Uranus.
The OVRO data were reduced using MIR, an IDL-based data reduction package for millimeter-wave interferometry developed by N. Scoville and J. Carpenter. Observations were repeated as necessary to achieve a typical RMS noise level of 0.5-1.0 mJy beam-1. To assess the calibration uncertainties, the dispersion of the measured fluxes was computed for each calibrator observed on 5 or more days within a 1 week time period (to reduce the likelihood of intrinsic source variability). Out of 161 calibrator sequences meeting these criteria, the median dispersion is 5%, and 96% of the sequences have a dispersion of less than 10%. We adopt 5% as the “typical” 1 calibration uncertainty. Source fluxes were computed through least squares fitting of the visibility data assuming that the emission originates from a point source at the phase center. The reduced chi-square from the fit was typically 1.8, where nominally it should be 1 if the assigned uncertainties to the data points are correct and the point source model is an adequate representation of the continuum emission. We assumed that the large value of the reduced chi-square indicates that the uncertainties in the visibility data have been underestimated, and accordingly we increased the uncertainties in the derived fluxes by the square root of the reduced chi-square value. Images were produced for each source using MIRIAD and visually inspected to search for continuum detections that may be offset from the phase center. None of the sources in this initial survey were detected at a signal to noise ratio 3.
During the course of this program, Williams et al. (2004) detected 450µm and 850µm continuum emission from HD 107146. This source was a non-detection in our original survey, but the submillimeter observations motivated us to obtain more sensitive, higher resolution 101 GHz data. These additional observations were obtained between 2003 April and 2004 May. We used 3C273 as the phase and gain calibrator, which is located at an angular separation of 14.7∘ from HD 107146. Beginning in 2003 August, the radio source J1215+169, located 1.0∘ from HD 107146, was monitored after every 2 integrations on HD 107146 as a test of the accuracy of the phase calibration derived from 3C273. For most of these observations we were not able to observe a planet to directly flux calibrate the data, and instead we used 3C273 as a secondary flux calibrator. Since the millimeter flux from 3C273 is frequency dependent and time variable (see, e.g., Steppe et al. 1993), we determined the flux history of 3C273 using observations obtained by other programs at OVRO. Using 201 OVRO “tracks” in which both 3C273 and a planet (either Neptune or Uranus) were observed in the time frame of the HD 107146 observations, we found that the flux from 3C273 varied in time between 7 and 10 Jy at observed frequencies of 86 to 115 GHz. We determined that the flux from 3C273 varied as by fitting a power law to a portion of the data where the 3C273 flux was 10 Jy and appeared to have low variability. While the spectral index can vary between 0.3 and 1.5 during 3C273 flare events, our derived spectral index as well as the absolute flux level suggests 3C273 was largely in a quiescent phase for the time period of our observations (Robson et al., 1993). Therefore, we assumed that the spectral index was constant. After scaling the observed fluxes to 101 GHz, a median boxcar curve, with a width corresponding to 15 observed data points, was fitted through the resulting time series data to estimate the flux for 3C273 for any given time. The residuals from the fitted curve have a RMS of 6%, which we adopt as the calibration uncertainty in the measured fluxes for 3C273 and consequently HD 107146. The HD107146 data were reduced in MIR, and images were produced and cleaned in MIRIAD using a Brigg’s robust weighting parameter (Briggs, 1995) of 0. The resulting image had a FWHM synthesized beam of and a RMS noise of 0.15 mJy beam-1. Analysis of the HD 107146 data is presented in §4.4.
3.2 SEST
Continuum observations at 1.2 mm were obtained for 89 stars using the 37-element SIMBA bolometer camera on the 15 m Swedish-ESO Submillimetre Telescope (SEST) in 2001 November, 2002 June, and 2002 November. The instantaneous field of view of SIMBA is with 44″ separation between the bolometer channels. The FWHM beam size of the observations is 24″. Fully sampled maps were generated by dithering the array to produce images with 8′′ sampling. The telescope pointing was checked before and after each map, and the pointing offsets were repeatable to within 2′′ in both azimuth and elevation in most cases. However, for the observations of both RX J1852.33700 and MML 1 in June 2002, the pointing offsets derived for the start and end of the maps differed by 40′′ in elevation. A continuum source was detected in the RX J1852.33700 map (see §3.4 and §4.3) that was offset 40′′ from the pointing center. We assumed that the 40′′ angular offset was due to the pointing error and associate this continuum source with RX J1852.33700. The atmospheric opacity at 1.2 mm as measured from sky dips ranged from 0.12 to 0.20 in 2002 June and 0.25 to 0.35 in 2001 November and 2002 November. Flux calibration was derived from maps of Uranus and Neptune which were obtained each night. The estimate 1 calibration uncertainty is 10% based on repeated observations of the planets. Source fluxes were measured using a beam-weighted aperture (Naylor, 1998) of 16′′ in radius with a background annulus that extended from 30′′ to 120′′. If no source was apparent in the images, the aperture was centered on the stellar position. The typical RMS noise measured in the background annulus varied from 8 mJy beam-1 for the 2002 June observations to 17 mJy beam-1 for the 2001 November and 2002 November observations.
3.3 CSO
Submillimeter continuum observations at µm were obtained for 6 stars using the SHARC bolometer camera (Hunter, Benford, & Serabyn, 1996) on the 10.4 m telescope of the Caltech Submillimeter Observatory (CSO). The observations were conducted during the second half of the night on 2001 October 1-3. SHARC contains a 24 pixel monolithic silicon bolometer array, of which 19 pixels were operational at the time of the observations. Each pixel subtends on the sky. The FWHM beam size of CSO telescope at the 350µm is 9′′. Data were obtained in point-source mode by chopping 1′ in azimuth, with on-source integration times ranging from 12 to 36 minutes. Zenith opacities at 225 GHz as measured by the CSO tau meter ranged between 0.04 and 0.09. The observations were flux calibrated with regular observations of Saturn, with an estimated 1 calibration uncertainty of 20% based on the repeated observations. Pointing was checked every 1-2 hours, where it was discovered that there was an elevation pointing drift as a function of elevation for the first two nights before the pointing model was updated on the last night. During reduction, the data were combined using a shift-and-add procedure to account for the drift. The RMS noise in the calibrated, coadded data ranged from 37 to 57 mJy beam-1.
3.4 Photometry
The measured millimeter and submillimeter fluxes for all observed sources are summarized in Table 1. With the exception of HD 107146, which was resolved (see §4.4), the fluxes are for point sources at the stellar position. These flux measurements then do not account for any extended continuum emission. For cases where large pointing uncertainties were present and the stellar position in the image is uncertain by more than one beam width, the table lists the flux as the 3 upper limit, which was computed as 3 times the RMS noise in the image. The flux uncertainties listed in Table 1 represent the internal uncertainties only and do not include the calibration uncertainties. Figure 2 presents a histogram of the ratio of observed flux to the internal flux uncertainty. The dashed curve shows the expected frequency distribution of this ratio for gaussian noise; i.e. a normal distribution centered on zero with unit dispersion. Evidently gaussian noise is an adequate representation of the observed flux distribution for most sources. Four sources were detected with a signal to noise ratio : HD 107146 at 3.0 mm with the OVRO interferometer, and PDS 66, RX J1842.93532, and RX J1852.33700 at 1.2 mm with the SEST bolometer. As discussed in §4.4, the emission toward HD 107146 is resolved with OVRO. For the 3 sources detected with SEST, the observed FWHM of the continuum emission, measured by fitting a gaussian to the emission radial profile using the IMEXAMINE task in IRAF, varies between 24-28′′. Given that the FWHM beam size of the SEST telescope is 24′′, the observed emission is consistent with a point source at this angular resolution.
4 Detected Millimeter Continuum Sources
Figures 3–5 show the observed spectral energy distribution (SED) for the 3 stars detected with SEST. The SED for HD 107146 is presented and analyzed by Williams et al. (2004) and is not shown here. In addition to the millimeter-wavelength continuum photometry, the SEDs include photometry from Tycho-2 (Høg et al., 2000), 2MASS, IRAS, and for two sources (Neuhäuser et al., 2000). Also shown in these figures is the best fit Kurucz model atmosphere to the optical and near-infrared photometry. The best-fit model was obtained by minimizing the chi-square between the model magnitudes and observed and photometry, where the free parameters in the fit are the overall normalization constant, the effective temperature, and visual extinction. Model magnitudes were computed by convolving the Kurucz model with the appropriate filter transmission as described in Cohen et al. (2003a,b) and references therein. Each of these sources exhibits excess emission in the IRAS bands, and both PDS 66 and RX J1842.93532 may have excess emission at wavelengths as short as 2.2µm. An analysis of the SEDs is not presented here since the FEPS project will soon have Spitzer spectrophotometry from 3.6 to 160µm for these sources that will permit significantly more detailed circumstellar disk models to be constructed than is possible with the limited data available now. The following discussion briefly summarizes the properties of the four sources detected in the millimeter continuum.
4.1 PDS 66
PDS 66 (also known as Tycho 9246 971 1, Hen 3-892, IRAS 13185-6922, and MML 34) was first identified by Gregorio-Hetem et al. (1992) as a classical T Tauri star (CTTS) by virtue of having a far-infrared excess detected by IRAS, strong H emission, and deep lithium absorption at 6707Å. Mamajek, Meyer, & Liebert (2002) identified the star as a likely proper motion member of the Lower Centaurus-Crux subgroup of the Scorpius-Centaurus OB association and derived the stellar parameters, which we adopt here. The star has a spectral type of K1 IVe, and is distinguished as the only known CTTS in a sample of 110 stars in the Lower Centaurus-Crux and Upper Centaurus-Lupus subgroups. Depending on the pre-main-sequence evolutionary tracks used to estimate the stellar properties, the stellar age and mass are 7-17 Myr and 1.1-1.2 M⊙, respectively. The mean age of the Lower Centaurus-Crux subgroup is 17-23 Myr. We adopt the secular parallax distance of 86 pc as derived by Mamajek, Meyer, & Liebert (2002). The observed millimeter continuum flux corresponds to a dust mass (see §6) of M⊙, which is comparable to the circumstellar disk masses found around young stars in the Taurus (Beckwith et al., 1990; Osterloh & Beckwith, 1995) and Oph (André & Montmerle, 1994; Motte, André, & Neri, 1998) molecular clouds. Thus PDS 66 appears to be a rare example of a relatively old ( 10 Myr) CTTS, and the millimeter continuum emission likely originates from a circumstellar accretion disk.
4.2 RX J1842.93532
As described in Neuhäuser et al. (2000), the x-ray source RX J1842.03532 was detected in the ROSAT All-sky survey and subsequently associated with the star Hen 3-1722 and IRAS 183963535. The star has a K2 spectral type, exhibits strong H in emission (see also Henize 1976, Beers et al. 1996), has a deep lithium absorption feature, and contains excess IRAS far-infrared emission. Based on these characteristics the star has been classified as a CTTS. RX J1842.03532 is located at an angular separation of 3.6∘ from the RCrA molecular cloud. The observed radial velocities and UCAC2 proper motions for the star agree to within 1 km s-1 of the values predicted for RCrA members at their positions (using the space motion vector for the RCrA group from Mamajek & Feigelson 2001; E.Mamajek, private communication). The secular parallax distance is statistically consistent with the best available distance of 130 pc to the RCrA association (Casey et al., 1998). For this distance, Neuhäuser et al. (2000) estimate a stellar age of 10 Myr and a stellar mass of 1.2 M⊙ based on pre-main-sequence evolutionary tracks. The observed millimeter continuum flux implies a dust mass (see §6) of M⊙. Given that the star has characteristics similar to that of a CTTS, the dust emission likely originates from an accretion disk.
4.3 RX J1852.33700
As described in Neuhäuser et al. (2000), the x-ray source RX J1852.33700 was detected in the ROSAT All-sky survey and associated with a stellar counterpart that has strong H emission and far-infrared emission as detected by IRAS (IRAS 184893703). The star has a K7 spectral type and has been classified as a CTTS. It is located at an angular separation of 1∘ from the RCrA molecular cloud, and similar to RX J1842.93532, the observed radial velocities and UCAC2 proper motions agree to within 1 km s-1 to the predicted values for RCrA members (E. Mamajek, private communication). For the adopted distance of 130 pc to RCrA (Casey et al., 1998), the estimated stellar age and mass from pre-main-sequence evolutionary tracks are 10 Myr and 1.1 M⊙ respectively (Neuhäuser et al., 2000). The observed millimeter continuum flux implies a dust mass (see §6) of M⊙. Since the star has characteristics similar to that of a CTTS, the dust emission likely originates from a circumstellar accretion disk.
4.4 HD 107146
HD 107146 has a G2 V spectral type with an Hipparcos distance estimate of 29 pc. The star has a number of age indicators (lithium equivalent width, x-ray luminosity, space motions similar to Pleiades moving group) which in aggregate suggest an age of 80-200 Myr (see discussion in Williams et al. 2004). Silverstone (2000) and Metchev, Hillenbrand, & Meyer (2004) noted that the source contains an IRAS far infrared excess at 60µm and 100µm. Williams et al. (2004) further detected continuum emission at 450µm and 850µm that firmly established that the source is surrounded by circumstellar dust, most likely originating from a debris disk. Their analysis of the SED suggested that the disk contains an inner hole with a radius 31 AU.
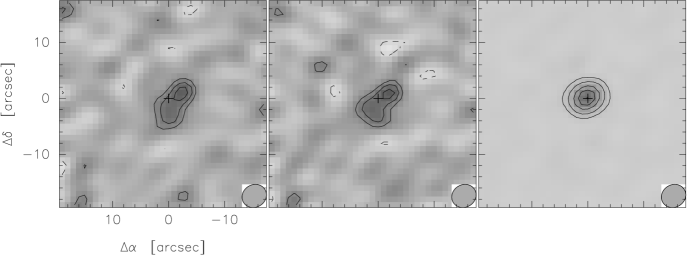
Figure 6 presents the OVRO 3 mm map of HD 107146. The left panel shows the contour map of the continuum emission obtained by combining all available data. The middle panel displays the continuum image for a subset of the data when J1215+169 was monitored as a test of the phase/gain solution derived from 3C273, and the right panel shows the corresponding image of J1215+169. The observed peak flux in the HD 107146 image is mJy beam-1 in a beam. The integrated flux in a 8′′ radius aperture, measured in a naturally-weighted map ( beam size) to optimize the signal to noise, is mJy. (The uncertainties in the peak and integrated fluxes do not include the 6% calibration uncertainty; see §3.) Williams et al. (2004) fitted the excess infrared and submillimeter emission with a graybody to derive a dust temperature of 514 K, and estimated the frequency dependence of the submillimeter emission to be in the Rayleigh-Jeans limit. Based on the observed 850µm flux of mJy, the expected 3 mm flux for these model parameters is mJy. The difference between the observed and expected 3 mm flux, including calibration uncertainties, is mJy, or a 2.0 difference. Thus the observed OVRO 3 mm flux is marginally consistent with that expected from the graybody extrapolation of the submillimeter emission.
The centroid position of the continuum emission toward HD 107146, measured by fitting an elliptical gaussian to the visibility data, is offset by () from the stellar position. (The uncertainty in the stellar position, including uncertainties in the Hipparcos astrometry and Tycho-2 proper motions, are 0.013′′ for both the right ascension and declination.) The astrometric uncertainty due to phase-correction uncertainties is as determined from the measured offset of J1215+169 from the phase center (see Fig. 6). Thus within the astrometric uncertainties, the centroid of the millimeter continuum emission is centered on the stellar position. Williams et al. (2004) indicated that the peak 450µm emission may be offset by 4.4′′ from the stellar position. This offset is inconsistent with the OVRO observations assuming that the 450µm and 3 mm emission arise from the same location in the disk.
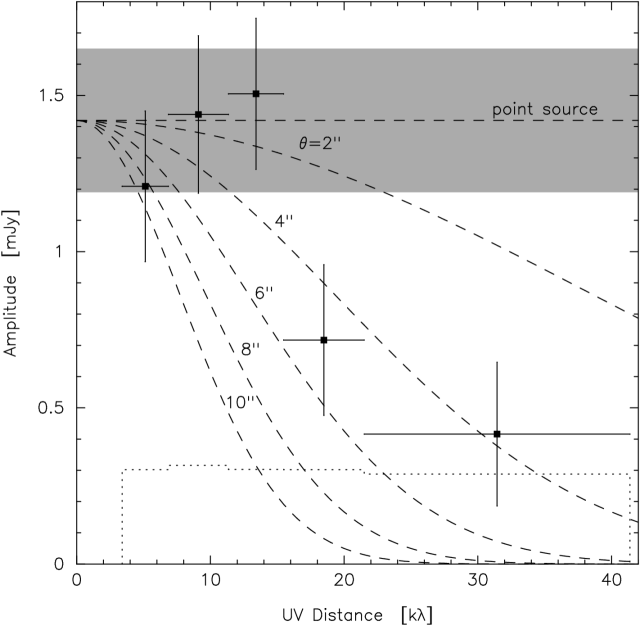
Figure 6 suggests that the continuum emission around HD 107146 may be resolved with the OVRO interferometer in that the lowest contours are extended at a position angle (east of north) of approximately , which is not observed in J1215+164. To quantify the possible extension in the continuum emission, Figure 7 shows the average observed visibility amplitude for the HD 107146 data as a function of distance from the phase center. The phase center was adopted as the reference point since within the astrometric uncertainties the continuum emission is centered on the stellar position as discussed above. The visibility data were averaged in 5 bins, where the bin sizes vary as a function of distance to maintain a constant number of visibility points per bin. The amplitude uncertainties represent the standard deviation of the mean in the visibility data, and the horizontal lines through each data point represent the full width of the bin. The dashed curves show the expected amplitudes as a function of distance in the absence of noise for model circular gaussians that have integrated intensities of 1.42 mJy and FWHM ranging from (i.e. a point source) to 10′′. The shaded region indicates the amplitude uncertainty of the integrated flux measured in the image domain.
As Figure 6 shows, the last two radial bins are below the expected amplitudes for a point source model. The vector averaged amplitude of the visibility data in these two bins combined is mJy, such that the deviation from the point source amplitude flux is mJy, or a 3.8 deviation. We thus conclude that the emission toward HD 107146 has indeed been resolved. To estimate the source size, an elliptical gaussian was fitted to the unbinned visibility data points. The position angle of the best-fit gaussian is , which agrees well with the direction of extended emission at 450µm noted by Williams et al. (2004). The fitted FWHM gaussian size is , which corresponds to a spatial size of . Assuming that the disk is intrinsically circularly symmetric, the ratio of the minor to major axis implies an inclination angle of (where is for a face on disk). The derived FWHM size is smaller than the size inferred from the 450µm emission, which is unexpected since both the 450µm and 3mm emission are likely optically thin and in the Rayleigh-Jeans limit (Williams et al., 2004). To have a smaller 3 mm size, one needs a grain population in the disk interior that radiates more effectively at longer wavelengths. In principle this could signify the presence of larger grains which would be in radiative equilibrium at colder temperatures. While in fact the observed 3mm flux is slightly larger than the extrapolated submillimeter flux, the moderate signal to noise ratio for both the 450µm and 3mm images are such that higher signal to noise detections are needed before drawing firm conclusions on any size differences as a function of wavelength.
Finally, we examine the consistency of the debris disk size with the characteristic dust temperature of K inferred from the SED analysis. For =0.69 (see §5.1) and assuming a single grain size that efficiently absorbs the stellar radiation, the radial dependence of the dust temperature around a solar luminosity star will be , where is the orbital radius measured in AU, is the luminosity in solar luminosities, and is the grain size in microns (Backman & Paresce, 1993). The resolved disk implies a range of dust temperatures must be present. At the half-width radius of 90 AU, the dust temperature will be 60 K for 1µm sized grains with warmer dust at small radii interior. These are warmer temperatures than implied by the SED modeling, but can be reconciled by invoking larger grains a few microns in size that radiate more efficiently and result in cooler temperatures. In a future FEPS publication, the HD 107146 debris disk will be presented that incorporates the submillimeter photometry, disk size, and Spitzer data to present a derive a self-consistent model.
5 Analysis
5.1 Dust Masses
The observed millimeter continuum fluxes can be used to estimate, or place limits on, the circumstellar dust masses. Assuming that the emission is isothermal and optically thin, the dust mass was computed using the following formula
| (1) |
where is the mass absorption coefficient, parameterizes the frequency dependence of , is the observed flux, is the distance to the source, is the dust temperature, and is the Planck function (Hildebrand, 1983). We assumed =1.0 and = 2 cm2 g-1 at 1.3 mm (Beckwith et al., 1990), and adopted a dust temperature of 40 K, which is a compromise between the expected cold ( 20-30 K) dust in optically thick accretion disks (Beckwith et al., 1990; André & Montmerle, 1994), and the warmer dust (45-100 K) inferred for optically thin debris disks around solar type stars (Zuckerman & Song, 2004). These mass estimates reflect the mass contained in small dust grains, and do not account for mass contained in large (millimeter-sized) particles that do not contribute significantly to the emission at millimeter wavelengths. For these adopted parameters, the inferred dust masses for the detected sources are M⊙, M⊙, M⊙, and M⊙ for HD 107146, PDS 66, RX J1842.93532, and RX J1852.33700 respectively.
A number of sources of systematic errors are present in computing in the dust masses, a few of which we mention here. Since the dust mass is proportional to in the Rayleigh-Jeans limit, the dust masses will be uncertain by a factor of 2 due to the dust temperature alone. Further, the value for can vary among sources over the range of 0 to 1.5, with most values 1 (Beckwith & Sargent, 1991; Weintraub, Sandell, & Duncan, 1989) most common. Adopting a value of for example would decrease the masses derived from the OVRO 3mm observations by a factor of 1.5. A larger source of uncertainty in computing the dust masses is the value for the dust opacity, (see review by Beckwith, Henning, & Nakagawa 2000). For example, Pollack et al. (1994) computed for a variety of grain sizes and compositions, and found values that ranged from 0.14 to 0.87 cm2 g-1 at 1.3 mm for 0.1µm-3 mm radius grains (see also Stognienko, Henning, & Ossenkopf 1995). The commonly used value for debris disks of 1.7 cm2 g-1 at µm, adopted by Zuckerman & Becklin (1993) to place a lower limit on the amount of dust, corresponds to 1.0 cm2 g-1 at mm assuming . Given that is poorly constrained, the relative values of disk masses should be significantly more reliable than the absolute values. We recognize, however, that systematic changes in with age are likely present, and therefore any trends of dust mass with stellar age can be interpreted as variations in dust mass and/or grain properties.
The average amount of dust as a function of stellar age in the observed sample can be examined by computing the mean dust mass and standard deviation of the mean in each age bin. If a star was observed at multiple wavelengths, the observation that provided the best sensitivity to dust mass for the adopted value of and was used in computing the mean values. In principle, the mean dust mass for an ensemble of stars may yield a significant detection if many of the stars possess small quantities of dust which produces a small overall bias in the measured fluxes. In computing the averages, the stars were weighted uniformly since otherwise the derived values would be heavily weighted toward the few nearest stars that had the best sensitivity to dust mass, and therefore would not reflect the mass limits placed on the typical star in the sample. In each age bin, the mean dust mass was less than three times the standard deviation of the mean. Figure 8 shows the 3 upper limits to the mean dust masses for each age bin, which range from M⊙ for the 100-300 Myr stars to M⊙ for the 3-10 Myr age bin. The difference in the mass sensitivity limits as a function of age primarily reflects the fact that the younger stars are typically found at larger distances than the older stars in this sample.
5.2 Comparison to Published Surveys
To compare the results for the FEPS targets with other observations, we compiled published millimeter and submillimeter continuum surveys of stars with stellar masses between 0.5 and 2.0 M⊙, which is the same mass range encompassed by the FEPS sample. These studies include the young stars in Taurus (40 stars total with the FEPS stellar mass range, with 16 millimeter continuum detections; Beckwith et al. 1990, Osterloh & Beckwith 1995, Duvert et al. 2000), IC 348 (14 stars, with no detections; Carpenter 2002), the Pic moving group and Local Association (8 stars total, with 2 detections; Liu et al. 2004), Lindroos binary systems (27 stars total, with 1 detection; Jewitt 1994; Gahm et al. 1994; Wyatt, Dent, & Greaves 2003), the Pleiades (12 stars with no detections; Zuckerman & Becklin 1993), the Ursa Major moving group (12 stars with no detections; Zuckerman & Becklin 1993), and stars with radial-velocity planets (8 stars total, with no detections; Greaves et al. 2004). The Wyatt, Dent, & Greaves (2003) observations of Lindroos binaries partially overlaps the sample observed by Jewitt (1994) and Gahm et al. (1994), and are significantly more sensitive. In presenting the results, we analyze the Wyatt, Dent, & Greaves (2003) data separately and only consider stars observed by Jewitt (1994) and Gahm et al. (1994) that were not observed at higher sensitivity. For the Taurus sample, stellar masses were estimated by first placing the stars in a Hertsprung-Russell diagram based on compiled photometry and spectral types, and then using the D’Antona & Mazzitelli (1997,98) pre-main-sequence tracks to infer stellar masses (L. Hillenbrand, private communication). Similarly, for IC 348, we adopted the membership list, effective temperatures, and bolometric luminosities from Luhman et al. (2003), and also estimated stellar masses using the D’Antona & Mazzitelli (1997,98) pre-main-sequence evolutionary tracks. In the remaining samples, we used the observed spectral type and estimated ages of the stellar group to estimate the stellar masses from evolutionary tracks.
Several continuum surveys for circumstellar dust around young stars were not included in this analysis since there were few stars within the desired stellar mass range or the continuum surveys were biased toward stars with known infrared excesses. Continuum emission has been detected toward TW Hydra (Weintraub, Sandell, & Duncan, 1989) and reported for other members of the association (Zuckerman, 2001), but an unbiased survey of the association members has yet to be published. The extensive millimeter continuum surveys of Oph (André & Montmerle, 1994; Motte, André, & Neri, 1998; Nürnberger et al., 1998; Johnstone et al., 2000), NGC 2024 (Eisner & Carpenter, 2003), and Serpens (Testi & Sargent, 1998) were omitted since these are heavily obscured regions and few stars have the necessary photometric and spectroscopic data to place the stars in the HR diagram and infer stellar masses. The continuum surveys of Lupus (Nürnberger, Chini, & Zinnecker, 1997), Chamaeleon I (Henning et al., 1993) and MBM 12 (Itoh et al., 2003; Hogerheijde et al., 2003) were not included since few stars in these samples have stellar masses within the 0.5-2.0 M⊙ range. Continuum surveys of IRAS-detected debris disks (Sylvester et al., 1996; Holland et al., 1998; Coulson, Walther, & Dent, 1998; Sylvester, Dunkin, & Barlow, 2001; Holmes et al., 2003; Sheret, Dent, & Wyatt, 2004) were excluded since they represent a biased sample of stars known to contain debris dust.
The dust masses were re-computed from the observed fluxes in the surveys described above using the assumptions for the dust properties adopted here. For those surveys that report the observed fluxes (as opposed to upper limits), the fluxes were averaged in a similar manner as was done for the FEPS targets to provide unbiased estimates of the mean dust mass. In each case, the mean was detected at a significance of less than 3. Some surveys provided only upper limits to the observed fluxes for stars with non-detections, and therefore the computed average disk mass is strictly an upper limit. Figure 8 shows the upper limits derived from published observations along with the upper limits from the FEPS targets. Since the mean dust mass is not detected at the 3 limit in any of the samples, these average values cannot be compared to test for evolution in the mean mass. Nonetheless, there is some suggestion of evolution in that the Taurus sample contains a number of sources with dust masses in excess of 10-4 M⊙, but such massive disks are rare around stars with ages older than 10 Myr. These trends have been noted previously (Zuckerman & Becklin, 1993; Jewitt, 1994; Gahm et al., 1994; Wyatt, Dent, & Greaves, 2003; Liu et al., 2004).
5.3 Temporal Evolution
The evolution of dust masses was examined quantitatively using ASURV Rev 1.2 (Lavalley, Isobe, & Feigelson, 1992), which implements the survival analysis methods presented in Feigelson & Nelson (1985). Using the Gehan, logrank, and Peto-Prentice tests, we computed the probability that the distribution of dust masses in any two stellar samples shown in Figure 8 could have been drawn from the same parent population. Specifically, we used these tests to determine which stellar samples have different dust mass distributions than stars in Taurus, which may indicate the evolutionary time scale for cold dust in accretion disks. The probability that the Taurus sample and the 3-10 Myr FEPS stars share the same parent population is between 0.098 and 0.132 for the different tests. The corresponding probability, again in comparison to the Taurus sample, is between a) 0.047 and 0.067 for the 10-30 Myr FEPS sample, b) 0.003 and 0.005 for a combined 10-30 Myr sample that includes the FEPS sources, the Pic moving group, and Lindroos binaries that are within this age range, and c) and for the 30-100 Myr FEPS stars.
Before drawing conclusions from the comparisons between the different stellar samples, we investigate the robustness of the results to various observational uncertainties. The survival analysis routines do not incorporate uncertainties on a formal basis, and, therefore, we invoke an ad hoc procedure to address how uncertainties in the stellar ages and dust masses affect the derived probabilities. We first consider the uncertainties in the stellar ages. The stellar ages for PDS 66, RX J1842.93532 and RX J1852.33700 are critical since these 3 stars have dust masses comparable to that found in Taurus, and therefore the inclusion of these stars in a particular age bin will increase the probability that the mass distribution is similar to that found in Taurus. PDS 66 was placed in the 10-30 Myr age bin, but the derived age is between 7 and 17 Myr depending on which pre-main-sequence evolutionary tracks are used (Mamajek, Meyer, & Liebert, 2002), and therefore the star may reasonably be placed in the 3-10 Myr age bin. Given that RX J1842.93532 and RX J1852.33700 have estimated ages of 10 Myr (Neuhäuser et al., 2000), it may be appropriate to assign these stars to the 10-30 Myr bin instead of 3-10 Myr. If we assign all three stars to the 3-10 Myr bin, then the probability that the 3-10 Myr FEPS sample has the same dust mass distribution as Taurus increases from 0.11 to 0.19. If instead we assign all three stars to the 10-30 Myr bin, then the probability that the combined 10-30 Myr sample has the same mass distribution as Taurus increases from 0.003 to 0.017.
We assessed how uncertainties in the stellar distances and measured fluxes (and consequently the derived dust masses) influence the survival analysis results by using a Monte Carlo simulation. We randomly assigned distances to each star using a gaussian random number generator that has a mean value centered on the nominal distance with a dispersion corresponding to the distance uncertainty. Similarly we varied the observed fluxes using both the observed flux measurement and calibration uncertainties. The dust masses were determined for these adjusted parameters, and the probabilities that the various samples are drawn from the same population were recomputed. We adopted a 10% global uncertainty for the distance to Taurus (Kenyon, Dobrzycka, & Hartmann, 1994). For stars with Hipparcos parallaxes, we computed the distance uncertainty based on the parallax uncertainty, and for the remaining stars, we arbitrarily adopt an distance uncertainty of 20%. In comparing the Taurus and 3-10 Myr FEPS sample, we found that the dispersion in the probabilities based on the measurement uncertainties is 0.04, and for Taurus and the combined 10-30 Myr stellar samples, the dispersion is 0.002. Thus the largest source of uncertainty in comparing the stellar samples is assigning the stars to the appropriate age bin.
In summary, the above results show that the dust mass distribution for disks around 30-100 Myr stars is different from that in Taurus at high significance ( 4.5). The mass distribution for the combined sample 10-30 Myr of stars is different from that of Taurus at the level, where the range reflects whether or not RX J1842.93532 and RX J1852.33700 are included in this age bin. Thus there is weak, but significant, evidence that the dust disks around 10-30 Myr solar-type stars are different than that found in Taurus. The differences in the dust mass distribution between Taurus and the 3-10 Myr FEPS sample is significant at the 1.0-2.3 level, where the range reflects whether are not the 3 massive disks detected in this survey are included in this age bin. The current observational data are insufficient to determine if the circumstellar disk masses around solar-type stars, as traced by millimeter and submillimeter continuum observations, have evolved on time scales as short as 3-10 Myr.
6 Discussion
The differences in the dust mass distribution between the Taurus population and stars older than 10 Myr can be attributed to the relatively few massive disks found at older ages. The lack of old massive disks is unlikely to be an artifact of errors in the assumed dust temperatures. Any systematic variations in the dust temperature as a function of stellar age are such that the optically thick young disks are expected to be colder on average than the dust around older disks (cf. Beckwith et al. 1990 and Zuckerman & Song 2004). Since the dust masses vary as in the Rayleigh-Jeans limit, the analysis presented here probably underestimates the differences in the dust mass distributions between the two samples. The apparent variations in dust mass distributions can likely be attributed then to a decrease in the amount of mass contained in small dust grains, and/or changes in the dust opacity due to variations in the grain composition and the growth of grains into larger particles. These scenarios have interesting implications for the evolution of dust in disks, but the observations presented here cannot establish the dominant affect.
We caution however that the evidence for evolution in the dust properties is relative to stars in the Taurus molecular cloud. Taurus is considered a representative region of “isolated”, low mass star formation, while many of the 3-30 Myr stars surveyed here are members of the Scorpius-Centaurus OB association. Environmental differences, as well as stellar age, then, may contribute to the differences in the mass distributions between Taurus and the 10-30 Myr sample. Carpenter (2002) and Eisner & Carpenter (2003) in fact found that the dust mass distributions for stars in Taurus and the young clusters NGC 2024 and IC 348 are different at the 2-3 level in that the cluster regions contain few massive disks. These studies included a broader range of stellar masses than considered here, and the sample sizes of 0.5-2 M⊙ stars in these clusters is insufficient to identify any differences in the dust mass distributions over this narrower mass range.
The evolution of disk properties for ages 30 Myr inferred from millimeter continuum observations are qualitatively consistent with that found from near- and mid-infrared observations. Nearly all low-mass stars with ages of 1 Myr have near-infrared excesses characteristic of circumstellar disks (Strom et al., 1989; Haisch, Lada, & Lada, 2001). Only 1% of the solar-type stars in Lower Centaurus-Crux and Upper Centaurus-Lupus possess such inner disks, suggesting that the inner disk dissipates on time scales less than 15 Myr (Mamajek, Meyer, & Liebert, 2002). Observations at 10µm (Mamajek et al. 2004 and references therein) and 60µm (Meyer & Beckwith, 2000) also show that a lower fraction of 10-30 Myr stars exhibit an excess at these wavelengths relative to 1 Myr stars. Thus observations at wavelengths from 2µm to 3 mm all point to a decrease in the number of stars with disks between 1 Myr and 10-30 Myr. However, the nature of the decline in the disk frequency at ages of 3-10 Myr remains ambiguous. Haisch, Lada, & Lada (2001) suggest that the inner disk frequency diminishes to near zero by an age of 6 Myr, while Lyo et al. (2003) suggest that 60% of the stars in the 5-9 Myr Cha cluster contain an inner disk. Available millimeter observations are insufficient to distinguish differences in the dust mass distributions around 3-10 Myr stars relative to Taurus.
The temporal evolution in the mass of warm dust around solar-type stars has been investigated by Spangler et al. (2001) and Habing et al. (2001) using ISO 60µm, 90µm, 100µm, and 170µm observations. Both surveys find a decrease in the dust luminosity with stellar age. Habing et al. (2001) though suggests a dramatic decrease in the number of debris disks for stars older than 400 Myr, while Spangler et al. (2001) suggested that the mean fractional dust luminosity, , declines steadily with stellar age as . Figure 8 shows the temporal evolution of dust mass derived from the ISO observations using the approximate relation between and dust mass from Silverstone (2000). The dust mass upper limits from the millimeter-wavelength observations are generally above the Spangler et al. (2001) relation and therefore do not resolve the discrepancy between the Habing et al. (2001) and Spangler et al. (2001) results. The lack of millimeter-wavelength continuum detections does suggest that there are not massive reservoirs of cold dust ( 20 K; see Fig. 1) that has been missed by IRAS and ISO observations.
7 Summary
We present submillimeter (CSO 350µm) and millimeter (SEST 1.2 mm, OVRO 3 mm) photometry for 125 stars that will be observed by the FEPS Spitzer Legacy Program. These stars have stellar masses between 0.5 and 2 M⊙ and stellar ages between 3 Myr and 1 Gyr, and are used to investigate the evolution of cold circumstellar dust around solar-type stars. Four sources in this survey were detected in the millimeter continuum: RX J1842.93532, RX J1852.33700, and PDS 66 with SEST, and HD 107146 with OVRO. RX J1842.93532 and RX J1852.33700 are located in projection near the RCrA molecular cloud with estimated ages of 10 Myr (Neuhäuser et al., 2000). PDS 66 is a kinematic member of the 20 Myr old Lower Centaurus-Crux subgroup of the Scorpius-Centaurus OB association and is probably a rare example of a old classical T Tauri star surrounded by an accretion disk (Mamajek, Meyer, & Liebert, 2002). HD 107146 is a young (80-200 Myr) debris disk system that was recently detected in the submillimeter continuum (Williams et al., 2004).
The SEST detections of RX J1842.93532, RX J1852.33700, and PDS 66 are unresolved at a FWHM resolution of 24′′, and the observed fluxes imply dust masses of 5 M⊙ around each star, assuming a dust temperature of 40 K, a mass absorption coefficient of 2 cm2g-1 at 1.3 mm, and (Beckwith et al., 1990). Since these three stars have observational characteristics similar to that of classical T Tauri stars, the continuum emission likely originates from a circumstellar accretion disk. The OVRO observations of HD 107146 resolve the continuum emission with a gaussian-fit FWHM size of , or 185 AU120 AU, that is centered on the stellar position within the astrometric uncertainties.
To investigate the evolution of cold circumstellar dust around 0.5-2.0 M⊙ stars, our results are compared with published continuum observations of stars in Taurus (Beckwith et al., 1990; Osterloh & Beckwith, 1995; Duvert et al., 2000), the Pic moving group and Local Association (Liu et al., 2004), and Lindroos binaries (Jewitt, 1994; Gahm et al., 1994; Wyatt, Dent, & Greaves, 2003). The stars were grouped into age bins that span a factor of 3, and are compared with the dust masses inferred around solar-type stars in Taurus to investigate the evolutionary time scales for dust mass in circumstellar disks. Using “survival analysis” techniques (Feigelson & Nelson, 1985), the mass distribution of disks in the Taurus molecular cloud is distinguished from that in the 10-30 Myr stellar sample at a significance level of 2.5-3.4, where the range in significance reflects the uncertainty in determining the age of stars that have continuum detections. The difference in the dust mass distributions between Taurus and the 3-10 Myr stars is significant at the 1.0-2.3 confidence level. These results suggest that significant evolution has occurred in the circumstellar dust properties around solar-type stars by ages of 10-30 Myr, either by a decrease in the mass of small dust grains with time and/or changes in the dust opacity. These time scales are consistent with that inferred for the inner disk as traced by 2-60µm infrared emission. Additional observations are needed to establish if evolution occurs on even shorter time scales.
References
- André & Montmerle (1994) André, P., & Montmerle, T. 1994, ApJ, 420, 837
- Backman & Paresce (1993) Backman, D. E., & Paresce, F. 1993, in Protostars and Planets III, ed. E. H. Levy, J. I. Lunine, & M. S. Matthews (Tucson: Univ. Arizona Press), 1253
- Beckwith et al. (1990) Beckwith, S. V. W., Sargent, A. I., Chini, R. S., & Güsten, R. 1990, AJ, 99, 924
- Beckwith, Henning, & Nakagawa (2000) Beckwith, S. V. W., Henning, T., & Nakagawa, Y. 2000, in Protostars and Planets IV, ed. V. Mannings, A. P. Boss, & S. R. Russell (Tucson: Univ. Arizona Press), 533
- Beckwith & Sargent (1991) Beckwith, S. V. W., & Sargent, A. I. 1991, ApJ, 381, 250
- Beers et al. (1996) Beers, T. C., Rossi, S., Ulrich, D., & Wilhelm, R. 1996, AJ, 112, 1188
- Boss (2001) Boss, A. P. 2001, ApJ, 563, 367
- Briggs (1995) Briggs, D. 1995, Ph.D. thesis, New Mexico Institute of Mining and Technology
- Carpenter (2002) Carpenter, J. M. 2002, AJ, 124, 1593
- Casey et al. (1998) Casey, B. W., Mathieu, R. D., Vaz, L., P. R., Andersen, J. & Suntzeff, N. B. 1998, AJ, 115, 1617
- Cohen et al. (2003a) Cohen, M., Megeath, S. T., Hammersley, P. L., Martín-Luis, F., & Stauffer, J. 2003a, AJ, 125, 2645
- Cohen, Wheaton, & Megeath (2003b) Cohen, M., Wheaton, W. A., & Megeath, S. T. 2003b, AJ, 126, 1090
- Coulson, Walther, & Dent (1998) Coulson, I. M., Walther, D., & Dent, W. R. F. 1998, MNRAS, 296, 934
- D’Antona & Mazzitelli (1997) D’Antona, F., & Mazzitelli, I. 1997, Mem. Soc. Astron. Italiana, 68, 807
- D’Antona & Mazzitelli (1997,98) D’Antona, F., & Mazzitelli, I. 1998, ASP conf. ser. 134, in Brown Dwarfs and Extrasolar Planets, ed. R. Rebolo, E. L. Martin, and M. R. Zapatero-Osorio (San Franciso: ASP), 442
- Decin et al. (2003) Decin, G., Dominik, C., Waters, L. B. F. M., & Waelkens, C. 2003, ApJ, 598, 636
- Dutrey et al. (1996) Dutrey, A., Guilloteau, S., Duvert, G., Prato, L., Simon, M., Schuster, K., & Ménard, F. 1996, A&A, 309, 493
- Duvert et al. (2000) Duvert, G., Guilloteau, S., Ménard, F., Simon, M., & Dutrey, A. 2000, A&A, 355, 165
- Eisner & Carpenter (2003) Eisner, J. A., & Carpenter, J. M. 2003, ApJ, 598, 1341
- Feigelson & Nelson (1985) Feigelson, E. D., & Nelson P. U. 1985, ApJ, 293, 192
- Gahm et al. (1994) Gahm, G. F., Zinnecker, H., Pallavicini, R., & Pasquini, L. 1994, A&A, 282, 123
- Greaves et al. (1998) Greaves, J. S., Holland, W. S., Moriarty-Schieven G., Jenness T., Dent W. R. F., Zuckerman B., McCarthy C., Webb R., Butner H. M., Gear W. K., & Walker H. J. 1998, ApJ, 506, L133
- Greaves et al. (2004) Greaves, J. S., Holland, W. S., Jayawardhana, R. Wyatt, M. C., & Dent, W. R. F. 2004, MNRAS, 348, 1097
- Gregorio-Hetem et al. (1992) Gregorio-Hetem, J., Lepine, J. R. D., Quast, G. R., Torres, C. A. A., & de La Reza, R. 1992, AJ, 103, 549
- Habing et al. (1999) Habing, H. J., Dominik, C., Jourdain de Muizon, M., Kessler, M. F., Laureijs, R. J., Leech, K., Metcalfe, L., Salama, A., Siebenmorgen, R. & Trams, N. 1999, Nature, 401, 456
- Habing et al. (2001) Habing, H. J., Dominik, C., Jourdain de Muizon, M., Laureijs, R. J., Kessler, M. F., Leech, K., Metcalfe, L., Salama, A., Siebenmorgen, R. Trams, N., & Bouchet, P. 2001, A&A, 365, 545
- Haisch, Lada, & Lada (2001) Haisch, K. E. Jr., Lada, E. A., & Lada, C. J. 2001, AJ, 121, 2065
- Hartmann (2001) Hartmann, L. 2001, ApJ, 562, 852
- Henize (1976) Henize, K. G. 1976, ApJS, 30, 491
- Henning et al. (1993) Henning, T., Pfau, W., Zinnecker, H., & Prusti, T. 1993, A&A, 276, 129
- Hildebrand (1983) Hildebrand, R. H. 1983, QJRAS, 24, 267
- Høg et al. (2000) Høg, E., Fabricius, C., Makaraov, V. V., Urban, S., Corbin, T., Wycoff, G., Bastian, U., Schwekendiek, P., & Wicenec, A. 2000, A&A, 355, L27
- Hogerheijde et al. (2003) Hogerheijde, M. R., Johnstone, D., Matsuyama, I., Jayawardhana, R., & Muzerolle, J. 2003, ApJ, 593, L101
- Holland et al. (1998) Holland, W. S., Greaves, J. S., Zuckerman, B., Webb, R. A., McCarthy, C., Coulson, I. M., Walther, D. M., Dent, W. R. F., Gear, W. K., & Robson, I. 1998, Nature, 392, 788
- Holmes et al. (2003) Holmes, E. K., Butner, H. M., Fajardo-Acosta, B., & Rebull, L. M. 2003, AJ, 125, 3334
- Hunter, Benford, & Serabyn (1996) Hunter, T. R., Benford, D. J., & Serabyn, E. 1996, PASP, 108, 104
- Itoh et al. (2003) Itoh, Y., Sugitani, K.., Fukuda, N., Nakanishi, K., Ogura, K., Tamura, M., Marui, K., Fujita, K., Oasa, Y., & Fukagawa, M. 2003, ApJ, 586, L141
- Jayawardhana et al. (1999) Jayawardhana, R., Hartmann, L., Fazio, G., Fisher, R. S., Telesco, C. M., & Pĩno, R. K. 1999, ApJ, 521, L129
- Jewitt (1994) Jewitt, D. C. 1994, AJ, 108, 661
- Johnstone et al. (2000) Johnstone, D., Wilson, C. D., Moriarty-Schieven, G., Joncas, G., Smith, G., Gregersen, E., & Fich, M. 2000, ApJ, 545, 327
- Kalas, Liu, & Matthews (2004) Kalas, P., Liu, M. C., & Matthews, B. C. 2004, Science, 303, 1990
- Kenyon, Dobrzycka, & Hartmann (1994) Kenyon, S. J., Dobrzyck, D., Hartmann, L. 1994, AJ, 108, 1872
- Lavalley, Isobe, & Feigelson (1992) Lavalley, M., Isobe, T., & Feigelson, E. 1992, in ASP Conf. Ser. 25, Astronomical Data Analysis Software and Systems I, ed. D. M. Worrall, C. Biemesderfer, & J. Barnes (San Francisco: ASP), 245
- Lawson, Feigelson, & Huenemoerder (1996) Lawson, W. A., Feigelson, E. D., & Huenemoerder, D. P. 1996, MNRAS, 280, 1071
- Liu et al. (2004) Liu, M. C. Matthews, B. C., Williams, J. P., & Kalas, P. G. 2004, ApJ, 608, 526
- Luhman et al. (2003) Luhman, K. L., Stauffer, J. R., Muench, A. A., Rieke, G. H., Lada, E. A., Bouveri, J., & Lada, C. J. 2003, ApJ, 593, 1093
- Lyo et al. (2003) Lyo, A. R., Lawson, W. A., Mamajek, E. E., Feigelson, E. D., Sung, E. C., & Crause, L. A. 2003, MNRAS, 338, 616
- Mamajek, & Feigelson (2001) Mamajek, E. E., & Feigelson, E. D. 2001, in ASP Conf. Ser. 244, Young Stars Near Earth: Progress and Prospects, ed. R. Jayawardhana & T. Greene (San Francisco: ASP), 104
- Mamajek, Lawson, & Feigelson (2000) Mamajek, E. E., Lawson, W. A., & Feigelson, E. D. 2000, ApJ, 544, 356
- Mamajek et al. (2004) Mamajek, E. E., Meyer, M. R., Hinz, P. H., Hoffman, W. F., Cohen, M., & Hora, J. L. 2004, ApJ, in press
- Mamajek, Meyer, & Liebert (2002) Mamajek, E. E., Meyer, M. R., & Liebert, J. 2002, ApJ, 124, 1670
- Marcy, Cochran, & Mayor (2000) Marcy, G. W., Cochran, W. D., & Mayor, M. 2000, Protostars and Planets IV, eds. V. Mannings, A. P. Boss, and S. S. Russell, (Tucson:University of Arizona Press), 1285
- McCaughrean & O’Dell (1996) McCaughrean, M., J., & O’Dell, C. R. 1996, AJ, 111, 1977
- Meyer & Beckwith (2000) Meyer, M. R., & Beckwith, S. V. W. 2000, in ISO Surveys of a Dusty Universe, ed. D. Lemke, M. Stickel, & K. Wilke (New York: Springer), 341
- Metchev, Hillenbrand, & Meyer (2004) Metchev, S. A., Hillenbrand, L. A., & Meyer, M. R. 2004, ApJ, 600, 436
- Meyer et al. (2004) Meyer, M. R. et al. 2004, ApJS, 154, 422
- Motte & André (2001) Motte, F. & André, P. 2001, A&A, 365, 440
- Motte, André, & Neri (1998) Motte, F., André, P., & Neri, R. 1998, A&A, 336, 150
- Muzerolle et al. (2000) Muzerolle, J., Calvet, N., Briceño, C., Hartmann, L., & Hillenbrand, L. 2000, ApJ, 435, L47
- Naylor (1998) Naylor, T. 1998, MNRAS, 296, 339
- Neuhäuser et al. (2000) Neuhäuser, R., Walter, F. M., Covina, E., Alcalá, J. M., Wolk, S. J., Frink, S., Guillout, P., Sterzik, M. F., & Comerón, F. 2000, A&AS, 146, 323
- Nürnberger, Chini, & Zinnecker (1997) Nürnberger, D., Chini, R., & Zinnecker, H. 1997, A&A, 324, 1036
- Nürnberger et al. (1998) Nürnberger, D., Brandner, W., Yorke, H. W., & Zinnecker, H. 1998, A&A, 330, 549
- Osterloh & Beckwith (1995) Osterloh, M., & Beckwith, S. V. W. 1995, ApJ, 439, 288
- Pollack et al. (1994) Pollack, J. B., Hollenbach, D., Beckwith, S., Simonelli, D. P., Roush, T., & Fong, W. 1994, ApJ, 421, 615
- Pollack et al. (1996) Pollack, J. B., Hubickyj, O., Bodenheimer, P., Lissauer, J. J., Podolak, M., & Greenzweig, Y. 1996, Icarus, 124, 62
- Robson et al. (1993) Robson, E. I. et al. 1993, MNRAS, 262, 249
- Scoville et al. (1993) Scoville, N. Z., Carlstrom, J. E., Chandler, C. J., Phillips, J. A., Scott, S. L., Tilanus, R. P. J., & Wang, Z. 1993, PASP, 105, 1482
- Sheret, Dent, & Wyatt (2004) Sheret, I., Dent, W. R. F., & Wyatt, M. C. 2004, MNRAS, 348, 1282
- Silverstone (2000) Silverstone, M. 2000, Ph.D. thesis, UCLA
- Song, Zuckerman, & Bessell (2003) Song, I., Zuckerman, B., & Bessell, M. S. 2003, ApJ, 599, 342
- Spangler et al. (2001) Spangler, C., Sargent, A. I., Silverstone, M. D., Becklin, E. E., & Zuckerman, B. 2001, 555, 932
- Steppe et al. (1993) Steppe, H., Paubert, G., Sievers, A., Reuter, H. P., Greve, A., Liechti, S., Le Floch, B., Brunswig, W., Menendez, C., & Sanchez, C. 1993, A&AS, 102, 611
- Stognienko, Henning, & Ossenkopf (1995) Stognienko, R., Henning, T., & Ossenkopf, V. 1995, A&A, 296, 797
- Strom et al. (1989) Strom, K. E., Strom, S. E., Edwards, S., Cabrit, S., & Skrutskie, M. F. 1989, AJ, 97, 1451
- Sylvester, Dunkin, & Barlow (2001) Sylvester, R. J., Dunkin, S. K., & Barlow, M. J. 2001, MNRAS, 327, 133
- Sylvester et al. (1996) Sylvester, R. J., Skinner, C. J., Barlow, M. J., & Mannings, V. 1996, MNRAS, 279, 915
- Testi & Sargent (1998) Testi, L., & Sargent, A. I. 1998, AJ, 116, 854
- Weinberger et al. (2004) Weinberger, A. J., Becklin, E. E., Zuckerman, B., & Song, I. 2004, AJ, 127, 2246
- Weintraub, Sandell, & Duncan (1989) Weintrub, D. A., Sandell, G., & Duncan, W. D. 1989, ApJ, 340, L69
- Wichmann, Schmtt, & Hubrig (2003) Wichmann, R., Schmitt, J. H. M. M., & Hubrig, S. 2003, A&A, 399, 983
- Williams et al. (2004) Williams, J. P., Najita, J., Liu, M. C., Bottinelli, S., Carpenter, J. M., Hillenbrand, L. A., Meyer, M. R., & Soderblom, D. R. 2004, ApJ, 604, 414
- Wyatt, Dent, & Greaves (2003) Wyatt, M. C., Dent, W. R. F, & Greaves, J. S. 2003, MNRAS, 342, 876
- Zuckerman & Becklin (1993) Zuckerman, B., & Becklin, E. E. 1993, ApJ, 414, 793
- Zuckerman (2001) Zuckerman, B. 2001, ARA&A, 39, 549
- Zuckerman & Song (2004) Zuckerman, B., & Song, I. 2004, ApJ, 603, 738


| Name | Distance | Sν(350m) | Sν(1.2 mm) | Sν(2.7 mm) | Sν(3.0 mm) |
|---|---|---|---|---|---|
| (pc) | (mJy) | ||||
| 6.5 log(age/years) 7.0 | |||||
| HD 104467 | 110 | ||||
| HD 142361 | 81 | ||||
| HD 284135 | 140 | ||||
| HD 285372 | 140 | ||||
| RX J1111.7-7620**Contains an infrared excess in one or more IRAS bands. | 160 | ||||
| RX J1541.1-2656 | 145 | ||||
| RX J1842.9-3532**Contains an infrared excess in one or more IRAS bands. | 130 | ||||
| RX J1852.3-3700**Contains an infrared excess in one or more IRAS bands. | 130 | ||||
| RX J1917.4-3756 | 130 | ||||
| ScoPMS 27 | 145 | ||||
| ScoPMS 52 | 145 | ||||
| ScoPMS 214 | 145 | ||||
| PZ99 J155847.8-175800 | 160 | ||||
| PZ99 J161329.3-231106 | 145 | ||||
| 7.0 log(age/years) 7.5 | |||||
| AO Men | 38 | ||||
| HD 107441 | 97 | ||||
| HD 139498 | 124 | ||||
| HD 199143 | 48 | ||||
| MML 1 | 83 | ||||
| MML 8 | 96 | ||||
| MML 9 | 95 | ||||
| MML 17 | 110 | ||||
| MML 18 | 100 | ||||
| PDS 66**Contains an infrared excess in one or more IRAS bands. | 86 | ||||
| V343 Nor | 40 | ||||
| 7.5 log(age/years) 8.0 | |||||
| 1RXS J043243.2-152003 | 140 | ||||
| 1RXS J053650.0+133756 | 100 | ||||
| B102 | 150 | ||||
| HD 105 | 40 | ||||
| HD 377 | 40 | ||||
| HD 984 | 46 | ||||
| HD 12039 | 42 | ||||
| HD 15526 | 100 | ||||
| HD 17925 | 10 | ||||
| HD 25457**Contains an infrared excess in one or more IRAS bands. | 19 | ||||
| HD 35850 | 27 | ||||
| HD 37484**Contains an infrared excess in one or more IRAS bands. | 60 | ||||
| HD 47875 | 70 | ||||
| HD 60737 | 38 | ||||
| HD 61005**Contains an infrared excess in one or more IRAS bands. | 35 | ||||
| HD 70516 | 37 | ||||
| HD 77407 | 30 | ||||
| HD 86356 | 110 | ||||
| HD 104860 | 48 | ||||
| HD 107146**Contains an infrared excess in one or more IRAS bands. | 29 | ||||
| HD 112196 | 34 | ||||
| HD 129333 | 34 | ||||
| HD 134319 | 44 | ||||
| HD 135363 | 29 | ||||
| HD 151798 | 41 | ||||
| HD 202917 | 46 | ||||
| HD 216803 | 8 | ||||
| HD 217343 | 32 | ||||
| HD 279788 | 100 | ||||
| R3 | 150 | ||||
| R45 | 150 | ||||
| R83 | 150 | ||||
| RE J0137+18A | 61 | ||||
| RX J0331.1+0713 | 100 | ||||
| RX J1140.3-8321 | 110 | ||||
| RX J1844.3-3541 | 130 | ||||
| SAO 150676 | 65 | ||||
| V383 Lac | 50 | ||||
| W79 | 150 | ||||
| 8.0 log(age/years) 8.5 | |||||
| 2RE J0255+474 | 50 | ||||
| BPM 87617 | 50 | ||||
| HD 691 | 34 | ||||
| HD 8907**Contains an infrared excess in one or more IRAS bands. | 34 | ||||
| HD 19668 | 40 | ||||
| HD 25300 | 50 | ||||
| HD 38207**Contains an infrared excess in one or more IRAS bands. | 100 | ||||
| HD 38949 | 43 | ||||
| HD 41700 | 27 | ||||
| HD 70573 | 46 | ||||
| HD 72905 | 14 | ||||
| HD 75393 | 42 | ||||
| HD 88201 | 41 | ||||
| HD 90905 | 32 | ||||
| HD 91782 | 56 | ||||
| HD 91962 | 37 | ||||
| HD 92855 | 36 | ||||
| HD 95188 | 36 | ||||
| HD 101472 | 39 | ||||
| HD 104576 | 49 | ||||
| HD 106772 | 110 | ||||
| HD 108799 | 25 | ||||
| HD 108944 | 44 | ||||
| HD 132173 | 49 | ||||
| HD 139813**Contains an infrared excess in one or more IRAS bands. | 22 | ||||
| HD 152555 | 48 | ||||
| HD 172649 | 47 | ||||
| HD 191089**Contains an infrared excess in one or more IRAS bands. | 54 | ||||
| HD 199019 | 35 | ||||
| HD 203030 | 41 | ||||
| HD 209253**Contains an infrared excess in one or more IRAS bands. | 30 | ||||
| HD 224873 | 49 | ||||
| HIP 6276 | 35 | ||||
| QT And | 50 | ||||
| RE J0723+20 | 24 | ||||
| RX J0849.2-7735 | 90 | ||||
| RX J0850.1-7554 | 90 | ||||
| SAO 178272 | 58 | ||||
| vB 142 | 51 | ||||
| 8.5 log(age/years) 9.0 | |||||
| HD 7661 | 27 | ||||
| HD 21411 | 31 | ||||
| HD 209779 | 36 | ||||
| HIP 59154 | 43 | ||||
| RX J0917.2-7744 | 90 | ||||
| RX J1203.7-8129 | 110 | ||||
| RX J1209.8-7344 | 110 | ||||
| RX J1220.6-7539 | 110 | ||||
| 9.0 log(age/years) 9.5 | |||||
| HD 6434 | 40 | ||||
| HD 27466 | 36 | ||||
| HD 29231 | 28 | ||||
| HD 31143 | 32 | ||||
| HD 37962 | 37 | ||||
| HD 69076 | 34 | ||||
| HD 88742 | 23 | ||||
| HD 92788 | 32 | ||||
| HD 98553 | 34 | ||||
| HD 101959 | 32 | ||||
| HD 102071 | 30 | ||||
| HD 179949 | 27 | ||||
| HD 183216 | 35 | ||||
| HD 193017 | 37 | ||||
| HD 201989 | 30 | ||||
| HD 205905 | 26 | ||||
| Sources dropped from the FEPS program | |||||
| B119 | 150 | ||||
| B140 | 150 | ||||
| HD 19632 | 30 | ||||
| HD 22879 | 24 | ||||
| HD 49197 | 45 | ||||
| HD 88638 | 38 | ||||
| HD 99565 | 35 | ||||
| HD 166435 | 25 | ||||
| HD 221275 | 35 | ||||
| RX J1017.9-7431 | 110 | ||||
| RX J1307.3-7602 | 110 | ||||