ABUNDANCE PROFILES AND KINEMATICS OF DAMPED ABSORBING GALAXIES AT 11affiliation: Observations reported here were obtained in part at the MMT Observatory, a joint facility of the University of Arizona and the Smithsonian Institution. 22affiliation: Observations reported here were obtained in part at the Magellan telescopes, a collaboration between the Observatories of the Carnegie Institution of Washington, University of Arizona, Harvard University, University of Michigan, and Massachusetts Institute of Technology. 33affiliation: Based in part on observations with the NASA/ESA Hubble Space Telescope, obtained at the Space Telescope Science Institute, which is operated by the Association of Universities for Research in Astronomy, Inc., under NASA contract NAS5–26555.
Abstract
We present a spectroscopic study of six damped absorption (DLA) systems at , based on moderate-to-high resolution spectra of the galaxies responsible for the absorbers. Combining known metallicity measurements of the absorbers with known optical properties of the absorbing galaxies, we confirm that the low metal content of the DLA population can arise naturally as a combination of gas cross-section selection and metallicity gradients commonly observed in local disk galaxies. We also study the Tully-Fisher relation of the DLA-selected galaxies and find little detectable evidence for evolution in the disk population between and . Additional results of our analysis are as follows. (1) The DLA galaxies exhibit a range of spectral properties, from post-starburst, to normal disks, and to starburst systems, supporting the idea that DLA galaxies are drawn from the typical field population. (2) Large rotating H I disks of radius kpc and of dynamic mass appear to be common at intermediate redshifts. (3) Using an ensemble of six galaxy-DLA pairs, we derive an abundance profile that is characterized by a radial gradient of dex per kiloparsec (or equivalently a scale length of kpc) from galactic center to kpc radius. (4) Adopting known profiles of nearby galaxies and the best-fit radial gradient, we further derive an -weighted mean metallicity for the DLA population over 100 random lines of sight, consistent with observed for DLA systems from Prochaska et al. Our analysis demonstrates that the low metal content of DLA systems does not rule out the possibility that the DLA population trace the field galaxy population.
1 INTRODUCTION
Damped absorption (DLA) systems are thought to probe the high-redshift analogy of neutral gas regions that resembles the disks of nearby luminous galaxies and represent a unique sample for studying the interstellar medium (ISM) of distant galaxies at redshifts as high as the background QSOs can be observed. These absorbers are typically selected to have neutral hydrogen column density . To date, substantial progress has been made to establish the chemical enrichment history in the cold gas traced by the DLA systems. Results obtained by various authors (e.g. Pettini et al. 1999; Prochaska et al. 2003a) indicate that the mean metallicities observed in the DLA systems are substantially lower than the mean metal content observed in the solar neighborhood (e.g. Sofia & Meyer 2001) at all redshifts that have been studied.
The low metal content observed in DLA systems suggests that these absorbers do not trace the bulk of star formation, particularly because galaxies at redshift exhibit a strong luminosity-metallicity correlation—more luminous galaxies are also more metal enriched (e.g. Kobulnicky & Zaritsky 1999; Tremonti et al. 2004). Consequently, this would suggest that the DLA systems are not likely to be the progenitors of present-day luminous disk galaxies. Recent analysis presented by Wolfe et al. (2003a,b) suggests, however, that the DLA systems may contribute equally to the star formation rate density at as the luminous starburst population selected at rest-frame UV wavelengths (e.g. Steidel et al. 1999). Wolfe et al. further propose that the discrepancy between high star formation rate and low metallicity in the DLA systems may be understood if star formation occurs in a compact region that has little cross section.
Identifying the stellar content of the DLA galaxies is clearly essential for understanding the nature of the absorbing galaxy population. But this has been a challenging task, because these galaxies are faint and located at small projected distances to the bright background QSOs (as implied by the intrinsic high column density of the absorbers). Despite extensive searches in the past decade, the number of known DLA galaxies has remained relatively small. Of all the 23 DLA systems found at , 13 have been identified with their host galaxies using either spectroscopic or photometric redshift techniques (Rao & Turnshek 1998; Lane et al. 1998; Miller, Knezek, & Bregman 1999; Turnshek et al. 2001; Cohen 2001; Bowen, Tripp, & Jenkins 2001; Chen & Lanzetta 2003; Lacy et al. 2003), six systems have host candidates found in deep images (Steidel et al. 1994; Le Brun et al. 1997; Rao et al. 2003), and two systems still remain unidentified after substantial search efforts (Steidel et al. 1997; Cohen 2001). Based on a study of eight DLA systems along seven lines of sight, Le Brun et al. (1997) have pointed out that galaxies giving rise to low-redshift DLAs display a wide range of morphologies.
Chen & Lanzetta (2003) studied the 11 galaxies that have been confirmed at the time to produce DLA systems and showed that typical galaxies at are surrounded by an extended neutral gaseous envelope of radius kpc at . In addition, when a known galaxy luminosity function is adopted, the neutral gas cross-section weighted luminosity distribution of field galaxies would produce the observed luminosity distribution of DLA galaxies. This result lends strong support for the idea that galaxies selected by association with known DLA systems are representative of the field galaxy population and that a large contribution of dwarfs () to the total neutral gas cross section is not necessary. But it also underscores the issue of the apparent low metallicity of the DLA population.
We have been pursuing a spectroscopic study of galaxies known to produce DLA systems, in order to understand the low metallicity nature observed in the absorbers. Here we present moderate resolution spectra of four previously known DLA galaxies toward PKS0439433 (), Q0738313 (), AO 0235164 (), and B2 0827243 (). We also add two DLA galaxies toward Q0809483 () and LBQS00580155 () that are confirmed in our spectroscopic program. Furthermore, metallicity measurements of the neutral gas are available from the literature for the DLA systems toward B2 0827243 (Khare et al. 2004) and LBQS00580155 (Pettini et al. 2000). We present two new measurements for the DLA systems toward PKS0439433 and AO 0235164 based on the ultraviolet spectra of the background QSOs retrieved from the Hubble Space Telescope (HST) data archive.
Combining known metallicity measurements of the absorbers with known optical properties of the absorbing galaxies yields a galaxy-DLA pair sample that has two unique applications. First, it allows us to go beyond simple cross-section measurements and to establish an empirical correlation between the kinematics and metallicity of the absorbers and those of the absorbing galaxies. A particularly interesting aspect of this application is to investigate whether or not the low metal content of the DLA population arises naturally as a combination of gas cross-section selection and metallicity gradients commonly observed in local disk galaxies (e.g. Zaritsky et al. 1994; Ferguson, Gallagher, & Wyse 1998; van Zee et al. 1998). Second, the sample offers a means of studying the disk population at intermediate redshift using galaxies selected uniformly based on known neutral gas content ( ), rather than optical brightness or color. Specifically, we will study disk evolution based on a comparison of the Tully-Fisher relation of the DLA galaxies and those of field galaxies.
We describe our observations and data reduction in § 2 and present spectral properties of the galaxy and absorber pairs toward individual sightlines in § 3. In § 4, we investigate the Tully-Fisher relation of DLA selected galaxies and chemical abundance profiles of galactic disks. Finally, a summary is presented in § 5. Throughout the paper, we adopt a cosmology, and , with a dimensionless Hubble constant .
2 OBSERVATIONS AND DATA REDUCTION
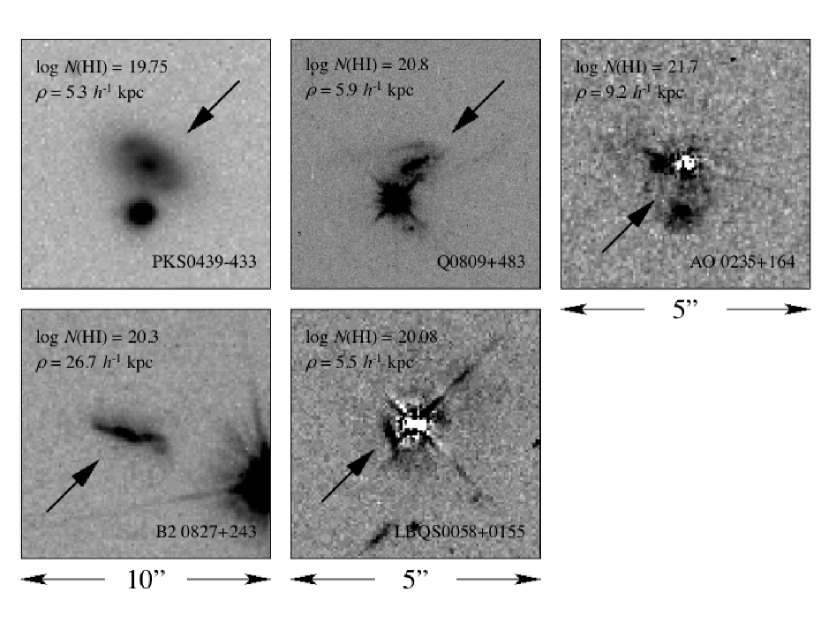
We have obtained moderate-resolution spectra of six absorbing galaxies toward the lines of sight of PKS0439433, Q0738313, Q0809483, AO 0235164, B2 0827243, and LBQS00580155, using the Magellan telescopes at Las Campanas and MMT on Mt. Hopkins. These galaxies are known to give rise to strong absorbers of (e.g. Rao & Turnshek 2000; Chen & Lanzetta 2003). The properties of the absorbing galaxies are summarized in Table 1. High spatial resolution images of the galaxies toward PKS0439433, Q0809483, AO 0235164, B2 0827243, and LBQS00580155 are presented in Figure 1, and these illustrate the relative locations of the galaxies with respect to the background QSOs and show their visual morphology. The image surrounding the field of PKS0439433 was obtained using the Tek#5 CCD imager with an -band filter on the du Pont telescope at Las Campanas (Chen & Lanzetta 2003). The images surrounding Q0809483, AO 0235164, B2 0827243, and LBQS00580155 were obtained using HST, the Wide Field and Planetary Camera 2 (WFPC2) with the F702W filter. Raw images were downloaded from the HST data archive, and processed and coadded using our own image processing programs (Chen & Lanzetta 2003). No image surrounding Q0738313 is available in public data archives, but a deep -band image is published in Turnshek et al. (2001). These high spatial resolution images allowed us to measure accurately the inclination angles of disk galaxies (PKS0439433, Q0809483, and B2 0827243) for rotation curve studies.
We have also searched through the HST data archive and located moderate-resolution, ultraviolet and optical spectra of the background QSOs, PKS0439433 and AO 0235164. The spectra were obtained using either the Faint Object Spectrograph (FOS) or the Space Telescope Imaging Spectrograph (STIS). They are suitable for studying the metal abundances of the neutral gas using absorption features produced by heavy ions such as iron and/or manganese. The observation and data reduction procedures for the spectra are described in the following sections. A journal of the ground-based, long-slit spectroscopic observations is listed in Table 2. A journal of spectroscopic observations using HST is listed in Table 3.
2.1 Magellan Observations
Long-slit spectra of the absorbing galaxies toward PKS0439433 and LBQS00580155 were obtained using the Boller & Chivens Spectrograph (B&C) on the Clay telescope in September 2002. The camera has a pixel scale of 0.25 arcsec at the Nasmyth focus. We used a 1.2 arcsec slit with a 600 l/mm grating for a dispersion of 1.6 Å per pixel, and the same slit width with a 1200 l/mm grating for a dispersion of 0.8 Å per pixel. An order-blocking filter was inserted to exclude photons at wavelength . For each slit setup in low-resolution mode, we aligned the slit along the parallactic angle to reduce differential slit loss due to atmospheric refraction. In high-resolution mode, we aligned the slit along the major axis of disk galaxies to obtain spatially resolved emission features. The observations were carried out in a series of two to three exposures of between 600 and 1200 s each, and no dither was applied between individual exposures. Calibration frames for flat-field correction and wavelength solutions were taken immediately before or after each set of science exposures using a flat screen in front of the secondary mirror. For the absorbing galaxy toward PKS0439433, we set the grating at two tilt angles to cover a wavelength range from 3900 Å through 7500 Å in low-resolution mode. A spectrophotometric standard star was observed at the beginning and the end of each night for relative flux calibration.
2.2 MMT Observations
Long-slit spectra of the absorbing galaxies toward Q0738313, Q0809483, AO 0235164 and B2 0827243 were obtained using the Blue Channel in the MMT Spectrograph on the MMT in December 2003. The camera has a pixel scale of 0.3 arcsec at the Cassegrain focus of the telescope. We used a 1 arcsec slit with a 500 l/mm grating to obtain a dispersion of 1.2 Å per pixel and with a 1200 l/mm grating to obtain a dispersion of 0.5 Å per pixel. For each slit setup, we align the slit along the parallactic angle in low-resolution mode and along the major axis of disk galaxies in high-resolution mode. The observations were carried out in a series of three to four exposures of between 1200 and 1800 s each, and no dither was applied between individual exposures. Calibration frames for flat-field correction and wavelength solutions were taken immediately after each set of science exposures using an internal quartz lamp. For the absorbing galaxy toward Q0738313, we set the grating at two tilt angles to cover a wavelength range from 3900 Å through 8200 Å. For the Q0809483 sightline, the background QSO light was blended in the slit. We placed the slit on the QSO and obtained a 300-s exposure. This frame was used to subtract the contaminating QSO light from the galaxy spectrum in the subsequent analysis. A spectrophotometric standard was observed at the beginning and the end of each night for flux calibration.
2.3 Reduction of Galaxy Spectra
All the spectroscopic data were processed following the standard data reduction procedures. Individual CCD frames were first bias subtracted using available IRAF tasks and flattened using a median image of three spectroscopic flat frames obtained for each pointing. For low-resolution spectra, a single spectrum was extracted and wavelength calibrated from each exposure. By using skylines in our science exposures the wavelength zero-point calibration was accurate to better than 0.5 Å. Wavelengths were further corrected to vacuum and heliocentric for comparisons with absorption-line measurements.
Individual, extracted spectra were stacked to form a combined spectrum after rejecting deviant pixels. The stacked spectra were calibrated to an absolute flux scale using the sensitivity function derived from the spectrophotometric standards observed in each night. No corrections for slit losses as a result of a finite slit width was applied. Consequently, the emission line fluxes may be underestimated using these spectra, but relative line flux ratios should be accurate. Comparisons of the continuum fluxes between blue and red grating tilts in the spectra obtained for PKS0439433 and Q0738313 showed that the flux calibrations are consistent to within 5%. Finally, we corrected for the telluric A- and B-band absorption features at 7600 Å and 6870 Å in each stacked galaxy spectrum, using the much higher signal-to-noise ratio spectra of the spectrophotometric standards.
For the high-resolution spectra, individual frames were first registered using the continua and emission-line features and then stacked to form a combined two-dimensional spectrum. We first applied a low-order polynomial fit along the dispersion direction to remove the continua of the galaxy (and in the case of Q0809483 the background QSO). Extended emission features due to H for PKS0439433 and [O II] for Q0809483 and B2 0827243 became prominent. We extracted one-dimensional spectra around the targeted emission features from individual rows, and estimated the line centroid per spectrum by fitting a Gaussian profile to the data to determine a velocity offset of the emission-line region along the slit. Adjacent spectra were correlated between one another due to atmospheric seeing, and therefore the observed inner slope of the rotation curves of the galaxies is expected to be shallower than the intrinsic shape. Nevertheless, the observations allow us to compare for each system the relative kinematics between the ionized gas of the ISM and the neutral gas of the absorber along the disk and to determine the disk rotation speed.
2.4 HST Observations
PKS0439433 was first observed with HST using FOS and the G190H and G270H gratings, as part of the Quasar Absorption Line Key Project (Bahcall et al. 1993). A combined FOS spectrum of the QSO covering Å (Evans & Koratkar 2004) was retrieved from the HST archive for absorption line analysis. The combined spectrum has a dispersion of Å per pixel and a mean signal-to-noise ratio (SNR) of per resolution element between 2500 Å and 2900 Å, where we expect to detect the Fe II transitions from the DLA at . A single spectrum of the QSO, covering Å, was later obtained using STIS and the G140L grating for a total exposure time of 2510 s. We retrieved the extracted one-dimensional spectrum from the HST archive for an accurate measurement of . The spectrum has a dispersion of 1.6 Å per pixel and a mean SNR of per resolution element between 1250 Å and 1400 Å, where we expect to detect the transition of the absorber.
AO 0235164 was observed with HST using STIS the G430L and G750L gratings, each in single exposures. Additional spectra were obtained using STIS and the G230L grating to cover a broad spectral range from ultraviolet through optical wavelengths. A series of five exposures were obtained in the G230L setup. Individual one-dimensional spectra were coadded to form an averaged spectrum and a 1 error array using our own reduction program. The single spectrum obtained with the G430L grating has a dispersion of 2.6 Å per pixel and a mean SNR of at 3600 Å and at 3900 Å, where we expect to identify a series of metal absorption lines such as Fe II and Mn II.
3 SPECTRAL PROPERTIES OF INDIVIDUAL DLAS
In this section we discuss each of the six DLA systems individually and compare the properties of the neutral gas with the ISM properties of the absorbing galaxy, including kinematics and chemical abundances. We have obtained Fe abundance measurements for the DLA systems toward PKS0439433 and AO 0235164, using available ultraviolet spectra from the HST archive. We have also measured a precise redshift of the absorbing galaxies using a analysis that compares the observed galaxy spectrum with models established from a linear combination of four principle-component spectra derived from the Sloan Digital Sky Survey galaxy sample111See http://spectro.princeton.edu/..
3.1 The DLA at Toward PKS0439433
The strong metal-line absorber at toward PKS0439433 has been discussed in detail by Chen & Lanzetta (2003). The system was estimated to have based on an X-ray spectrum of the QSO by Wilkes et al. (1992). A disk galaxy was found at the redshift of the DLA, kpc projected distance away from the QSO line of sight.
3.1.1 Properties of The Neutral Gas
The measured from X-ray observations has a large uncertainty because of uncertain foreground hydrogen column density along the line of sight in the Galaxy. We have used the ultraviolet spectra of the QSO from HST FOS and STIS over 1120–3200 Å to improve the accuracy of the measurement, as well as to estimate the Fe II column density, .
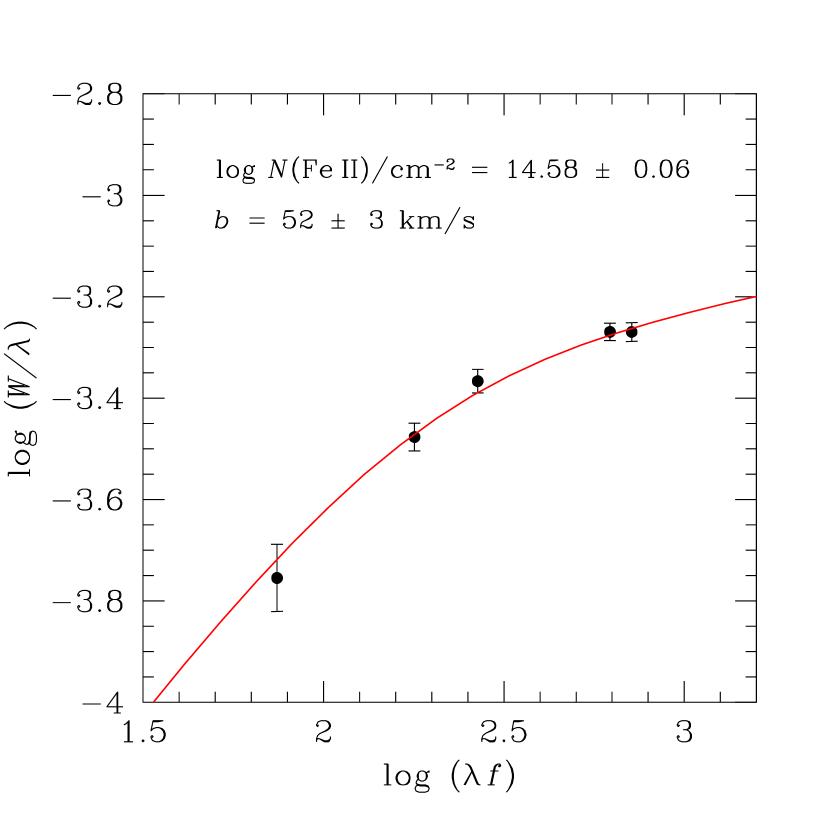
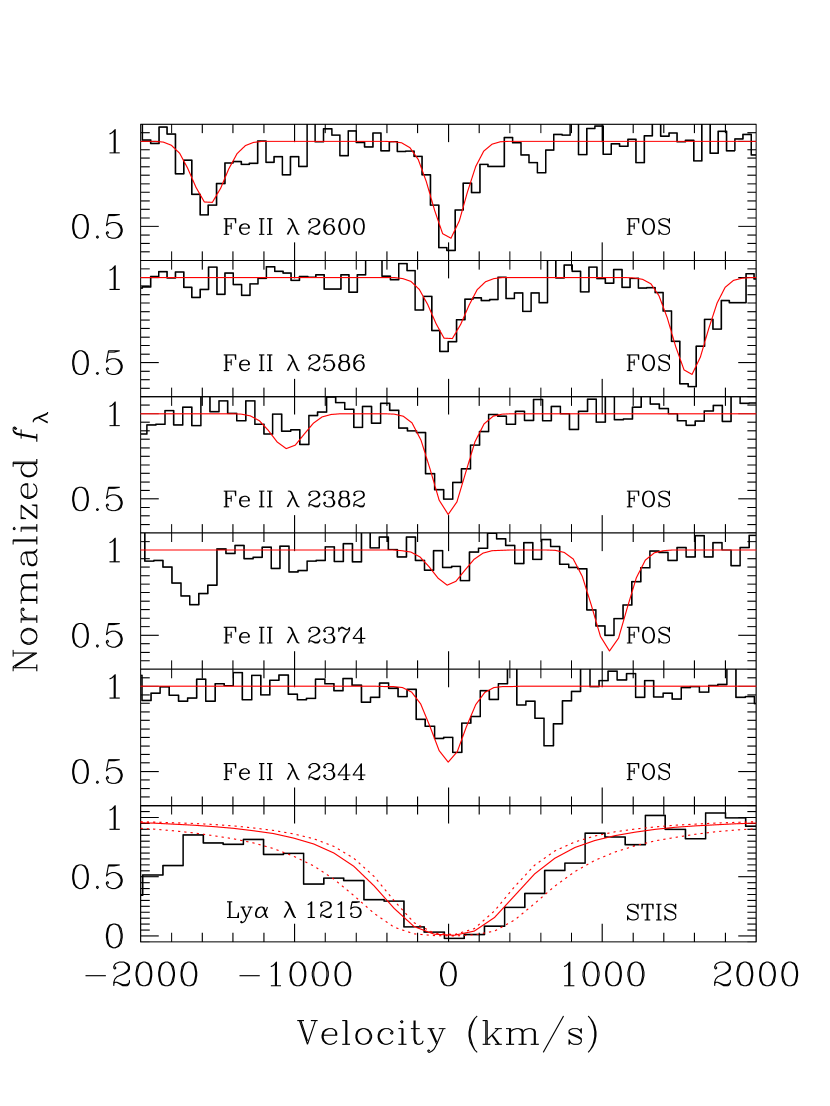
We first estimated and the velocity width of Fe II based on the absorption equivalent widths of five Fe II transitions published in Bechtold et al. (2002). The results from a curve-of-growth analysis are presented in Figure 2. We derived a best-fit for a velocity width of . The errors represent the 95% confidence interval. The large best-fit suggests that there are multiple absorbing components in the gaseous cloud that are not resolved in the low-resolution FOS data. The top five panels of Figure 3 shows a comparison between the five observed Fe II absorption profiles and Voigt models produced using the best-fit , , and the respective oscillator strengths. Despite the low resolution of the QSO spectrum, our Fe II column density estimate based on a curve-of-growth analysis is correct (Jenkins 1986).
Next we analyzed the STIS G140L spectrum of the QSO for estimating . A close examination of the hydrogen absorption profiles of the Galaxy and of the DLA at shows non-zero fluxes in the cores of the lines, suggesting a background subtraction error in the spectrum extraction pipeline. We applied a zeroth-order correction to the flux level in order to force zero fluxes in the core of the two damped absorbers, and derived a best-fit using the VPFIT222http://www.ast.cam.ac.uk/~rfc/vpfit.html software package.
The revised H I column density measurement places this absorber outside the canonical threshold of DLAs. We performed a simple photoionization analysis using the CLOUDY software package (Ferland 2001) to evaluate the ionization state of the absorbing gas. Adopting a nominal background ionizing photon flux at 912 Å, ergs sec-1 cm-2 Hz-1 Sr-1 at (Scott et al. 2002), we found that the absorber may be characterized by an ionization fraction for a hydrogen number density cm-3. Our photoionization analysis indicates that at the absorbing gas is likely to remain mostly neutral even with a lower , primarily because the metagalactic ionizing radiation field is nearly an order of magnitude weaker at than it was at (Scott et al. 2000). We therefore include this absorber in our DLA sample.
Finally, we combined the and measurements to derive 333 on the assumption that all iron is singly ionized and in neutral gaseous clouds (e.g. Vladilo et al. 2001; Prochaska et al. 2002). The observed Fe abundance indicates solar metallicity in the DLA, but the actual metallicity of the neutral gas is expected to be higher because Fe is susceptible to dust depletion. Using a sample of 46 DLAs with available Zn and Fe abundance measurements (Pettini et al. 2000; Prochaska et al. 2003b), we obtained a median , where the error represents the 1- dispersion of the sample. Because Zn is essentially undepleted in the ISM of the Galaxy, we derived a metallicity for the DLA at toward PKS0439433 based on the measurement and the median ratio.
3.1.2 ISM Properties of The Absorbing Galaxy
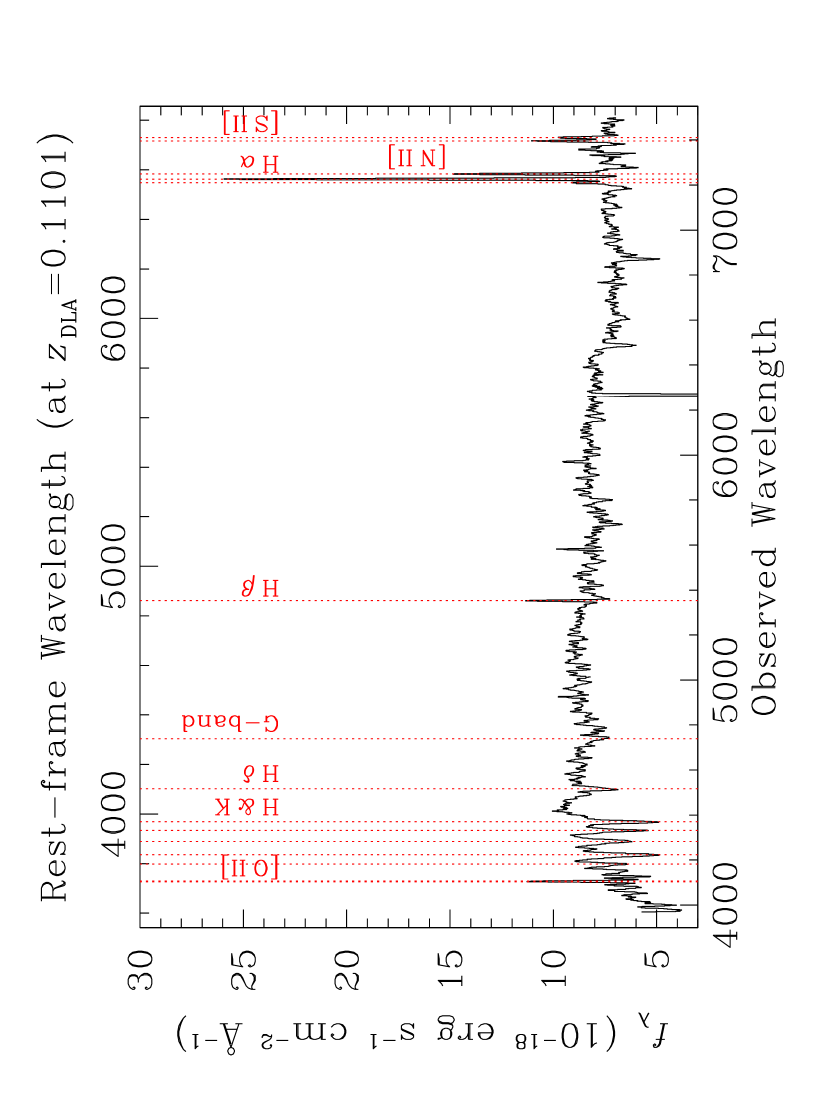
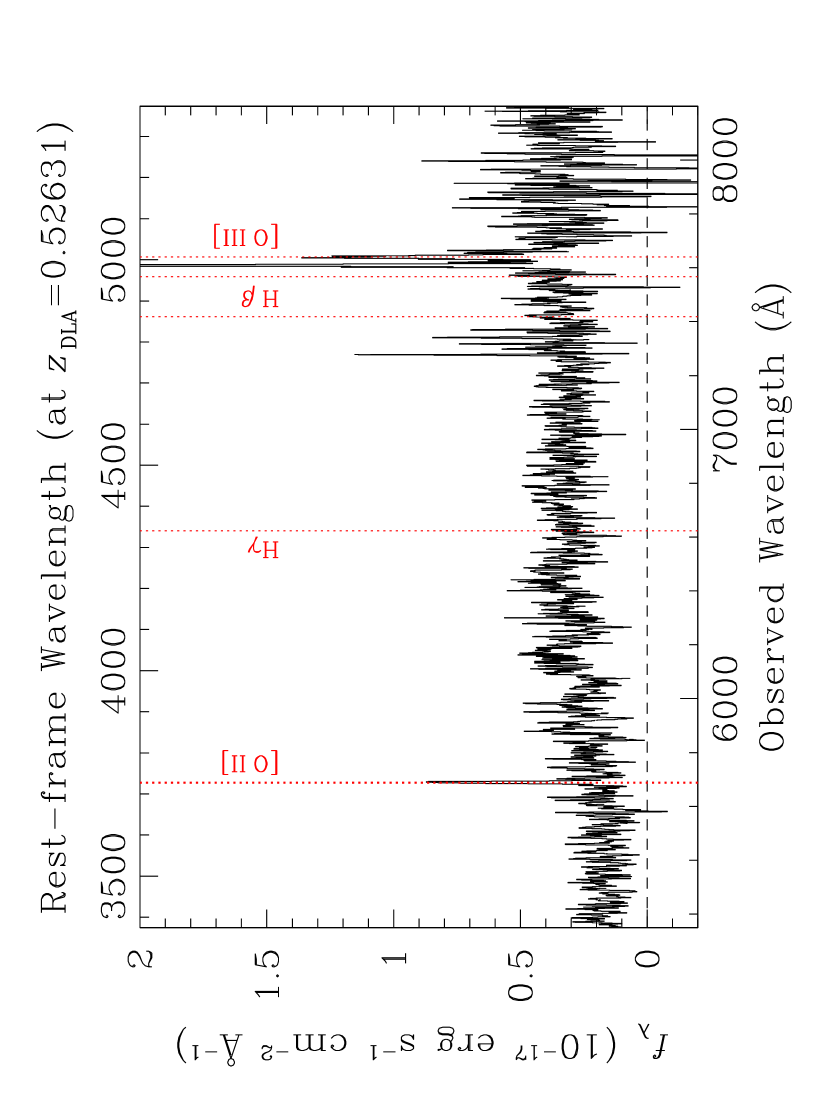
The summed, extracted spectrum of the absorbing galaxy presented in Figure 4 displays multiple emission and absorption features that suggest a young stellar population and metal-enriched ISM. The spectrum covers 3550–6850 Å in the rest frame of the galaxy and shows [O II], H, H, [N II], and [S II] emission features as well as G-band, Ca II H&K, and Balmer absorption line series, typical of what is seen in an intermediate-type disk galaxy. We present line flux measurements and corresponding errors of the identified emission features in Table 4. The listed H and H line fluxes have been corrected for stellar absorption by comparing the observed spectrum with theoretical models produced by the Bruzual & Charlot (2003) stellar population synthesis code. The redshift of the galaxy is , km s-1 away from the redshift of the DLA.
We examined the nature of the emission line region in the ISM using various spectral diagnostics. First, we estimated the amount of dust extinction internal to the absorbing galaxy using the observed H and H line flux ratio. We derived a color excess , following the formula presented in Calzetti, Kinney, & Storchi-Bergmann (1994). The Galactic extinction toward the sightline is (Schlegel, Finkbeiner, & Davis 1998), which is negligible in comparison to our derived color excess. We therefore attributed all of the observed reddening to the absorbing galaxy, and corrected the observed line flux measurements using a Galactic extinction law (Cardelli, Clayton, & Mathis 1989). The extinction corrected emission-line luminosity is listed in the last column of Table 4.
In order to characterize the type of line emission, we measured the extinction corrected [O III] 5007/H and [N II] 6583/H line ratios. We found [O III] 5007/H and [N II] 6583/H. These flux ratios are consistent with those measured for local H II regions, indicating that star formation, not AGN activity, is the dominating mechanism for producing these spectral features (Baldwin, Phillips, & Terlevich 1981; Kennicutt & Garnett 1996). We also measured an extinction corrected [N II] 6584/[O II] 3726,3729 line ratio and the ([O II] [O III] )/H index. We found [N II] 6584/[O II] and . These numbers together indicate that these emission features originate in stellar photoionized H II regions.
Finally, we determined the interstellar oxygen abundance of the absorbing galaxy using several emission-line calibrators. We first adopted the semi-empirical correlation between and [N II]/H from Pettini & Pagel (2004) and derived 444In the same paper, Pettini & Pagel also drew attention to the index as an alternative for estimating the oxygen abundance in high-metallicity regime (greater than solar). Adopting the index, we derived for the ISM of the absorbing galaxy. The result clearly shows that the ISM is metal rich. The observed [N II]/H ratio places the galaxy on the upper branch of the -metallicity relation. Using the calibration of McGaugh (1991), parameterized by Kobulnicky, Kennicutt, & Pizagno (1999), we found , where the error is dominated by the uncertainty of the calibrator as reported by these authors. In summary, we found that the ISM of the DLA galaxy has been enriched to at least solar abundance and perhaps three times higher555We have adopted the revised oxygen abundance for the Sun, (Allende-Prieto, Lambert, & Asplund 2001; Asplund et al. 2004)..
Comparison of the metallicities measured in the ISM and the neutral gas at kpc shows an abundance decrement along the disk of the galaxy (see § 4.2 for discussions on possible systematic uncertainties). A large metallicity gradient is often observed in local disk galaxies (e.g. Zaritsky, Kennicutt, & Huchra 1994; Kennicutt, Bresolin, Garnett 2003), but has not been confirmed in DLA galaxies (e.g. Schulte-Ladbeck et al. 2004).
3.1.3 Kinematic Properties of The DLA
A rotation curve analysis of DLA galaxies allows us to examine the kinematics of the ISM and compare the motion of the absorber relative to the absorbing galaxy. To measure the rotation curve of the absorbing galaxy toward PKS0439433 along the stellar disk, we first analyzed the surface brightness profile observed in a -band image from Chen & Lanzetta (2003). We found that the stellar disk can be characterized with an inclination angle degrees and a position angle of the major axis degrees, measured north through east. Next, we measured the observed velocity shear as a function of projected distance from the center of the galaxy, using the spatially resolved H emission feature. Finally, the observed rotation distribution was deprojected to the plane along the stellar disk by converting to galactocentric radius following
| (1) |
and by converting to rotation speed along the disk following
| (2) |
where is the slit orientation angle measured north through east. The long-slit spectroscopic observations were carried out with the slit aligned along the major axis, i.e. . We therefore have and , when deprojecting the observed rotation velocities determined from emission-line measurements of the galaxy. Figure 5 shows the inclination corrected rotation curve, , in solid points measured for the absorbing galaxy.
The velocity offset between the DLA () and the systematic velocity of the absorbing galaxy () places an additional point at large galactocentric radius that allows us to examine the kinematic nature of the absorber. Figure 1 shows that the background QSO intersects the extended stellar disk at kpc and degrees, leading to kpc and km s-1 for the absorbing cloud. The errors include uncertainties in and of the stellar disk, as well as uncertainties in the wavelength calibration of the HST/FOS spectrum. The derived rotation velocity of the DLA is shown as the open circle in Figure 5. Comparison of the rotation motion of the stellar disk and the DLA shows that the absorbing cloud is moving along with the optical disk and suggests that the galaxy possesses an extended neutral gaseous disk to at least kpc radius.
3.2 The DLA at Toward Q0738313
The DLA system with at toward Q0738313 (OI363) was selected by the presence of a Mg II absorption doublet and confirmed with subsequent HST observations using FOS (Rao & Turnshek 1998). The absorbing cloud is also detected in 21 cm observations (Lane et al. 1998). No additional metal absorption features have been found with the absorber due to a lack of high spectral resolution data. Rao & Turnshek (1998) also reported the detection of a compact galaxy kpc away from the QSO line of sight with .
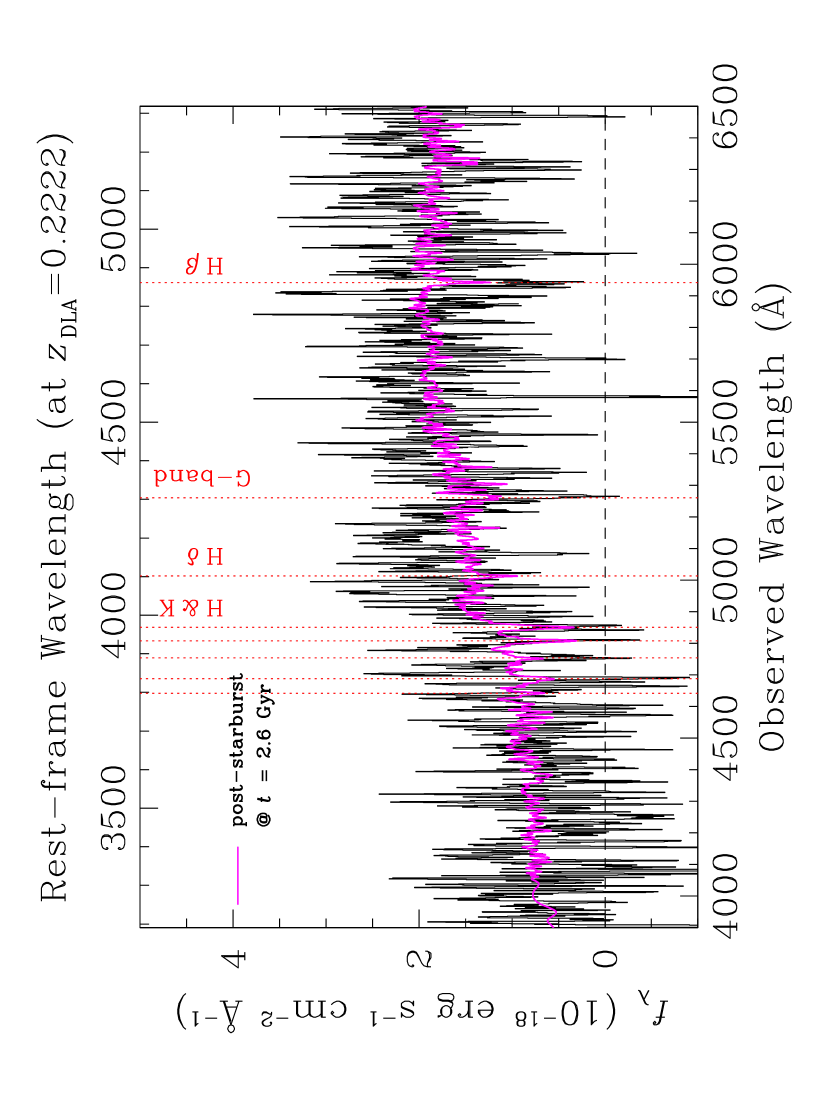
Figure 6 presents the summed, extracted spectrum, covering 3200–5300 Å in the rest frame of the galaxy. There are no obvious emission-line features but we do observe a pronounced flux discontinuity at 4000 Å, as well as strong absorption features from the G-band, Ca II H&K, and Balmer series transitions. We measured a upper limit over a resolution element ( Å) to the [O II] line flux at (Table 5). The lack of strong [O II] emission to this sensitive limit suggests that either the galaxy is fairly quiescent with little on-going star formation or it is heavily reddened by dust. The relatively flat spectral slope at rest-frame ultraviolet wavelengths and the strong 4000-Å discontinuity together argue against dust reddening. The redshift of the galaxy is , km s-1 away from the redshift of the DLA.
The fact that a pronounced 4000-Å flux discontinuity and strong Balmer series absorption dominate the spectral features of the galaxy also suggests that the last episode of star formation occurred in the recent past. We attempted to constrain the age of the youngest stellar population in the galaxy based on the observed absorption-line strengths. First, we generated a grid of Bruzual & Charlot (2003) model spectra at different ages, assuming a Salpeter initial mass function. The models spanned a range of star formation history from an instantaneous single burst to an exponentially declining star formation rate (SFR) history with an e-folding time of Gyr (typical dynamic time scale of an galaxy), and a range of metallicity from solar to solar.
Next, we performed a analysis, in which the probability that the observed galaxy spectrum is consistent with a model template at a given age is defined as the following,
| (3) |
where is the number of spectral elements, and are the observed flux and flux error in element , and is the corresponding predicted flux from model . Finally, we maximized with respect to stellar synthesis model at each given age to form and then maximized with respect to age to find the best-fit age . We found that the observed spectrum is best described by an exponentially declining SFR model with a solar metallicity and Gyr. The errors represent the 1- confidence interval over the models considered, and the best-fit model spectrum is presented in Figure 6 (magenta curve).
Two points are learned from the stellar population analysis. First, our analysis shows that the stellar population of the galaxy is best-described with a solar metallicity. Limiting the metallicity to solar does not produce a better fit and would increase the best-fit age to Gyr666At , the universe is 10.8 Gyr old for the adopted -cosmology and km s-1 Mpc-1. at , which suggests a formation redshift of and is therefore not likely to be true. Including dust reddening is likely to reduce the metallicity, but we note that a luminosity weighted metallicity of approximately solar is also expected from field populations (e.g. Jerjen, Binggeli, & Barazza 2004). Second, including errors in the best-fit age, our analysis shows that major star formation in the galaxy terminated at least 1.5 Gyr ago. On the other hand, the presence of a strong DLA indicates that the galaxy still possesses extended neutral gas, i.e. star forming reservoir. The lack of on-going star formation suggests that the DLA arises in a relatively warm neutral medium; this is consistent with the spin temperature ( K) derived from 21 cm observations for the absorber (Lane et al. 1998).
3.3 The DLA at Toward Q0809483
The DLA at toward Q0809483 was selected based on a 21 cm absorption line observed against the background radio-loud QSO (Brown & Mitchell 1983) and confirmed to have in subsequent HST spectroscopy using FOS (Boissé et al. 1998). No additional metal absorption features have been found due to the limited spectral resolution and sensitivity of the data. A spiral galaxy away from the QSO line of sight with has been reported as a candidate host galaxy for the DLA by Le Brun et al. (1997).
3.3.1 ISM Properties of The Absorbing Galaxy
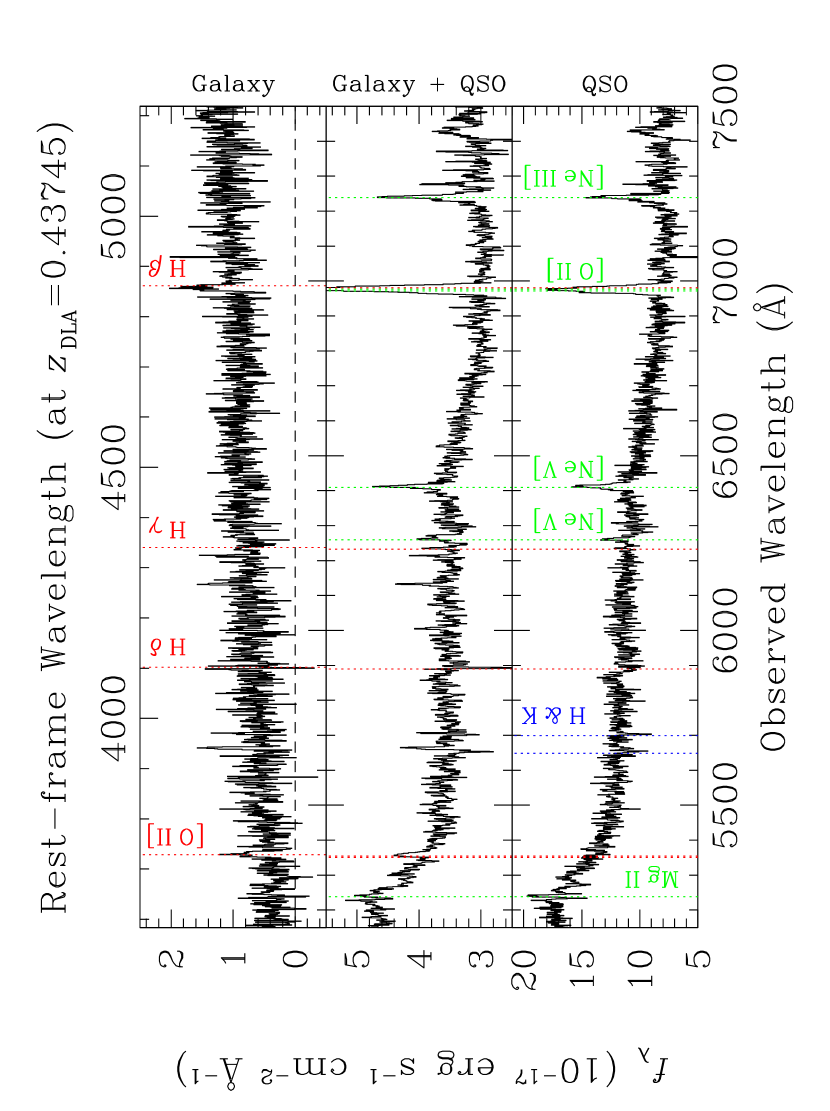
We have extracted a spectrum of the candidate DLA galaxy, and a separate spectrum taken at the QSO. Both spectra cover 3600–5200 Å at . As it turned out, not only is the galaxy spectrum contaminated by the QSO light, but the H feature expected at of the galaxy coincides with the [O II] emission feature of the background QSO at . It became necessary to subtract the blended QSO light before proceeding with further analysis.
To estimate the amount of contaminating QSO light, we first compared the line fluxes observed in various features originating in the QSO. The bottom two panels of Figure 7 show the summed, extracted spectra of the absorbing galaxy and the background QSO. The [Ne V] doublet and [Ne III] emission line from the QSO are apparent in both panels, in addition to the broad Mg II emission. We adopted the QSO spectrum as a template and rescaled it to fit the Ne line fluxes observed in the contaminated galaxy spectrum. The difference spectrum is presented in the top panel of Figure 7. It shows that both the broad-band QSO features and narrow Ne emission lines are no longer present, leaving an emission-line dominated spectrum typical of a star-forming galaxy. The residual fluxes in the difference spectrum at the locations of all the neon transitions are consistent with zero line fluxes, lending strong confidence in the detection of the H emission line in the difference spectrum.
The redshift of the galaxy is , km s-1 away from the redshift of the DLA. We have confirmed the identification of the galaxy as the DLA host. At this redshift, the galaxy is kpc from the QSO line of sight and has .
We measured line fluxes for [O II] and H, and placed a upper limit over a resolution element ( Å) on the [O III] line fluxes. The results are listed in Table 6. We were unable to assess the dust content using the H and H line ratio. In the absence of dust obscuration, we derived an upper limit to the index for metallicity estimate and found . This constrains the oxygen abundance in the ISM of the galaxy to be for the upper branch in the metallicity- correlation or for the lower branch (Kobulnicky, Kennicutt, & Pizagno 1999). Taking into account that the [O III] lines are weak (not detected), we consider the low metallicity solution unlikely and conclude that the ISM of the galaxy has an oxygen abundance of or twice solar. The high metallicity of the ISM is also supported by the luminosity-metallicity relation observed in nearby spiral galaxies (Kobulnicky & Zaritsky 1999).
Finally, we note that narrow Ca II H&K absorption doublet at is observed in the spectrum of the background QSO at km s-1 from the systematic redshift of the galaxy. The Ca II absorber appears to be moving in the same direction with the DLA along the optical disk (see discussion in the next section) but has a substantial velocity lag along the line of sight (in comparison to km s-1 of the DLA with respect to the galaxy). Cold gas traced by Ca II is commonly observed in the local ISM and in the Galactic halo (e.g. Welty, Morton, & Hobbs 1996), and exhibits complex velocity structures. A large fraction of the Ca II clouds are known to originate in high Galactic latitude (e.g. Sembach & Danks 1994). One possibility is that the Ca II absorber arises in a high velocity cloud in the halo of the DLA galaxy (Rauch et al. 2002).
3.3.2 Kinematic Properties of The DLA
To measure the rotation curve of the absorbing galaxy toward Q0809483 along the stellar disk, we first analyzed the surface brightness profile observed in an HST/WFPC2 image taken with the F702W filter (Figure 1). We found that the stellar disk can be characterized with an inclination angle degrees and a position angle of the major axis degrees, measured north through east. Next, we measured the observed velocity shear as a function of projected distance from the center of the galaxy, using the spatially and spectrally resolved [O II] emission doublet. Following the steps described in § 3.1.3, we measured a rotation curve of the galaxy deprojected to the stellar disk. The results are presented in Figure 8. Due to the proximity of the galaxy to the QSO and the low surface brightness of the emission-line feature, we were able to measure accurate velocity shear at three positions along the disk.
The velocity offset between the DLA and the systematic velocity of the absorbing galaxy places an additional point at large galactocentric radius. Figure 1 shows that the background QSO intersects the extended stellar disk at kpc and degrees, leading to kpc and km s-1 for the absorbing cloud. The errors include uncertainties in and of the stellar disk. The derived rotation velocity of the DLA is shown as the open circle in Figure 8. Comparison of the rotation motion of the optical disk and the DLA shows that the DLA is moving along the direction expected from extrapolating the rotation curve of the inner disk and suggests that the neutral gas extends to at least kpc radius along the disk.
3.4 The DLA at Toward AO 0235164
The DLA at toward AO 0235164 has been discussed in detail by Chen & Lanzetta (2003). It was selected based on 21 cm absorption and confirmed to have in subsequent HST spectroscopy using STIS (Junkkarinen et al. 2004). An active galaxy was found at the redshift of the DLA, kpc from the QSO line of sight (Burbidge et al. 1996), but high spatial resolution images from HST/WFPC2 also revealed complex morphology of the galaxy (Chen & Lanzetta 2003). Figure 1 shows two compact sources embedded in an extended nebular with the second source kpc from the QSO.
3.4.1 Properties of The Neutral Gas
Additional QSO spectra obtained using STIS/CCD with the G430L and G750L gratings are available from the HST archive. These data cover a spectral range from 2900 Å through 1 micron, allowing a detailed analysis of the metal content of the DLA.
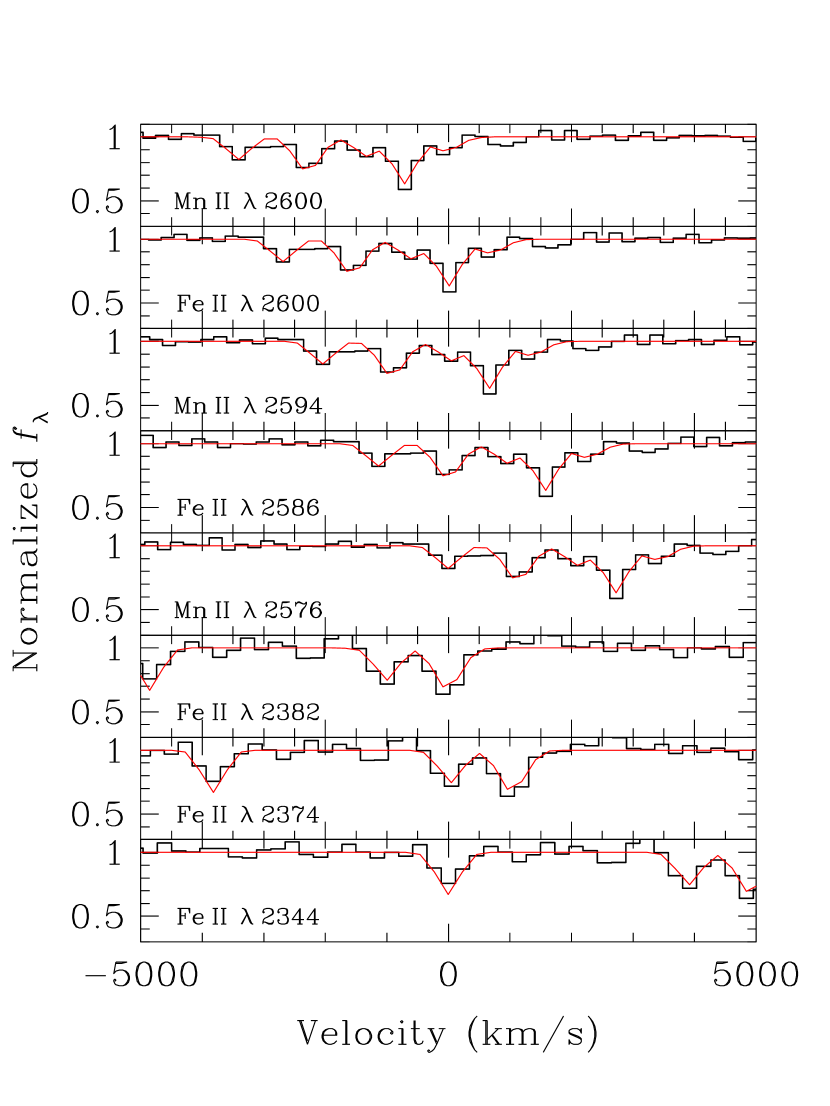
Fe II and Mn II absorption features are seen in the G430L spectrum. The absorption-line profiles of five Fe II transitions and three Mn II transitions are presented in Figure 9. We performed a simultaneous Voigt profile analysis to all the observed features, assuming that Fe II and Mn II originate in the same neutral gas region. We derived a best-fit for a velocity width of and . The errors represent the 1- confidence interval as derived from VPFIT. The large best-fit again suggests that there are multiple absorbing components in the gaseous cloud that are not resolved in the low-resolution FOS data. The best-fit Voigt profiles are shown in red curves in Figure 9 for comparison with the data.
Combining the and measurements, we derive on the assumption that all iron is singly ionized and in neutral gaseous clouds. The observed Fe abundance indicates that the DLA has only solar metallicity, but Fe is known to be susceptible to dust depletion and a prominent dust absorption feature at rest-frame 2175 Å has been observed in subsequent STIS spectroscopy. Junkkarinen et al. (2004) reported a color excess and a general extinction coefficient for the neutral gas. Following the prescription in Savaglio & Fall (2004) and adopting the Galactic dust-to-metal ratio, we derived a dust depletion correction of 1.2 dex for the Fe abundance, leading to a depletion-corrected metallicity of (or solar).
Turnshek et al. (2003) have presented metallicity measurements for the DLA toward AO 0235164 based on an X-ray spectrum of the QSO. To account for Galactic absorption in the X-ray data, these authors considered a range of Galactic gas metallicity models and derived a best-fit DLA metallicity of 0.24–0.64 solar. Our depletion-corrected measurement agrees well with the result of Turnshek et al. (2003) for the solar gas metallicity model.
3.4.2 ISM Properties of The Absorbing Galaxy
The galaxy environment of the DLA is fairly complex. In addition to the active galaxy at angular distance to the background QSO, a compact source at angular distance away from the QSO and with of the luminosity of the active galaxy (corresponding to ), has been identified at the redshift of the DLA in a deep HST/WFPC2 image (Figure 1).
The summed, extracted spectrum presented in Figure 10 displays multiple emission features that suggest a starburst or AGN environment. At the same time, it also displays a strong 4000-Å flux discontinuity, indicating an underlying old stellar population. The spectrum covers 3400–5300 Å in the rest frame of the galaxy and shows [Ne V], [O II], [O III], and H emission features. Line flux measurements of the identified emission features are presented in Table 7. The redshift of the galaxy is , km s-1 away from the redshift of the DLA.
We were unable to obtain an accurate estimate of dust extinction in the ISM of the galaxy due to the lack of spectral coverage over the H transition, but the observed H/H ratio suggests little/no dust extinction in galaxy. We continued our analysis, assuming no extinction correction. While the presence of [N V] 3425 requires a hard ionizing source and indicates the presence of an active nucleus, the observed strong line ratios [O III] 5007/H and [O II] 3727/H also suggest star formation not AGN activity as the dominant source for producing these spectral features (Rola, Terlevich, & Terlevich 1997). Our spectrum is therefore a blend of both components.
Assuming the strong lines largely originate in star forming regions, we estimated the oxygen abundance of the emission-line region using the index. We measured , corresponding to or 6.7 according to the analytic formula in Kobulnicky et al. (1999). The double values in the predicted oxygen abundance differ by nearly two orders of magnitude. We found the higher value to be more plausible, taking into account the luminosity-metallicity correlation observed in field emission-line galaxies (e.g. Kobulnicky & Zaritsky 1999), and concluded that the ISM of the galaxy has % solar metallicity. The observed ISM metallicity appears to be 0.45 dex higher than the metallicity estimated for the neutral gas at kpc, showing a trend of lower metallicity at larger galactic radii but with a large uncertainty.
3.5 The DLA at Toward B2 0827243
The strong metal-line absorber at toward B2 0827243 has been selected by the presence of a strong Mg II absorption doublet and confirmed to have in subsequent HST observations using FOS (Rao & Turnshek 2000). An edge-on disk galaxy has been identified at the redshift of the DLA, kpc projected distance away from the QSO line of sight (Steidel et al. 2002).
3.5.1 Properties of The Neutral Gas
The DLA exhibits a saturated Mg II doublet at with a rest-frame absorption equivalent width of 2.47 Å, among the strongest Mg II systems known (Steidel et al. 2002). A recent study of this sightline by Khare et al. (2004) presents observations of a series of strong Fe II and Mn II transitions of the DLA. These metal lines are resolved into two primary components in the moderate-resolution spectrum, separated by 50 km s-1. The estimated ionic column densities of the two components together are and . We combined the and ionic column densities to derive and , assuming a 1- error of 0.1 dex in .
Zinc is not observed in the moderate-resolution QSO spectrum, which prohibited us from obtaining an empirical estimate of dust depletion in the neutral gas. Nevertheless, the abundance measurements show that —consistent with solar, while Mn is frequently observed to be underabundant with respect to Fe in DLAs (e.g. Pettini et al. 2000; Dessauges-Zavadsky, Prochaska, & D’Odorico 2002). The observed is therefore suggestive of some dust depletion. We again adopted the median and the observed scatter (see § 3.1.1) to correct for dust depletion, and derived a metallicity for the DLA at toward B2 0827243.
3.5.2 ISM Properties of The Absorbing Galaxy
The summed, extracted spectrum of the DLA galaxy covers 3400–5400 Å and is presented in Figure 11. The galaxy displays multiple emission features such as [O II] and H, as well as a moderate 4000-Å spectral discontinuity. These spectral features indicate a combination of an evolved stellar population and ongoing star formation in the ISM of the DLA galaxy. Line flux measurements of the identified emission features are presented in Table 8. [O III] emission is not detected, so we present a 3- upper limit (over a resolution element Å) to the line flux. At the same time, the [O III] emission feature appear to be uncharacteristically strong. But because this feature coincides with the telluric A-band absorption, the observed emission-line flux is subject to a large systematic uncertainty after correcting for the atmosphere absorption. The line luminosity of [O III] in Table 8 is therefore derived based on the expected 1:3 line flux ratio between the two [O III] forbidden transitions and the observed limit to the [O III] line luminosity. The redshift of the galaxy is .
We were unable to assess the dust content because of a lack of spectral coverage of the H emission line. In the absence of dust obscuration, we derived an upper limit to the metallicity index and found . Given the luminous nature of the galaxy (), we again adopted the upper branch of the metallicity- correlation and derived a lower limit to the oxygen abundance which is more than the typical solar value. This galaxy is the third system in our sample that shows a higher metallicity in the inner disk ISM than one estimated in the neutral gas in the outskirt of the gaseous disk.
3.5.3 Kinematic Properties of The DLA
The kinematic properties of this DLA galaxy have been studied by Steidel et al. (2002). They presented a rotation curve of the edge-on optical disk and compared with the associated Mg II absorption profile observed in echelle mode. The velocity offset between the DLA and the systematic velocity of the absorbing galaxy places an additional point at large galactocentric radius. Figure 12 shows that the background QSO intersects the extended optical disk at kpc with a lag in velocity km s-1 for the absorbing cloud. No correction has been made for the disk orientation because of its edge-on nature and because the QSO sightline coincides with the extension of the edge-on disk (see Figure 1) The derived rotation velocity of the DLA is shown as the open star in Figure 12. Comparison of the rotation motion of the stellar disk and the DLA shows that the DLA is moving along with the optical disk and suggests that the neutral gas extends to at least kpc radius along the disk.
3.6 The DLA at Toward LBQS00580155
The DLA at toward LBQS00580155 was first discovered by Pettini et al. (2000) with in an HST/FOS spectrum. A detailed study of chemical abundances of the absorber by these authors showed that the absorbing gas has near-solar metallicity, . A candidate absorbing galaxy at angular distance away from the QSO was also found in a deep HST/WFPC2 image of the field (Figure 1).
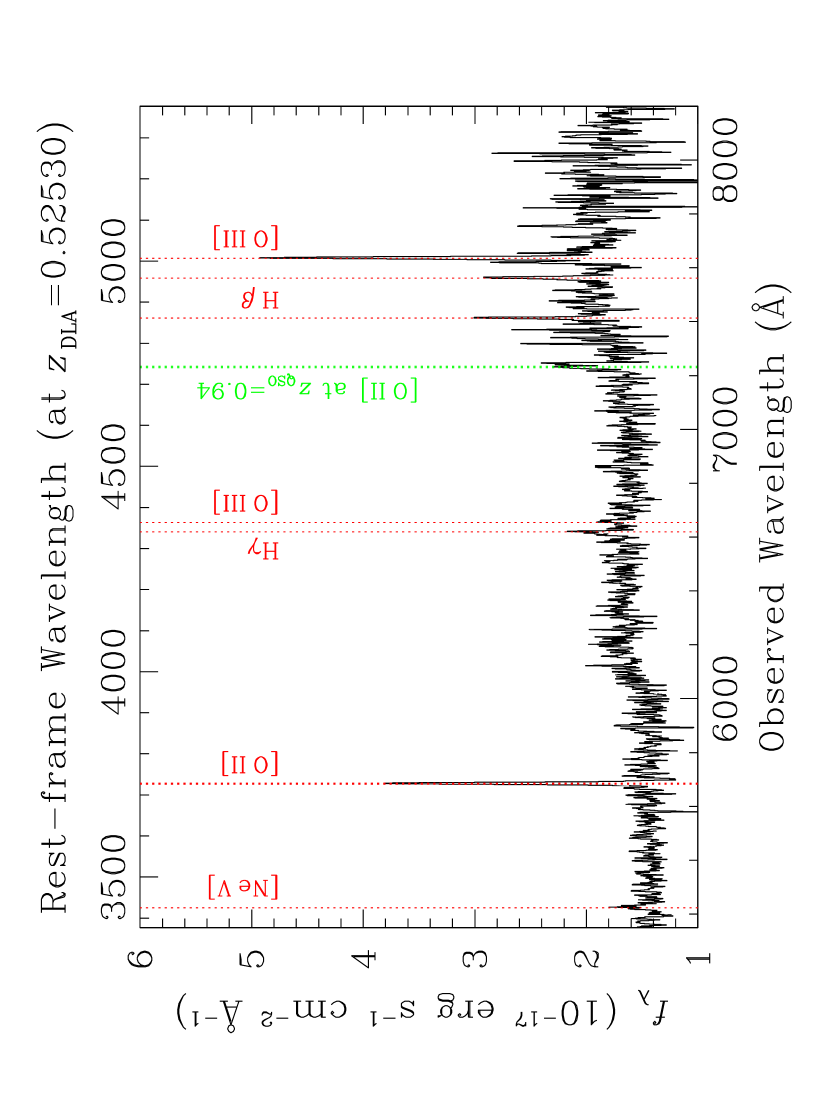
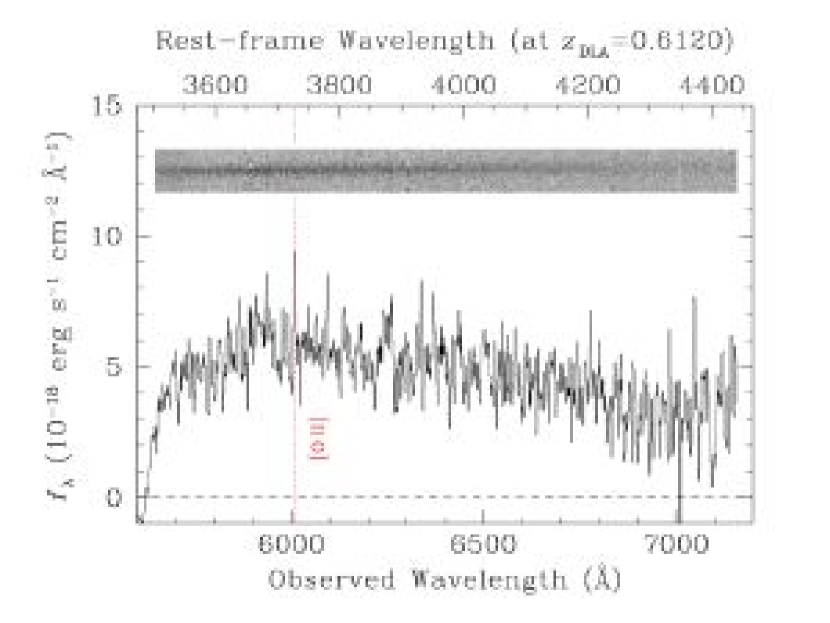
The summed, extracted spectrum of the candidate galaxy, covering a rest-frame wavelength range from 3500 Å through 4450 Å is presented in Figure 13. Only a weak emission feature is identified in the spectrum, which is evident in the two-dimensional spectral image presented in the inset of Figure 13. Identifying the line as [O II] led to an estimate of , km s-1 away from the redshift of the DLA. The galaxy is confirmed to be responsible for the DLA. At this redshift, the galaxy is kpc from the QSO line of sight and has .
4 DISCUSSION
We have obtained and analyzed optical spectra of six DLA galaxies at . These galaxies exhibit a range of ISM properties, from post-starburst (Q0738313) through normal disks (PKS0439433, Q0809483, and B2 0827243) and through starburst (AO 0235164). Their ISM properties support the idea that DLA galaxies are drawn from the typical field population, and not from a separate population of low surface brightness or dwarf galaxies. A summary of measurable physical parameters of the absorbing galaxies is listed in Table 10, where we present from columns (2) through (8) the galaxy redshift , projected distance , absolute -band magnitude , rotation velocity , dynamic mass , and oxygen abundance .
We have also analyzed ultraviolet spectra of the DLA systems toward PKS0439433 and AO 0235164 for estimating metallicity in the neutral gas clouds. Supplementing our own measurements with available metallicity measurements in the literature, we have collected six DLA systems at , for which metal abundances of the gaseous clouds are measured and can be compared directly with the physical properties of the absorbing galaxies. A summary of measurable parameters of the neutral gas is also listed in Table 10, where we present from columns (9) through (12) the absorber redshift , column density measurements and associated errors for H I and Fe II, and dust-depletion corrected metallicity in the neutral gas 777The gas metallicity is defined as , where X represents dust depletion-corrected metal abundances.. We have included the DLA at toward HE11221649 and the DLA at toward EX03022223 in Table 10. Photometric properties of the absorbing galaxies are measured by Chen & Lanzetta (2003). Metal abundances of the absorbers are measured by Ledoux, Bergeron, & Petitjean (2002) for the DLA system toward HE11221649 and by Pettini et al. (2000) for the DLA system toward EX0302223.
The galaxy sample presented in Table 10 can be adopted to address two important issues. In this section, we discuss in turn the Tully-Fisher relation of -selected galaxies at intermediate redshifts and abundances profiles of the galaxies. In particular, we investigate whether or not the low metal content of the DLA population arises naturally as a combination of gas cross-section selection and metallicity gradients.
4.1 The Tully-Fisher Relation
Four galaxies in the DLA galaxy sample presented here appear to have disk morphology (Figure 1). We have successfully extracted a rotation curve measurement along the major axis of the optical disk of the galaxies toward PKS0439433 (Figure 5), Q0809483 (Figure 8), and B2 0827243 (Figure 12). We note that the observed inner slope of these rotation curves is expected to be shallower than the intrinsic shape because of a “beam-smearing” effect caused by seeings that has not been removed from our data. Nevertheless, the observations allow us to compare the relative motions between the hot gas in the inner ISM and the neutral gaseous clouds at large galactocentric distances, and to obtain a robust measurement of the rotation speed of galaxy disks at intermediate redshifts. In all three cases, we observe consistent rotation motion between the optical disks and the neutral gaseous clouds. The results of our rotation curve study supports that galaxies with disk-like stellar morphologies at intermediate redshifts possess large rotating H I disk out to kpc, comparable to what is observed in local disk galaxies.
Our small DLA galaxy sample serves as raw material for a pilot study of the Tully-Fisher relation (Tully & Fisher 1977) of intermediate-redshift galaxies. We have estimated the terminal velocity of each disk based on a comparison of the redshifts of the absorber and galaxy, corrected for the inclination of the disk and the relative orientation of the QSO sightline along the disk (see § 3.1.3). Figures 5, 8, and 12 together show that the absorbers offer additional constraints in the disk rotation speed at distances that are more than twice beyond the extent of the optical disks. In particular, the rotation curves for the DLA galaxies toward PKS0439433 and B2 0827243 remain flat beyond the optical disks. We estimate the enclosed dynamic mass of each absorbing galaxy based on the terminal velocity measured at the location of the absorber ( kpc for the DLA toward PKS0439433; kpc for the DLA toward Q0809483; kpc for the DLA toward B2 0827243). The results are presented in column (7) of Table 10. Following , we find that these three DLA systems reside in massive halos of , comparable to those of Milky-Way type galaxies. We note that the three examples presented here are among the brightest of known DLA galaxies at , and our results do not exclude the possibility that some DLA systems reside in halos of smaller mass scales.
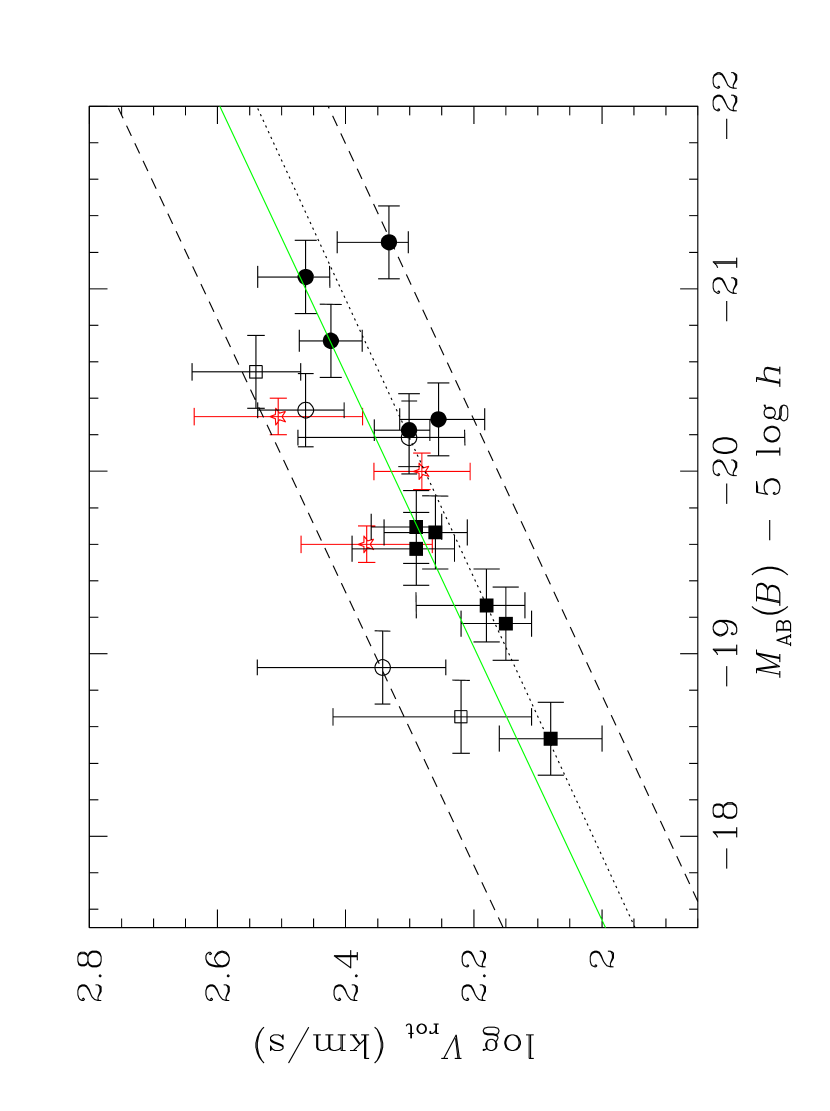
Figure 14 shows the Tully-Fisher relation of the DLA galaxies (open stars), in comparison to the best-fit -band relation derived from H I 21 cm velocity measurements of local galaxies (Pierce & Tully 1988, 1992; the solid line) and to a field sample of intermediate-redshift galaxies (Vogt et al. 1997; the dotted line). While the field galaxy sample—selected based on optical brightness—exhibits a moderate luminosity brightening of mag (Vogt et al. 1997), the DLA galaxy sample—selected based on —shows a brightening of mag for a fixed slope determined in the local -band relation, consistent with little/no evolution in the Tully-Fisher relation at similar redshift range.
4.2 Abundance Profiles
To investigate whether or not metallicity gradients exist in intermediate-redshift galaxies, we first compare abundance measurements of the ISM and the neutral gas in individual systems. Figure 15 shows the observed metallicities in the inner ISM of the galaxy and in the neutral gas at large galactic radius for three DLA systems in our sample (PKS0439433, AO 0235164, and B2 0827243). In each pair, we have adopted the oxygen abundance measured in the gas phase of the inner ISM and the Fe abundance for the neutral gas, corrected for dust depletion. All abundance measurements are normalized to their respective solar values. Note that the DLA toward AO 0235164 is presented at its projected distance to the absorbing galaxy, because the galaxy exhibits complex morphology that cannot be represented by a simple disk model.
We find in all three cases an abundance decrement by a factor of (or 0.45 – 0.7 dex) from the center of the galaxies to neutral gaseous clouds at kpc galactic radii, corresponding to a radial gradient ranging from to dex kpc-1. These values are consistent with the range of abundance gradients observed in local disk galaxies (Zaritsky et al. 1994). We note that although the ISM abundances are derived based on strong emission lines characteristic of star forming H II regions, the emission-line based abundance measurements are representative of the mean metal content of the local atomic and molecular phases as well888See Kennicutt et al. (2003) for a comparison of H II region abundances from Deharveng et al. (2000) and diffuse ISM abundances from Meyer, Jura, & Cardelli (1998) and Moos et al. (2002) in the Galaxy.. The results in Figure 15 suggest that these three DLA systems originate in the relatively unevolved outskirts of galactic disks.
There are, however, systematic uncertainties that may reduce the gradients seen in the three DLA galaxies presented in Figure 15. First, the strong-line “empirical” H II region abundance scale has been called into question recently, because direct abundance measurements based on electron temperature () sensitive auroral lines tend to give abundances that are systematically lower by 0.2–0.5 dex (e.g. Kennicutt et al. 2003; Bresolin et al. 2004). Such uncertainty has an impact on the interpretation of Figure 15, where the strong-line H II region abundances are being compared to absorption line abundances using completely different methods. If we would lower the H II region abundances shown in Figure 15 by 0.2–0.5 dex, the radial gradients would be reduced substantially in at least two of the three systems (B2 0827243 and AO 0235164). But it is unclear whether this correction should be applied in full. Recombination line abundances for Galactic H II regions yield results that are intermediate between the -based and strong-line values (e.g. Esteban et al. 1998). Moreover, we have not included a dust depletion correction in the oxygen abundance measurements for these two systems. Including depletion correction would increase the abundances by dex (e.g. Esteban et al. 1998).
Second, the fraction of Fe locked in dust is observed to be higher at higher metallicity regime, although there is a large scatter about the mean relation (e.g. Pettini et al. 1997; Prochaska et al. 2002). We have adopted a median [Zn/Fe] ratio to estimate a depletion correction for the DLA systems toward PKS0439433 and B2 0827243. The correction may be underestimated particularly for the DLA system toward PKS0439433, for which we have derived a dust-depletion corrected metallicity of nearly solar, . An underestimated Fe abundance would also reduce the abundance gradient observed in Figure 15 for the DLA system. To assess the systematic uncertainty due to metallicity-dependent dust-depletion correction, we adopt the empirical relation between depletion fraction and metallicity from Vladilo (2004) based on a study of 34 DLA systems that have observed Fe abundance ranging from to and dust-depletion corrected Fe abundance ranging from to . We derive a dust-depletion corrected to for the DLA system toward PKS0439433, but we note that the empirical relation of dust depletion correction by Vladilo is not well constrained by the data beyond . Comparing with the high-metallicity DLA systems in Vladilo’s sample, we find that the DLA system toward PKS0439433 is likely to have a dust-depletion corrected metallicity of between and 0.26, consistent with our previous estimate using a median [Zn/Fe] ratio to within errors. We therefore conclude that the systematic uncertainty due to metallicity-dependent dust-depletion correction is insignificant in the absorption-line abundance measurement for this DLA system.
Finally, the abundance gradients observed in Figure 15 is based on comparisons between oxygen and iron abundances with respect to the typical solar values, but it is not clear whether the (O/Fe) ratio is solar in the DLA systems. An abundance pattern with enhanced Fe would steepend the abundance gradients, and enhanced oxygen would reduce the gradients. While DLA systems show a large scatter in the observed around (Lu et al. 1996; Prochaska, Howk, & Wolfe 2003; D’Odorico & Molaro 2004), dwarf stars in the Galaxy show at and reach at (McWilliam 1997). We therefore conclude that a solar (O/Fe) ratio remains as a reasonable approximation for the abundance comparison in Figure 15.
To minimize the systematic uncertainties discussed above, we study metallicity gradients by considering only absorption-line abundances. We investigate whether there exists a statistical correlation between absorption-line metallicity and galaxy impact parameter using an ensemble of six galaxy-DLA pairs for which Fe abundance measurements in the absorbers are available. Given a mix of galaxy morphology, here we consider only the projected distances between the absorbers and the absorbing galaxies, rather than galactocentric radii. The goal is to establish a mean profile that characterizes the global distribution of metals in individual galaxies. Figure 16 shows the metallicity of neutral gas versus galaxy impact parameter for the five galaxy-DLA pairs. All measurements have been corrected for dust depletion. We find a declining trend of metallicities in neutral gaseous clouds with increasing impact parameter (open stars in Figure 16). The data are best described by a simple correlation,
| (4) |
which is represented by the solid line in Figure 16. The best-fit slope corresponds to a scale length of kpc. For comparison, we have also included in the figure the observed oxygen abundance gradient of M101 (Kennicutt et al. 2003) and the metallicity of intergalactic medium (IGM) from Prochaska et al. (2004). The IGM metallicity has been estimated based on five absorbers of at and is placed at impact parameter beyond kpc according to the versus correlation from Chen et al. (2001).
Equation (4) shows an anti-correlation between metallicities in the cold gas and galaxy impact parameter at the 3- level of significance, which applies to galaxy-DLA pairs within an impact parameter range of kpc. The slope of the abundance profile agrees well with the oxygen abundance gradient observed in the H II region of M101, although flat metallicity distributions are also observed in some nearby disk galaxies (e.g. Zaritsky et al. 1994). The agreement supports the idea that the DLA population traces galactic disks at intermediate redshifts. Figure 16 also suggests that at kpc the neutral gas phase metallicity may already be approaching the IGM abundance floor at . We note that including intrinsic -band luminosity of the absorbing galaxies does not improve the fit and shows little correlation between metallicity and galaxy luminosity using the small galaxy-absorber pair sample.
4.3 Implications for the Mean Metallicity of the DLA Population
Consistent results have been presented by different authors over the past few years to show that the mean metallicities observed in the DLA systems are only a tenth of the solar values at all redshifts that have been studied (e.g. Pettini et al. 1999; Prochaska et al. 2003a). At the same time, some fraction of DLA systems are known to arise in disk galaxies at intermediate redshifts (e.g. Rao et al. 2003; Chen & Lanzetta 2003; Lacy et al. 2003). While it is possible that the DLA systems are biased toward low-metallicity, low surface brightness galaxies (e.g. Schulte-Ladbeck et al. 2004), here we argue that the low metal content of the DLA population arises naturally as a combination of gas cross-section selection and metallicity gradients commonly observed in local disk galaxies (e.g. Zaritsky et al. 1994; Ferguson, Gallagher, & Wyse 1998; van Zee et al. 1998).
Adopting the radial gradient from equation (4), we proceed to construct a crude model for predicting the expected mean metallicity of the DLA population. We consider first a uniform distribution of H I gas. The probability of finding a DLA system arising in the impact parameter interval and for a gaseous halo of size is
| (5) |
The expected mean metallicity is then defined as
| (6) |
Applying equation (4) to equation (6) yields a gas cross-section weighted mean metallicity for kpc, which is equivalent to the expected mean metallicity over an ensemble of DLA systems under the assumption that all DLA galaxies share this global abundance profile. Our prediction is consistent with observations to within errors at , where the reported mean metallicity is (Prochaska et al. 2003a).
Next, we consider empirical H I profiles of local disk galaxies for calculating a -weighted mean metallicity of the DLA population. Lanzetta, Wolfe, & Turnshek (1995) have demonstrated that the cosmic metallicity associated with the DLA systems can be derived from calculating the column density weighted average of the metallicities of the individual absorbers. We perform a Monte-Carlo analysis for predicting the expected -weighted mean metallicity. First, we adopt the mean H I profiles of Sab, Sbc, and Scd galaxies from Cayatte et al. (1994) for the field galaxy sample published in Broeils & van Woerden (1994). Next, we form a sample of 100 DLA systems randomly drawn from different locations of the adopted H I disk profile, including the scatter in the mean profile () and the gas cross-section selection effect. Next, we assign a neutral gas metallicity at the location of each DLA systems, according to equation (4) with uncertainties included. Finally, we sum together all the metals found in the 100 absorbers and derive the expected -weighted mean metallicity.
The results of our Monte-Carlo simulations are presented in Figure 17 for three different types of galaxies. The top panels show for each galaxy type the distribution versus radius in the simulated sample of DLA systems. The bottom panels show their simulated metallicity distribution versus radius. In the lower-left corner of the bottom panels, we list mean metallicity and -weighted mean metallicity for each simulated DLA sample. In 1000 sets of simulations, we find a -weighted mean metallicity over 100 random sightlines, where the error marks the 95% uncertainty interval. The is in accord with from Prochaska et al. (2003a), but is marginally higher than , errors, from Kulkarni et al. (2004).
The difference between the two sets of -weighted mean metallicity measurements from Prochaska et al. and Kulkarni et al. arises mainly as a result of whether the DLA system toward AO 0235164 is included in the analysis. While x-ray absorption based metallicity measurement depends sensitively on how well the foreground absorption can be constrained, the measurement from Turnshek et al. (2003) agrees well with our UV-absorption line based measurement . The agreement therefore justifies the inclusion of the absorber toward AO 0235164 in the -weighted mean metallicity calculation by Prochaska et al.. The discrepancy resulted from inclusion or exclusion a single system in calculating the mean metallicity, however, signifies the large uncertainty associated with working with a small sample. We argue based on the Monte-Carlo simulations that to obtain a representative estimate of the cosmic mean metallicity in the neutral gas phase requires a sample of DLA systems collected from random lines of sight.
Finally, we draw attention to the scatter in metallicity displayed in Figure 17. Pettini et al. (1994) performed a similar simulation to study whether metallicity gradients could explain the large scatter observed among the abundance measurements of individual DLA systems at high redshift. These authors adopted oxygen abundance profiles of 13 nearby galaxies for which H I profiles are available. In all but one galaxy (M101), they were unable to reproduce the large observed abundance scatter. Our simulations show that over 100 random sightlines drawn from within a kpc radius, we expect a 1- (68%) scatter of 0.7 dex, comparable to what is observed in the DLA systems at (Prochaska et al. 2003a). The fact that we are able to reproduce the large scatter in our simulations adds further support for the scenario in which the low metallicities observed in the DLA systems arise naturally as a combination of gas cross-section and metallicity gradients. But whether or not the same scenario can be applied to explain the low metal content of the DLA systems at is not clear, because large gaseous disks of kpc radius may not exist at this early epoch.
In summary, our analysis demonstrates that metallicity gradients together with a gas cross-section selection can explain the low metallicities observed in the DLA systems at . It confirms that the low metal content of DLA systems does not rule out the possibility that the DLA population trace the field galaxy population. Whether or not the same scenario can be applied to the DLA systems at higher redshifts remains to be verified.
5 SUMMARY AND CONCLUSIONS
We have completed a spectroscopic study of six DLA systems at , based on moderate-to-high resolution spectra of the galaxies responsible for the absorbers. We present two new identifications of DLA galaxies (Q0809483 at and LBQS00580155 at ) and four DLA galaxies that are known previously (PKS0439433 at , Q0738313 at , AO 0235164 at , and B2 0827243 at ). We also present two new metallicity measurements of the absorbers for the DLA systems toward PKS0439433 and AO 0235164 based on the ultraviolet spectra of the background QSOs retrieved from the Hubble Space Telescope (HST) data archive.
Combining known metallicity measurements of the absorbers with known optical properties of the absorbing galaxies, we investigate whether or not the low metal content of the DLA population arises naturally as a combination of gas cross-section selection and metallicity gradients commonly observed in local disk galaxies. Furthermore, we study disk evolution based on a comparison of the Tully-Fisher relation of the DLA galaxies and those of field galaxies. The results of our study are summarized as follows:
1. The galaxies responsible for DLA systems exhibit a range of ISM properties, from post-starburst, to normal disks, and to starburst systems. Their ISM properties support the idea that DLA galaxies are drawn from the typical field population, and not from a separate population of low surface brightness or dwarf galaxies.
2. The low metal content of the DLA population arises naturally as a combination of gas cross-section weighted selection (which favors large radii) and a metallicity gradient.
3. Large rotating H I disks of radius kpc are common at intermediate redshifts. In addition, a rotation-curve study of three DLA galaxies shows that they reside in massive halos of , comparable to those of Milky-Way type galaxies rather than dwarfs
4. A comparison of the Tully-Fisher relation of three DLA galaxies and those of emission-line selected field samples shows little detectable evidence for evolution in the disk population between and .
5. We observe an abundance decrement by a factor of from the center of the galaxies to kpc galactocentric radius away for all three DLA systems that have abundance measurements both in the inner ISM of the galaxy (derived using the metallicity index) and in the neutral gas (derived according to a dust-depletion corrected Fe abundance). But including uncertainties in the empirical calibration of the index may reduce the abundance decrement for two of the three cases.
6. Using an ensemble of six galaxy-DLA pairs, we derive an abundance profile that can be characterized by a radial gradient of dex per kiloparsec over an impact parameter range of kpc or equivalently a scale length of kpc.
7. Adopting known profiles of nearby galaxies and the best-fit radial gradient, we further derive an -weighted mean metallicity over 100 random lines of sight for the DLA population, consistent with observed for DLA systems.
8. Monte-Carlo simulation results indicate that a sample of DLA systems drawn from random lines of sight is required for accurate estimates of the cosmic mean metallicity in the neutral gas phase.
References
- (1)
- (2) Albert, C. E., Blades, J. C., Morton, D. C., Lockman, F. J., Proulx, M., & Ferrarese, L. 1993, ApJS, 88, 81
- (3)
- (4) Allende-Prieto, C., Lambert, D. L., & Asplund, M. 2001, ApJ, 556, L63
- (5)
- (6) Asplund, M., Grevesse, N., Sauval, A. J., Allende Prieto, C., & Kiselman, D. 2004, A&A, 417, 751
- (7)
- (8) Bahcall, J. N., et al. 1993, ApJS, 87, 1
- (9)
- (10) Baldwin, J.A., Phillips, M.M., & Terlevich, R. 1981, PASP, 93, 5
- (11)
- (12) Bechtold, J., Dobrzycki, A., Wilden, B., Morita, M., Scott, J., Dobrzycka, D., Tran, K., & Aldcroft, T. L. 2002, ApJS, 140, 143
- (13)
- (14) Boissé, P., Le Brun, V., Bergeron, J., & Deharveng, J.-M. 1998, A&A, 333, 841
- (15)
- (16) Bowen, D.V., Tripp, T.M., & Jenkins, E.B. 2001, AJ, 121, 1456
- (17)
- (18) Bresolin, F., Garnett, D.R., & Kennicutt, R.C. 2004, ApJ, in press (astro-ph/0407065)
- (19)
- (20) Broeils, A.H., & van Woerden, H. 1994, A&AS, 107, 129
- (21)
- (22) Brown, R.L. & Mitchell, K.J. 1983, ApJ, 264, 87
- (23)
- (24) Bruzual, G. & Charlot, S. 2003, MNRAS, 344, 1000
- (25)
- (26) Burbidge, E.M., Caldwell, R.D., Smith, H.E., Liebert, T., & Spinrad, H. 1976, ApJ, 205, L117
- (27)
- (28) Burbidge, E.M., Beaver, E.A., Cohen, R.D., Junkkarinen, V.R., & Lyons, R.W. 1996, AJ, 112, 2533
- (29)
- (30) Calzetti, D., Kinney, A.L., Storchi-Bergmann, T. 1994, ApJ, 429, 582
- (31)
- (32) Cardelli, J.A., Clayton, G.C., & Mathis, J.S. 1989, ApJ, 345, 245
- (33)
- (34) Cayatte, V., Kotanyi, C., Balkowski, C., & van Gorkom, J.H. 1994, AJ, 107, 1003
- (35)
- (36) Chen, H.-W., Lanzetta, K. M., Webb, J. K., & Barcons, X. 2001, ApJ, 559, 654
- (37)
- (38) Chen, H.-W. & Lanzetta, K. M. 2003, ApJ, 597, 706
- (39)
- (40) Cohen, J.G. 2001, AJ, 121, 1275
- (41)
- (42) Cohen, R.D., Smith, H.E., Junkkarinen, V.T., & Burbidge, E.M. 1987, ApJ, 318, 577
- (43)
- (44) Cohen, R.D., Burbidge, E.M., Junkkarinen, V.T., Lyons, R.W., & Madejski, G. 1999, AAS, 194, 71.01
- (45)
- (46) Colbert, J. W. & Malkan, M. A. 2002, ApJ, 566, 51
- (47)
- (48) de Blok, W. J. G., McGaugh, S. S., & van der Hulst, J. M. 1996, MNRAS, 283, 18
- (49)
- (50) Deharveng, L., Peña, M., Caplan, J., & Costero, R. 2000, MNRAS, 311, 329
- (51)
- (52) Dessauges-Zavadsky, M., Prochaska, J., & D’Odorico, S. 2002, A&A, 391, 801
- (53)
- (54) D’Odorico, V. & Molaro, P. 2004, A&A, 415, 879
- (55)
- (56) Esteban, C., Peimbert, M., Torres-Peimbert, S., & Escalante, V. 1998, MNRAS, 295, 401
- (57)
- (58) Evans, I. N. & Koratkar, A. P. 2004, ApJS, 150, 73
- (59)
- (60) Ferguson, A. M. N., Gallagher, J.S., & Wyse, R.F.G. 1998, AJ, 116, 673
- (61)
- (62) Ferland, G. J. 2001, PASP, 113, 41
- (63)
- (64) Jenkins, E. B. 1986, ApJ, 304, 739
- (65)
- (66) Jerjen, H., Binggeli, B., & Barazza, F. D. 2004, AJ, 127, 771
- (67)
- (68) Junkkarinen, V. T., Cohen, R. D., Beaver, E. A., Burbidge, E. M., Lyons, R. W., & Madejski, G. 2004, ApJ in press (astro-ph/0407281)
- (69)
- (70) Khare, P., Kulkarni, V.P., Lauroesch, J.T., York, D.G., Crotts, A.P.S., & Nakamura, O. 2004, ApJ in press (astro-ph/0408139)
- (71)
- (72) Kennicutt, R.C. Jr. & Garnett, D.R. 1996, ApJ, 456, 504
- (73)
- (74) Kennicutt, R.C. Jr. 1998a, ARA&A, 36, 189
- (75)
- (76) Kennicutt, R.C. Jr. 1998b, ApJ, 498, 541
- (77)
- (78) Kennicutt, R.C. Jr., Bresolin, F., & Garnett, D.R. 2003, ApJ, 591, 801
- (79)
- (80) Kobulnicky, H. A. & Zaritsky, D. 1999, ApJ, 511, 118
- (81)
- (82) Kobulnicky, H. A., Kennicutt, R. C., Jr., & Pizagno, J. L. 1999, ApJ, 514, 544
- (83)
- (84) Kulkarni, V.P., Fall, S.M., Lauroesch, J. T., Khare, P., & Truran, J. W. 2004, ApJ in press (astro-ph/0409234)
- (85)
- (86) Lacy, M., Becker, R. H., Storrie-Lombardi, L. J.et al. 2003, AJ, 126, 2230
- (87)
- (88) Lane, W., Smette, A., Briggs, F., Rao, S., Turnshek, D., & Meylan, G. 1998, AJ, 116, 26
- (89)
- (90) Lane, W. 2000, PhD. Thesis, Univ. of Groningen
- (91)
- (92) Lanzetta, K. M., Wolfe, A. M., & Turnshek, D. A. 1995, ApJ, 440, 435
- (93)
- (94) Le Brun, F., Bergeron, J., Boissé, P., & Deharveng, J.M. 1997, A&A, 321, 733
- (95)
- (96) Ledoux, C., Bergeron, J., & Petitjean, P. 2002, A&A, 385, 802
- (97)
- (98) Lu, L., Sargent, W. L. W., Barlow, T. A., Churchill, C. W., & Vogt, S. 1996, ApJS, 107, 475
- (99)
- (100) McGaugh, S. S. 2001, ApJ, 380, 140
- (101)
- (102) McWilliam, A. 1997, ARA&A, 35, 503
- (103)
- (104) Meyer, D. M., Jura, M., & Cardelli, J. A. 1998, ApJ, 493, 222
- (105)
- (106) Miller, E.D., Knezek, P.M., & Bregman, J.N. 1999, ApJ, 510, L95
- (107)
- (108) Moos, H. W., et al. 2002, ApJS, 140, 3
- (109)
- (110) Petitjean, P., Theodore, B., Smette, A., & Lespine, Y. 1996, A&A, 313, 25
- (111)
- (112) Pettini, M., Smith, L. J., Hunstead, R. W., & King, D. L. 1994, ApJ, 426, 79
- (113)
- (114) Pettini, M., King, D. L., Smith, L. J., & Hunstead, R. W. 1997, ApJ, 478, 536
- (115)
- (116) Pettini, M., Ellison, S.L., Steidel, C.C., & Bowen, D.V. 1999, ApJ, 510, 576
- (117)
- (118) Pettini, M., Ellison, S.L., Steidel, C.C., Shapley, A.E., & Bowen, D.V. 2000, ApJ, 532, 65
- (119)
- (120) Pettini, M. & Pagel, B.E.J. 2004, MNRAS, 348, L59
- (121)
- (122) Pierce, M. J. & Tully, R. B. 1988, ApJ, 330, 579
- (123)
- (124) Pierce, M. J. & Tully, R. B. 1992, ApJ, 387, 47
- (125)
- (126) Prochaska, J. X., Howk, J. C., O’Meara, J. M., Tytler, D., Wolfe, A. M., Kirkman, D., Lubin, D., & Suzuki, N. 2002, ApJ, 571, 693
- (127)
- (128) Prochaska, J. X., et al. 2003a, ApJ, 595, L9
- (129)
- (130) Prochaska, J. X., Gawiser, E., Wolfe, A. M., Cooke, J., & Gelino, D. 2003b, ApJS, 147, 227
- (131)
- (132) Prochascka, J. X., Howk, J. C., & Wolfe, A. M. 2003c, Nature, 423, 57
- (133)
- (134) Prochaska, J.X., Chen, H.-W., Howk, J.C., Weiner, B.J., & Mulchaey, J.S. 2004, ApJ in press (astro-ph/0408294)
- (135)
- (136) Rao & Turnshek 1998, ApJ, 500, L115
- (137)
- (138) Rao & Turnshek 2000, ApJS, 130, 1
- (139)
- (140) Rao, S.M., Nestor, D.B., Turnshek, D.A., Lane, W., Monier, E.M., & Bergeron, J. 2003, ApJ, 595, 94
- (141)
- (142) Rauch, M., Sargent, W. L. W., Barlow, T. A., & Simcoe, R. A. 2002, ApJ, 576, 45
- (143)
- (144) Rola, C.S., Terlevich, E., & Terlevich, R.J. 1997, MNRAS, 289, 419
- (145)
- (146) Schlegel, D.J., Finkbeiner, D.P., & Davis, M. 1998, ApJ, 500, 525
- (147)
- (148) Schulte-Ladbeck, R.E., Rao, S.M., Drozdovsky, I.O., Turnshek, D.A., Nestor, D.B., & Pettini, M. 2004, ApJ, 600, 613
- (149)
- (150) Scott, J., Bechtold, J., Dobrzycki, A., & Kulkarni, V. 2000, ApJS, 130, 67
- (151)
- (152) Scott, J., Bechtold, J., Morita, M., Dobrzycki, A., & Kulkarni, V. 2002, ApJ, 571, 665
- (153)
- (154) Sembach, K. R. & Danks, A. C. 1994, A&A, 289, 539
- (155)
- (156) Sofia, U.J. & Meyer D.M. 2001, ApJ, 554, L221
- (157)
- (158) Steidel, C.C., Pettini, M., Dickinson, M., & Persson, S.E. 1994, AJ, 108, 2046
- (159)
- (160) Steidel, C.C., Adelberger, K. L., Giavalisco, M., Dickinson, M., & Pettini, M. 1999, ApJ, 519, 1
- (161)
- (162) Steidel, C.C., Kollmeier, J.A., Shapely, A.E., Churchill, C.W., Dickinson, M., & Pettini, M. 2002, ApJ, 570, 526
- (163)
- (164) Thurston, T. R., Edmunds, M. G., & Henry, R. B. C. 1996, MNRAS, 283, 990
- (165)
- (166) Tremonti, C. A. et al. 2004, ApJ in press (astro-ph/0405537)
- (167)
- (168) Tully, R. B. & Fisher, J. R. 1977, A&A, 54, 661
- (169)
- (170) Turnshek, D.A., Rao, S., Nestor, D., Lane, W., Monier, E., Bergeron, J., & Smette, A. 2001, ApJ, 553, 288
- (171)
- (172) Turnshek, D.A., Rao, S.M., Ptak, A.F., Griffiths, R.E., & Monier, E.M. 2003, ApJ, 590, 730
- (173)
- (174) van der Hulst, Skillman, E., Smith, T., Bothun, G., McGaugh, S., & de Blok, W. 1993, AJ, 106, 548
- (175)
- (176) van Zee, L., Salzer, J. J., Haynes, M. P., O’Donoghue, A. A., & Balonek, T. J. 1998, AJ, 116, 2805
- (177)
- (178) Vladilo, G., Centurión, M., Bonifacio, P., & Howk, J. C. 2001, ApJ, 557, 1007
- (179)
- (180) Vladilo, G. 2004, A&A, 421, 479
- (181)
- (182) Vogt, N. P., Forbes, D. A., Phillips, A. C., Gronwall, C., Faber, S. M., Illingworth, G. D., & Koo, D. C. 1996, ApJ, 465, L15
- (183)
- (184) Welty, D. E., Morton, D. C., & Hobbs, L. M. 1996, ApJS, 106, 533
- (185)
- (186) Wolfe, A.M., Briggs, F.H., & Davis, M.M. 1982, ApJ, 259, 495
- (187)
- (188) Wolfe, A.M., Prochaska, J.X., & Gawiser, E. 2003a, ApJ, 593, 215
- (189)
- (190) Wolfe, A.M., Gawiser, E., & Prochaska, J.X. 2003b, ApJ, 593, 235
- (191)
- (192) Wright, E.L., et al. 1991, ApJ, 381, 200
- (193)
- (194) Zaritsky, D., Kennicutt, R.C. Jr., & Huchra, J.P. 1994, ApJ, 420, 87
- (195)
| Sightline | (cm-2) | (arcsec) | (arcsec) | (arcsec) | Morphology | |||
|---|---|---|---|---|---|---|---|---|
| (1) | (2) | (3) | (4) | (5) | (6) | (7) | (8) | (9) |
| PKS0439433 | 0.593 | 0.101 | 20.0 | 4.1 | disk | |||
| Q0738313 | 0.635 | 0.221 | 20.9 | 5.4 | compact | |||
| Q0809483 | 0.871 | 0.437 | 20.8 | 1.5 | disk | |||
| AO 0235164 | 0.940 | 0.524 | 21.7 | 2.1 | compact | |||
| B2 0827243 | 0.939 | 0.525 | 20.3 | 6.1 | disk | |||
| LBQS00580155 | 1.954 | 0.612 | 20.1 | 1.2 | disk |
| Blocking | Spectral | Exposure | |||||
|---|---|---|---|---|---|---|---|
| Field | Telescope | Instrument | Grating | Filter | Coverage | Time (s) | |
| PKS0439433 | Magellan/Clay | B&C | 600 l/mm | GG400 | 1.6 Å | 3960 – 7500 Å | 1200 |
| Magellan/Clay | B&C | 1200 l/mm | GG400 | 0.8 Å | 4720 – 6350 Å | 2400 | |
| Q0738313 | MMT | Blue Channel | 500 l/mm | LP495 | 1.2 Å | 3850 – 8250 Å | 2400 |
| Q0809483 | MMT | Blue Channel | 500 l/mm | LP495 | 1.2 Å | 5100 – 8300 Å | 4800 |
| MMT | Blue Channel | 1200 l/mm | L-42 | 0.5 Å | 4950 – 6050 Å | 3600 | |
| AO 0235164 | MMT | Blue Channel | 500 l/mm | LP495 | 1.2 Å | 5100 – 8300 Å | 3600 |
| B2 0827243 | MMT | Blue Channel | 500 l/mm | LP495 | 1.2 Å | 5100 – 8300 Å | 3600 |
| MMT | Blue Channel | 1200 l/mm | L-42 | 0.5 Å | 4950 – 6050 Å | 5400 | |
| LBQS00580155 | Magellan/Clay | B&C | 600 l/mm | OG570 | 1.6 Å | 5600 – 7200 Å | 3600 |
| Spectral | Exposure | Proposal | |||||
|---|---|---|---|---|---|---|---|
| Field | Instrument | Grating | Aperture | Coverage | Time (s) | Identifier | |
| PKS0439433 | STIS | G140L | 1.6 Å | 1120 – 1717 Å | 2510 | 9382 | |
| FOS | G190H | 0.36 Å | 1610 – 3277 Å | 7888 | 4581 | ||
| FOS | G270H | 0.51 Å | 1610 – 3277 Å | 2517 | 4581 | ||
| AO 0235164 | STIS | G230L | 1.4 Å | 1585 – 3141 Å | 12830 | 7294 | |
| STIS | G430L | 2.6 Å | 2900 – 5710 Å | 2874 | 7294 | ||
| STIS | G750L | 4.9 Å | 5270 – 10260 Å | 2160 | 7294 |
| Features | Flux () | (Å) | () | Corrected | ||
|---|---|---|---|---|---|---|
| 3728.23 | 4105.82 | |||||
| H | 4862.70 | 5354.09 | ||||
| 4960.29 | 5462.99 | |||||
| 5008.24 | 5514.01 | |||||
| 6549.91 | 7211.74 | |||||
| H | 6564.63 | 7227.83 | ||||
| 6585.42 | 7250.92 | |||||
| 6718.95 | 7397.32 | |||||
| 6733.16 | 7412.48 |
| Features | Flux () | (Å) | () | ||
|---|---|---|---|---|---|
| 3728.23 | 4556.64 |
| Features | Flux () | (Å) | () | ||
|---|---|---|---|---|---|
| 3728.23 | 5361.29 | ||||
| H | 4862.70 | 6982.72 | |||
| 4960.29 | 7129.92 | ||||
| 5008.24 | 7198.84 |
| Features | Flux () | (Å) | () | ||
|---|---|---|---|---|---|
| 3426.48 | 5226.83 | ||||
| 3728.23 | 5685.65 | ||||
| H | 4341.69 | 6622.91 | |||
| 4364.44 | 6657.61 | ||||
| H | 4862.70 | 7417.66 | |||
| 4960.29 | 7566.52 | ||||
| 5008.24 | 7639.67 |
| Features | Flux () | (Å) | () | ||
|---|---|---|---|---|---|
| 3728.23 | 5689.38 | ||||
| H | 4862.70 | 7422.52 | |||
| 4960.29 | 7571.48 | ||||
| 5008.24 | 7644.67 | aaThe [O III] feature coincides with the telluric A-band absorption. The observed emission-line flux is subject to a large systematic uncertainty after the correction for the atmosphere absorption. The upper limit to the intrinsic line luminosity was estimated based on the measured [O III] line luminosity, which is not contaminated by telluric absorption, and the expected 1:3 flux ratio between the two forbidden transitions. |
| Features | Flux () | (Å) | () | ||
|---|---|---|---|---|---|
| 3728.23 | 6010.01 |
| Galaxies | Absorbers | ||||||||||
|---|---|---|---|---|---|---|---|---|---|---|---|
| aaEnclosed dynamic mass evaluated at the location of the DLA. | |||||||||||
| Sightline | ( kpc) | () | b,cb,cfootnotemark: | (cm-2) | (cm-2) | ||||||
| (1) | (2) | (3) | (4) | (5) | (6) | (7) | (8) | (9) | (10) | (11) | |
| PKS0439433 | 0.1010 | 5.3 | 0.1009 | ||||||||
| Q0738313 | 0.2222 | 13.5 | … | … | … | 0.2212 | … | … | |||
| Q0809483 | 0.4375 | 5.9 | 0.4368 | … | … | ||||||
| AO 0235164 | 0.5253 | 9.2 | … | … | 0.5243 | ||||||
| B2 0827243 | 0.5263 | 26.7 | 0.5250 | ||||||||
| LBQS00580155 | 0.6120 | 5.5 | … | … | … | 0.6118 | |||||
| HE11221649 | 0.69ddMeasurement based on photometric redshift techniques (Chen & Lanzetta 2003). | 17.7 | … | … | … | 0.6819 | |||||
| EX03022223 | 1.00ddMeasurement based on photometric redshift techniques (Chen & Lanzetta 2003). | 18.5 | … | … | … | 1.0095 | |||||