Discovery of an X-ray Nova in M31
Abstract
We have obtained snapshot images of an X-ray nova in M31 from Chandra ACIS-I and the Hubble Space Telescope (HST) Advanced Camera for Surveys (ACS). The Chandra position of the X-ray nova was R.A.=00:44:06.68 1.74′′, Dec.=+41:12:20.0 2.31′′. A follow-up HST observation 24 days later revealed a source at R.A.=00:44:06.81, Dec.=+41:12:24.0 that was . This optical source faded to in 3 months. During this time period, the X-ray flux decayed linearly from (3.610-4 to (6.910-5 ct cm-2 s-1. The HST identification of an optical source in the same region experiencing an obvious drop in brightness in concert with the X-ray nova suggests that this optical source is the counterpart of the X-ray nova. However, the precision of the X-ray position allows the possibility that the optical source is a nearby variable star. We discuss the implications of both possibilities.
1 Introduction
Since the discovery of bright X-ray novae (XRNe), these bright, transient X-ray events have allowed some of the most detailed studies of the properties of the accretion disks of stellar-mass compact objects (e.g. Chen et al., 1997; McClintock & Remillard, 2004, and references therein). While XRNe have been observed in both high-mass X-ray binaries (HMXBs; Tanaka & Shibazaki, 1996) and low-mass X-ray binaries (LMXBs), most of those occurring in LMXBs are confirmed black hole binaries. In 15 Galactic XRNe systems optical followup has revealed that the accreting object is more massive than M⊙ (McClintock & Remillard, 2004), and therefore cannot be a stable neutron star (NS). The millisecond variability and X-ray luminosity further supports the argument that these binary systems contain black holes. Therefore, these objects are among the firmest examples of black hole candidates known (Charles, 1998), and are of intense interest as sites to study general relativity in the ‘strong gravity’ regime. The discovery of extragalactic XRNe is therefore a crucial step forward in the study of extragalactic stellar-mass black holes.
With X-ray luminosities ranging from 1036–1040 erg s-1 (Chen et al., 1997), XRNe can easily be detected by Chandra and resolved from other X-ray sources within host galaxies several Mpc away, making M31 a prime target for extragalactic studies of XRN with Chandra. In addition, with optical magnitudes ranging from , it is possible to detect and resolve counterparts for extragalactic XRNe in the Local Group with HST.
Extragalactic XRNe have also been discovered in the Magellanic Clouds (White & Carpenter, 1978), M32 (Garcia et al., 2000), and M31 (Osborne et al., 2001; Trudolyubov et al., 2001; Kong et al., 2001). Chandra and XMM have allowed the discovery of nearly 50 XRNe in M31 (Trudolyubov et al., 2001; Kong et al., 2002; Di Stefano et al., 2004; Williams et al., 2004); Williams et al. in preparation). Most recently, by combining the power of Chandra with HST, X-ray/optical studies of the XRNe in M31 have begun, providing new details and comparisons to their Galactic siblings (e.g. Williams et al., 2004).
Herein we report the discovery of a new XRN in M31 with new Chandra ACIS-I data. Along with three X-ray detections of this source, we have obtained contemporaneous HST ACS images of the region where the XRN appeared. The X-ray data provide measurements of the XRN luminosity and the decay pattern. The optical data provide constraints on the physical properties of the progenitor binary system.
2 Data
2.1 X-ray Data
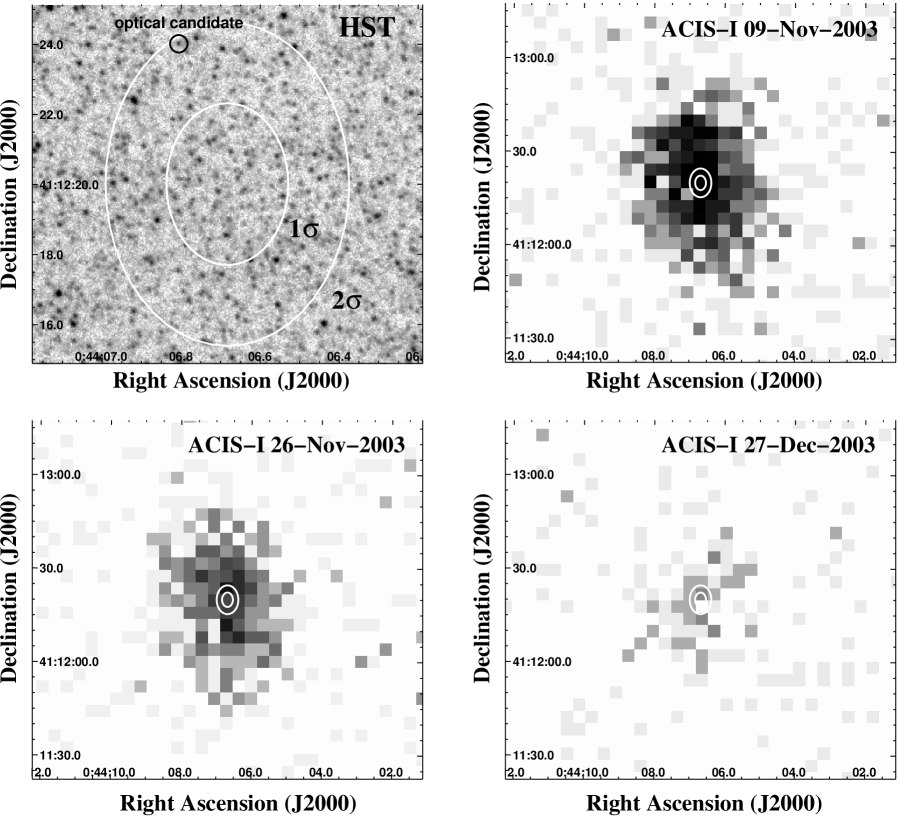
We obtained Chandra ACIS-I images of M31 on 09-Nov-2003, 26-Nov-2003, and 27-Dec-2003. In addition to the 4 ACIS-I chips, the S2 and S3 chips were on during the observations. The observations were performed in “alternating exposure readout”, so that every 6th frame had 0.6 seconds of exposure instead of the canonical 3.2 seconds. This mode lowers the effective exposure time by 20%, but it provides a second low exposure image in which bright sources are not piled up. The details of these observations, including target coordinates, roll angle of the telescope, and exposure time, are provided in Table 1.
These 3 observations were all reduced in an identical manner using the X-ray data analysis package CIAO v3.0.2. We created exposure maps for the images using the CIAO script merge_all,111http://cxc.harvard.edu/ciao/download/scripts/merge_all.tar and we found and measured positions for the sources in the image using the CIAO task wavdetect.222http://cxc.harvard.edu/ciao3.0/download/doc/detect_html_manual/Manual.html Each data set detected sources down to (0.3–10 keV) fluxes of 210-6 ct cm-2 s-1. Errors for the X-ray positions were determined using the IRAF333IRAF is distributed by the National Optical Astronomy Observatory, which is operated by the Association of Universities for Research in Astronomy, Inc., under cooperative agreement with the National Science Foundation. task imcentroid, which determines the errors of the point spread function (PSF) along each pixel axis independently. The counts from the source are projected onto each axis, and the error in the position is then calculated by dividing the standard deviation of the pixel positions of all of the source counts by the square root of the number of counts. As the pixels in Chandra images are aligned with north up and east to the left, the X position error was taken to be the R.A. error, and the Y position error was taken to be the Dec. error.
We aligned the positions of bright (100 counts) X-ray sources with known globular cluster counterparts to the positions of the centers of their host globular clusters in the images of the Local Group Survey (LGS; Massey et al., 2001) using the IRAF task ccmap. These images have an assigned J2000 (FK5) world coordinate system accurate to 0.25′′, and they provided the standard coordinate system to which we aligned all of our data for this project. The alignment errors between the Chandra and LGS are shown for each observation in column in Table 2. Alignments allowed for adjustments in pixel scale as well as shifts in and .
We cross-correlated the X-ray source positions of all 3 observations against all previously published X-ray catalogs and the Simbad444http://simbad.u-strasbg.fr/ database to look for any new, bright X-ray source likely to be an XRN.
The data pertaining to the bright new X-ray source CXOM31 J004406.7+411220 (hereafter s1-86, see Williams et al., 2004 for naming convention details) at R.A.= 00:44:06.68, Dec.=41:12:20.0 (J2000) was then studied in further detail. Although the observations were performed in the ACIS-I configuration, s1-86 was detected on the S3 chip in the first 2 observations and on the S2 chip in the third observation.
We extracted the X-ray spectrum of s1-86 from all 3 observations using the CIAO task psextract555http://cxc.harvard.edu/ciao/ahelp/psextract.html. We then fit these spectra independently, binning the spectra of the first two observations so that each energy bin contained 20 counts and binning the spectrum of the third observation so that each energy bin contained 10 counts. These binning factors allowed the use of standard statistics when fitting the spectra.
2.2 Optical Data
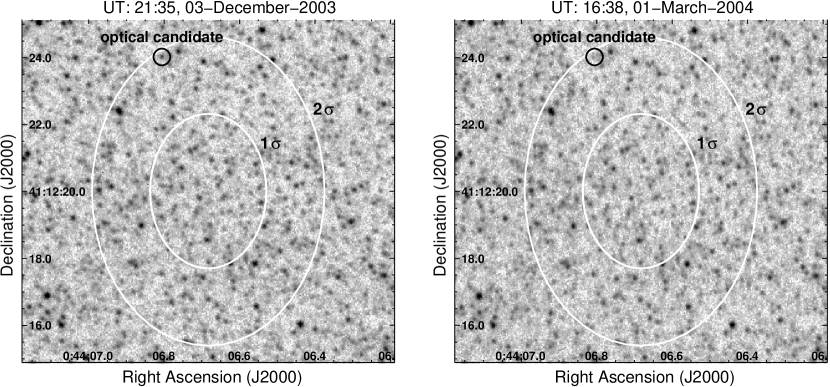
We obtained two sets of HST ACS data, one observed at UT 21:35 on 03-Dec-2003 and one observed at UT 16:38 on 01-Mar-2004. Each of these were pointed at R.A.=00:44:07, Dec.=41:12:19.5. The observations had orientations of 71.75 deg and 32.73 deg respectively. Both observations were taken using the standard ACS box 4-point dither pattern to allow the final data to be drizzled to recover the highest possible spatial resolution. All exposures were taken through the F435W filter. The total exposure times were 2200 seconds for each data set.
We aligned and drizzled each set of 4 images into high-resolution (0.025′′ pixel-1) images using the PyRAF666PyRAF is a product of the Space Telescope Science Institute, which is operated by AURA for NASA. task multidrizzle,777multidrizzle is a product of the Space Telescope Science Institute, which is operated by AURA for NASA. http://stsdas.stsci.edu/pydrizzle/multidrizzle which has been optimized to process ACS imaging data. The task removes the cosmic ray events and geometric distortions, and it drizzles the dithered frames together into one final photometric image. We processed the relevant sections of the final images with DAOPHOT-II and ALLSTAR (Stetson et al., 1990) to find and measure the count rates of the sources. Sections (10′′ 10′′) of the images, centered on the X-ray position of the detected XRN, are shown in Figure 1.
We converted the count rates measured on our images to ST magnitudes and VEGA magnitudes using the conversion techniques provided in the ACS Data Handbook888http://www.stsci.edu/hst/acs/documents/handbooks/DataHandbookv2/ACS_longdhbcover.html. The count rates, ST (F435W) magnitudes, and VEGA () magnitudes for the optical source of interest are provided in Table 3 and discussed in § 4.1.
Finally, we aligned the drizzled ACS images with the LGS coordinate system with ccmap using stars and clusters common to both images. This alignment was performed independently for each of the 2 ACS data sets to check the alignment consistency. As displayed by the coordinates in Figure 1 and the errors measured by ccmap (0.025′′), we were able to accurately align the ACS images to the LGS coordinate system. Because the ACIS-I images had been aligned to the same coordinate system, we were able to compare the coordinates of objects the the ACS and ACIS-I images reliably.
3 Results
3.1 X-ray
The first X-ray observation (ObsID 4678) provided the first detection of s1-86 (CXOM31 J004406.7+411220 at R.A.= 00:44:06.71, Dec.=41:12:20.0 (J2000)). This position is 16′ east and 4′ south of the nucleus, about 1′ east of the eastern spiral arm and in the outskirts of the bulge. Because this source was very bright and did not appear in any previous publication, we assumed that it was an XRN. We were able to find a 10 ks XMM image of this region (OBS_ID=0112570601) taken 28 December 2000, which contained this region near the edge of the field. Assuming a power-law spectrum with a slope of 3.0 and an absorption column of 21021 cm-2, the non-detection of s1-86 in this XMM observation provides a 4 upper-limit to the unabsorbed 0.3–7 keV luminosity of 2.51036 erg s-1. Our first detection of the source, with an unabsorbed 0.3–7 keV luminosity of 2.41038 erg s-1, shows that it brightened by a factor of 100.
The next two observations in our M31 monitoring program (ObsIDs 4679 and 4680) confirmed the transient nature of the source, as the X-ray flux decayed by a factor of 7.3 in 48 days. This decay is clearly seen in the X-ray images shown in Figure 3, demonstrating that s1-86 is an XRN.
The three-point X-ray lightcurve from the 3 ACIS-I detections of s1-86 is shown in Figure 2. Although there are only 3 data points, the decay is not consistent with an exponential. The best fitting exponential decay is shown on the figure with a dashed line. It has and an -folding time of 26.9 days. On the other hand, a linear decay, shown with the solid line, provides an excellent fit to the data () with a slope of -9.3 10-6 ct cm-2 s-1 day-1 and a total decay time of 60 days.
To look for short-term variability, we performed a Kolmogorov-Smirnov (KS) test between the photon arrival times for s1-86 during its first detection (ObsID 4678) and a uniform photon arrival distribution (simulating a constant source) containing the same number of counts. We considered the arrival times for the 758 counts contained in the region of s1-86 as measured by wavdetect. This test returned a P-value of 0.969, which provides no indication of variability during the observation.
Next, the three positional measurements for s1-86 and their errors (given in Table 2) were combined to determine the most accurate coordinates for the X-ray source. Table 2 includes the 3 largest sources of positional errors in our analysis. These errors were all included in our determination of the X-ray position of s1-86. The quantity corresponds to the positional error measured by imcentroid, which is limited by the large PSF at the location of s1-86, 16′ off-axis. The quantity corresponds to the positional error of the alignment of the ACIS X-ray positions with the LGS coordinate system, measured by ccmap. The quantity corresponds to the positional error of sources on the ACIS-S chips when ACIS-I is the aimpoint, as was the case for all 3 of our detections of s1-86; this error was estimated by Markevitch.999http://asc.harvard.edu/cal/Hrma/optaxis/platescale/geom_public.html He found an error of 1′′ is typical for such positions. This error is independent of our alignment procedure as none of our alignment GCs were located on the S-chips. We included this error by adding it directly to our totals from the other errors.
The weighted mean of the three positions and combined random errors (excluding ) provided our best measurement of the location of s1-86: R.A.=00:44:06.68 0.74′′, Dec.=41:12:20.0 1.31′′. After adding the systematic () error to both coordinates, the final (1) R.A. position error is 1.74′′, and the final (1) Dec. position error is 2.31′′. At the distance of M31 (780 kpc; Williams, 2003), these errors correspond 6.6 pc and 8.7 pc.
In addition, as a consistency check to our weighted mean position, we co-added the 3 aligned ACIS observations and measured the wavdetect position and imcentroid position errors of the combined image of s1-86. This position is R.A.=00:44:06.75 0.61′′, Dec.=41:12:20.2 1.35′′, in good agreement with the weighted mean position calculated above. After adding the systematic () error to both coordinates, the final (1) R.A. position error is 1.61′′, and the final (1) Dec. position error is 2.35′′.
Finally, the three X-ray spectra were all well-fit by an absorbed power-law model and reasonably fit (though not as well) by an absorbed disk blackbody model. All of the properties and values for the fits are provided in Tables 4 and 5.
The power-law fits show no evidence for spectral variability during the decay of the X-ray flux. All of the power-law fits are consistent with a power-law index of 3 and an absorption column of 21021 cm-2. The disk blackbody fits suggest that, during the decay of the X-ray flux, there was a decrease in the inner disk temperature from 0.6 keV to 0.4 keV. These fits yield a constant inner disk radius 50 km and a constant absorption column of 51020 cm-2. The temperatures and radii are similar to those found for ACIS-I observations of the M31 X-ray transient r2-67 ( = 0.350.05 keV, km), which had an optical counterpart detected with HST (Williams et al., 2004).
The best estimate of the absorption to s1-86 is the weighted mean of the values measured from the first 2 spectral measurements, which is (2.20.3)1021 cm-2 (power-law model) or (5.20.9)1020 cm-2 (disk blackbody model). The maximum observed absorption-corrected luminosity is 0.9–2.4 1038 erg s-1 depending on the model fit, so the luminosity alone does not discriminate between an accreting black hole or neutron star.
3.2 Optical
We searched the ACS images, aligned to the same coordinate system as the ACIS images, for sources within 4.5′′ (2) of the X-ray position. DAOPHOT found 791 optical sources in the first ACS observation down to =27.8 (the 4 detection limit). DAOPHOT found 799 optical sources in second ACS observation down to =27.8 within 4.5′′ of the X-ray position. With a distance modulus to M31 of 24.47 and a typical extinction , this detection limit corresponds to M.
In addition, we note that the brightest star within 4.5′′ of the X-ray position has , fainter than a counterpart for a high-mass Be transient. Such transients have optical counterparts with spectral type O8.5–B2 (Negueruela, 1998), , or scaled to the distance and extinction of M31.
None of the optical sources down to =26.8 within the 1 error ellipse of the X-ray source position in the first ACS image had a significantly lower (1 mag) optical flux in the second ACS observation. Extending the search to the 2 error ellipse, there is only 1 optical source with 26.8 in the first ACS image that had a significantly lower (1 mag) optical flux in the second ACS observation. This sole counterpart candidate is located at R.A.=00:44:06.81 and Dec.= +41:12:24.0 (J2000). This position is shown on the ACS images of the region of interest in Figure 1. The source flux decreased by 70%, from to , between ACS observations. Further details about this source in both ACS observations are provided in Table 3.
If this fading optical source is indeed the counterpart of s1-86, we can use the simultaneous X-ray and optical luminosities to predict the orbital period for the system using the relation of van Paradijs & McClintock (1994). Since this relation was seen in Galactic XRNe events, there have been many new systems discovered. Using the LMXB catalog of Liu et al. (2001), we checked the consistency of this relation with more recent X-ray novae, including GRO J1655-40, 4U 1543-47, XTE 1550-564, XTE J1118+480, and V4641 Sgr. With the exception of XTE J1118+480, which was two magnitudes brighter in the optical than the prediction from the relation, these more recent XRNe all fit the van Paradijs & McClintock (1994) relation. The higher than expected optical luminosity of XTE J1118+480 can be understood in the context of the van Paradijs and McClintock model, which postulates that the optical flux is due solely to X-ray heating. XTE J1118+480 has the lowest X-ray luminosity of all sources in the sample, and is therefore the most likely to reveal optical emission above and beyond that due to X-ray heating.
The van Paradijs & McClintock (1994) relation requires only simultaneous measurements of the absolute magnitude and the X-ray luminosity to predict the orbital period of an LMXB system. These measurements can be taken from any part of an outburst when the dominant contributor to the optical flux is X-ray heating; the peak luminosity and outburst amplitude are not required in the application of the relation.
We determined the LX/Lopt ratio at the time of the first observation (03-Dec-2003), assuming the X-ray luminosities given by the power-law fits in Table 4. We apply the X-ray luminosity on 03-Dec-2003 as predicted by our linear decay fit to the lightcurve (1.41038 erg s-1). To determine , we apply the magnitude of our candidate (25.750.05), and correct for the absorption measured in the X-ray spectra ((2.20.3) 1021 cm-2). This absorption can be converted to using the conversion of Predehl & Schmitt (1995) and assuming a standard interstellar extinction law. These values give . Assuming the mean intrinsic B-V colors of LMXBs in the Liu et al. (2001) Galactic LMXB catalog (-0.090.14), for the optical counterpart candidate.
Applying these LX and values and errors to the relation of van Paradijs & McClintock (1994), including the errors on the parameters of the relation, we obtain an orbital period of 1.0 day. Applying Kepler’s law, the inferred disk size is then 0.7 cm. These values are reasonable, but pushing the low end, for a large disk that would produce a long, linear X-ray decay like the one observed for s1-86 (King & Ritter, 1998).
If we simply apply the X-ray luminosity and absorption given by the power-law fit from the X-ray detection closest in time to the first optical detection (26-November-2003; 1.81038 erg s-1; see Table 4), rather than interpolating the X-ray luminosity on December 3 as we have done above, the calculated period is not significantly affected (0.9 day). However, if we apply the X-ray luminosity and absorption column values given by the disk blackbody fits in Table 5, the calculated period is 0.3 day. Applying Kepler’s law, the inferred disk size is then 3 cm.
If our only plausible optical counterpart candidate is not the true counterpart, then the true counterpart must have been fainter than . Since our (4) detection limit was =27.8, a source fainter than in the first image would only provide a lower-limit for the magnitude decrease, and the lower-limit would be less than 1 mag, even if the source was unseen in the second ACS observation. Applying the same calculations as described above to this conservative magnitude limit (if the optical candidate is not the true counterpart) provides an upper-limit on the orbital period of the system of day and an upper-limit on the size of the disk of cm. Such values are below those predicted for XRNe with long, linear X-ray decays (King & Ritter, 1998; see § 4.1.2).
4 Discussion
4.1 Arguments for an optical counterpart
4.1.1 Optical magnitudes
Chen et al. (1997) determined that the mean optical decay timescale for Galactic XRNe is a factor of 2.2 longer than the X-ray decay timescale. This mean difference in decay timescales is in agreement with theoretical models of accretion processes, which predict that the optical decay timescales will be longer than X-ray decay times by a factor of 2–4 (King & Ritter, 1998).
For s1-86, the total X-ray decay time was 60 days. Since the optical flux of the second detection (01-Mar-2004) of the counterpart candidate was 30% of the 03-Dec-2003 optical flux 88 days earlier, we estimate the optical decay time for the candidate to be 130 days. Our estimate of the optical/X-ray decay time ratio is therefore 2.2.
The decay time ratios for the Galactic XRNe in the Chen et al. (1997) sample cover a wide range, as do more recent Galactic XRNe. In some cases, such as the May 1989 XRNe of 2023+338 (V404 Cyg), the optical decay time has been observed to be shorter than the X-ray decay time (Kitamoto et al., 1989; Wagner et al., 1991; Chen et al., 1997). However, we note that the optical decay of the source detailed in Table 3 at R.A.=00:44:06.81, Dec.=41:12:24.0 (J2000) lies near the mean of Galactic events and is consistent with theoretical models. This consistency argues in favor of the candidate being the true optical counterpart.
4.1.2 Disk size and orbital period
As discussed in King & Ritter (1998), one may use the decay time of the XRN to predict the size of the accretion disk of the system. This method was applied to the X-ray transient source r2-67 by Williams et al. (2004) and gave an answer consistent with the period prediction from the optical and X-ray luminosities.
We calculated the size of the disk expected for a 10 black hole with a linear decay to approximately zero X-ray flux 60 days after a peak X-ray luminosity of 2.41038 erg s-1. Similar to the calculation for r2-67 in Williams et al. (2004), the disk size prediction for s1-86 is
where is the angular momentum transport efficiency, is the black hole mass in 10 units, and is the local disk temperature in units of K. We note that if the true peak X-ray luminosity was higher, the disk size predicted by the model would increase. If we apply the lowest possible peak X-ray luminosity, that given by the disk blackbody fit to the 09-Nov-2003 data (91037 erg s-1), the disk size prediction is
According to Kepler’s laws, the size of the orbit of the secondary is cm, where is the orbital period in days. Because the disk cannot be larger than the orbit of the secondary (), these calculations suggest that the orbital period of this system is 1 day. This estimate of the orbital period is consistent with the prediction from the van Paradijs & McClintock (1994) relation when the optical luminosity of the counterpart candidate is applied (see § 3.2), providing some additional confidence that the candidate is the true optical counterpart.
4.2 Arguments against an optical counterpart
4.2.1 Positional (dis)agreement
On the other hand, the precision of the X-ray position for s1-86 is not optimal. As shown in Table 2 and discussed in § 3, the X-ray position errors include 50 square arcseconds of area within the 2 error ellipse.
The optical candidate is 0.8 away from the R.A. of the X-ray position and 1.7 away from the Declination of X-ray position. Assuming Gaussian statistics, the optical source has 9% probability of occupying the same location as the X-ray source; however, we do not rule out the possibility that this is the counterpart because the Chandra PSF is known to be complicated far off-axis. In addition, as shown in Figure 3, the location of the optical counterpart candidate appears qualitatively reasonable when placed on the X-ray images of s1-86.
4.2.2 Alternate optical source possibilities
If the optical candidate is not the counterpart of the X-ray transient, the candidate must be a different type of optical source that varies by 1.3 mag in brightness. Such sources are not extremely rare. We searched the overlapping portions of our 2 ACS observations for other sources that became fainter by more than 1 mag between the first and second observations. We found 75 such sources in the 9.2752 square arcminutes of overlapping area. Since our 2 error ellipse covers 0.0140 square arcminutes, there is an 11% random probability of one of these sources falling in this region, similar to the probability that the candidate occupies the same position as the X-ray source.
There are several types of variable sources that could show the same behavior as the counterpart candidate, including eclipsing binaries, high-amplitude variable stars, and dwarf nova systems. For example, a common type of variable with properties similar to those of the counterpart candidate is RR Lyrae stars. M31 is known to have 5 RR Lyrae stars per square arcminute (Brown et al., 2004). At , assuming a distance modulus of 24.47 (780 kpc) and foreground extinction (), the counterpart candidate has , typical of RRab Lyrae stars, which can vary by 0.51.5 mag (Binney & Merrifield, 1998). If the candidate is such a star, its period and phase must have allowed us to observe it near maximum during our first HST observation and near minimum during our second HST observation. There were 88.8 days between our two HST observations. If this optical source is an RRab star, its period is likely 0.55 days (Binney & Merrifield, 1998). Therefore, the star would have undergone 161.5 cycles between our observations, allowing us to observe it in opposite phases. It is clearly possible that the counterpart candidate is an unassociated variable star.
5 Conclusions
We have reported the detection of a new, bright transient X-ray source in M31, which we call s1-86 (CXOM31 J004406.7+411220). After aligning the Chandra ACIS-I images to the LGS coordinate system, this source is located at R.A.=00:44:06.68, Dec.=41:12:20.0 with final R.A. and Dec. errors of 1.74′′ and 2.31′′, respectively. The X-ray spectral properties of this source as measured from 3 Chandra ACIS-I detections are typical of known Galactic XRNe. Power-law fits indicate a spectral index of 3 and an absorption column of 2.21021 cm-2. Disk blackbody fits indicate an inner disk temperature decrease from 0.6 keV to 0.4 keV over 1 month and an absorption column of 51020 cm-2. The 0.3–7 keV luminosity was 2.41038 erg s-1 (power-law), or 0.91038 erg s-1 (disk blackbody), depending on the spectral model employed. The X-ray lightcurve exhibits a linear decay, suggesting a large accretion disk.
In two HST ACS observations, we detected only one optical source within 4.5′′ of the X-ray position of the XRN that faded in concert with the X-ray source. After aligning the ACS images to the LGS coordinate system, this optical counterpart candidate was located at R.A.=00:44:06.81 and Dec.= +41:12:24.0 (J2000). While the optical brightness and decay timescale suggest that this optical source is the counterpart, the errors in the X-ray source position allow the possibility that the counterpart candidate is a nearby RRab Lyrae star which we observed near maximum and minimum brightness. If so, no optical counterpart was seen down to .
If the candidate is the optical counterpart and the X-ray luminosity indicated by the power-law spectral fit is correct, then the X-ray/optical luminosity ratio yields predictions for the orbital period of the X-ray binary and the size of the accretion disk. The period prediction is 1.0 day, and the disk size prediction is 0.7 cm. These values are on the low side of model predictions for XRNe with long, linear X-ray decays, and the lower X-ray luminosity given by the disk blackbody spectral fit yields even lower values.
If the optical counterpart was not detected, it was at least 1 mag fainter than the candidate counterpart. This upper-limit to the optical luminosity provides lower-limits on the X-ray/optical luminosity ratios given by both X-ray spectral models. In both cases, these lower-limits yield upper-limits on the orbital period and the disk size that are below model predictions for XRNe with long, linear X-ray decays.
Support for this work was provided by NASA through grant number GO-9087 from the Space Telescope Science Institute and through grant number GO-3103X from the Chandra X-Ray Center. MRG acknowledges support from NASA LTSA grant NAG5-10889.
References
- Binney & Merrifield (1998) Binney, J., & Merrifield, M. 1998, ”Galactic astronomy” (Galactic astronomy / James Binney and Michael Merrifield. Princeton, NJ : Princeton University Press, 1998. (Princeton series in astrophysics))
- Brown et al. (2004) Brown, T. M., Ferguson, H. C., Smith, E., Kimble, R. A., Sweigart, A. V., Renzini, A., & Rich, R. M. 2004, AJ, 127, 2738
- Charles (1998) Charles, P. 1998, in Theory of Black Hole Accretion Disks, 1
- Chen et al. (1997) Chen, W., Shrader, C. R., & Livio, M. 1997, ApJ, 491, 312
- Di Stefano et al. (2004) Di Stefano, R., et al. 2004, ApJ, 610, 247
- Freeman et al. (2001) Freeman, P., Doe, S., & Siemiginowska, A. 2001, in Proc. SPIE Vol. 4477, p. 76-87, Astronomical Data Analysis, Jean-Luc Starck; Fionn D. Murtagh; Eds., 76
- Garcia et al. (2000) Garcia, M. R., Murray, S. S., Primini, F. A., McClintock, J. E., & Callanan, P. J. 2000, IAU Circ., 7498, 3
- King & Ritter (1998) King, A. R., & Ritter, H. 1998, MNRAS, 293, L42
- Kitamoto et al. (1989) Kitamoto, S., Tsunemi, H., Miyamoto, S., Yamashita, K., & Mizobuchi, S. 1989, Nature, 342, 518
- Kong et al. (2001) Kong, A., Garcia, M., Murray, S., Primini, F., McClintock, J., & Di Stefano, R. 2001, The Astronomer’s Telegram, 76, 1
- Kong et al. (2002) Kong, A. K. H., Garcia, M. R., Primini, F. A., Murray, S. S., Di Stefano, R., & McClintock, J. E. 2002, ApJ, 577, 738
- Liu et al. (2001) Liu, Q. Z., van Paradijs, J., & van den Heuvel, E. P. J. 2001, A&A, 368, 1021
- Massey et al. (2001) Massey, P., Hodge, P. W., Holmes, S., Jacoby, G., King, N. L., Olsen, K., Saha, A., & Smith, C. 2001, in American Astronomical Society Meeting, Vol. 199, 13005
- McClintock & Remillard (2004) McClintock, J. E., & Remillard, R. A. 2004, in Compact Stellar X-ray Sources (astro-ph/0306213)
- Negueruela (1998) Negueruela, I. 1998, A&A, 338, 505
- Osborne et al. (2001) Osborne, J. P., et al. 2001, A&A, 378, 800
- Predehl & Schmitt (1995) Predehl, P., & Schmitt, J. H. M. M. 1995, A&A, 293, 889
- Stetson et al. (1990) Stetson, P. B., Davis, L. E., & Crabtree, D. R. 1990, in ASP Conf. Ser. 8: CCDs in astronomy, 289
- Tanaka & Shibazaki (1996) Tanaka, Y., & Shibazaki, N. 1996, ARA&A, 34, 607
- Trudolyubov et al. (2001) Trudolyubov, S. P., Borozdin, K. N., & Priedhorsky, W. C. 2001, ApJ, 563, L119
- van Paradijs & McClintock (1994) van Paradijs, J., & McClintock, J. E. 1994, A&A, 290, 133
- Wagner et al. (1991) Wagner, R. M., Bertram, R., Starrfield, S. G., Howell, S. B., Kreidl, T. J., Bus, S. J., Cassatella, A., & Fried, R. 1991, ApJ, 378, 293
- White & Carpenter (1978) White, N. E., & Carpenter, G. F. 1978, MNRAS, 183, 11P
- Williams (2003) Williams, B. F. 2003, MNRAS, 340, 143
- Williams et al. (2004) Williams, B. F., Garcia, M. R., Kong, A. K. H., Primini, F. A., King, A. R., Di Stefano, R., & Murray, S. S. 2004, ApJ, 609, 735
| ObsID | Date | R.A. (J2000) | Dec. (J2000) | Roll (deg.) | Exp. (ks) |
|---|---|---|---|---|---|
| 4678 | 09-Nov-2003 | 00 42 44.4 | 41 16 08.3 | 239.53 | 3.9 |
| 4679 | 26-Nov-2003 | 00 42 44.4 | 41 16 08.3 | 261.38 | 3.8 |
| 4680 | 27-Dec-2003 | 00 42 44.4 | 41 16 08.3 | 285.12 | 4.2 |
| ID | R.A. (J2000) | Dec. (J2000) | ||||||||
|---|---|---|---|---|---|---|---|---|---|---|
| 4678 | 00 44 06.64 | 0.96′′ | 0.10′′ | 1′′ | 1.96′′ | 41 12 20.0 | 1.68′′ | 0.18′′ | 1′′ | 2.69′′ |
| 4679 | 00 44 06.73 | 1.23′′ | 0.09′′ | 1′′ | 2.23′′ | 41 12 20.1 | 2.40′′ | 0.19′′ | 1′′ | 3.41′′ |
| 4680 | 00 44 06.85 | 3.79′′ | 0.12′′ | 1′′ | 4.80′′ | 41 12 19.9 | 3.96′′ | 0.24′′ | 1′′ | 4.96′′ |
| Mean | 00 44 06.68 | 1.74′′ | 41 12 20.0 | 2.31′′ |
| Date | R.A.(J2000) | Dec.(J2000) | (′′)aaDistance between this source position and the X-ray source position. | Rate (ct s-1) | STmagbbThe ST magnitude of the source is obtained from a system with a flat reference spectrum (see http://www.stsci.edu/hst/acs/documents/handbooks/DataHandbookv2 for more details). | VEGAmagccThe VEGA magnitude of the source is obtained from a system where Vega has a magnitude of 0 at all wavelengths. This magnitude is the best approximation of the Johnson magnitude of the source. |
|---|---|---|---|---|---|---|
| 03-Dec-2003 | 00:44:06.81 | +41:12:24.0 | 4.26 | 1.000.05 | 25.140.05 | 25.750.05 |
| 01-Mar-2004 | 00:44:06.81 | +41:12:24.0 | 4.26 | 0.300.03 | 26.470.11 | 27.080.11 |
| Date | ObsID | CtsaaThe background-subtracted number of counts in the detection. | FluxbbThe exposure corrected 0.3–10 keV flux in units of 10-4 ct cm-2 s-1. | SlopeccSlope of the best-fitting absorbed power law model. | QddThe probability that this fit is representative of the true spectrum, determined from . | HR-1eeHardness ratio calculated by taking the ratio of M-S/M+S, where S is the number of counts from 0.3–1 keV and M is the number of counts from 1–2 keV. | HR-2ffHardness ratio calculated by taking the ratio of H-S/H+S, where S is the number of counts from 0.3–1 keV and H is the number of counts from 2–7 keV. | ggThe absorption-corrected luminosity of the source in units of 1038 (0.3–7 keV). | ||
|---|---|---|---|---|---|---|---|---|---|---|
| 09-Nov-2003 | 4678 | 666 | 5.10.2 | 2.90.2 | 2.250.35 | 39.33/30 | 0.12 | 0.110.04 | -0.580.07 | 2.4 |
| 26-Nov-2003 | 4679 | 465 | 3.60.2 | 3.00.3 | 2.130.47 | 21.40/19 | 0.31 | 0.020.05 | -0.690.08 | 1.8 |
| 27-Dec-2003 | 4680 | 79 | 0.70.1 | 3.40.4 | 2.0hhThe absorption was fixed to fit the spectrum from 27-Dec-2003, as was unconstrained if left as a free parameter. | 3.47/8 | 0.90 | 0.100.11 | -1.140.39 | 0.5 |
| Date | OBSID | TinaaThe temperature of the inner disk in keV. | R bbThe radius of the inner disk in km, assuming the distance to M31 is 780 kpc and the inclination () of the binary is 0 degrees. | QccThe probability that this fit is representative of the true spectrum, determined from . | ddThe absorption-corrected luminosity of the source in units of 1038 (0.3–7 keV). | ||
|---|---|---|---|---|---|---|---|
| 09-Nov-2003 | 4678 | 0.600.04 | 569 | 0.50.1 | 39.37/30 | 0.12 | 0.9 |
| 26-Nov-2003 | 4679 | 0.490.05 | 74 | 0.60.2 | 30.37/19 | 0.05 | 0.6 |
| 27-Dec-2003 | 4680 | 0.370.07 | 65 | 0.5eeThe absorption was fixed to fit the spectrum from 27-Dec-2003, as was unconstrained if left as a free parameter. | 4.51/8 | 0.81 | 0.2 |