Spectropolarimetry of single and binary stars
Abstract
Spectropolarimetry is a photon-hungry technique that will reach fruition in the 8-m telescope age. Here I summarize some of the stellar spectropolarimetric research that my collaborators and I have undertaken, with particular emphasis on the circumstellar environment of massive stars, symbiotic binaries, and star formation.
1 Introduction
Stellar spectropolarimetry111Note that this paper focuses on the use of linear spectropolarimetry, although of course circular spectropolarimetry is an extremely powerful tool for probing stellar magnetic field structures, both at the stellar surface and in circumstellar material (e.g. Donati et al. (2001); Jardine et al. (2002)). is a relatively underused technique that has enormous diagnostic potential, particularly for research into circumstellar matter and close binary systems. The principle difficulty with the method is that very high signal-to-noise observations are required, since typical astrophysical polarimetric signatures may be on the order of a few tenths of a percent. When photon noise is dominant, the polarimetric precision goes as
| (1) |
where is in percent and is the number of photons. One can see that a S/N of 1000 or more per pixel is needed to measure a spectropolarimetric signal at the 0.1% level. At moderate resolutions () this limits even 4-m class telescopes to relatively bright objects (say ). Higher dispersions and fainter objects necessitate even larger apertures, and fortunately spectropolarimetric instrumentation is present or planned on most of the world’s 8-m facilities.
The origin of linear polarization in a stellar context is usually dichroic absorption by dust, or scattering by dust, molecules or electrons (although linearly polarized thermal emission from aligned grains is sometimes observed in the millimetre regime). For an unresolved source an asymmetric geometry with respect to the observer’s sightline is required, for example the alignment of grains by a magnetic field, an asymmetric circumstellar distribution of material such as a disc, or intra-binary scattering. Cancellation between polarized radiation from different regions often reduces the observed polarization to the level of a few percent – nonetheless the polarimetry enables one to probe geometrical parameters of an unresolved object.
In this paper I present a synopsis of some of the stellar spectropolarimetric studies that my collaborators and I have undertaken. I concentrate on three broad areas: Raman-scattering in symbiotic binaries, and its use in measuring orbits in these long-period systems; the use of recombination-line polarimetry to measure global structure in the winds of massive stars; and the use of spectropolarimetric in examining the circumstellar structure of pre-main-sequence stars. In the final section I give a brief account of the instruments and likely avenues of research in the 8-m telescope age.

2 Raman scattering in symbiotic binaries
The spectra of symbiotic stars exhibit both molecular absorption bands and nebular emission lines. It is now known that this so-called ‘combination spectrum’ is formed due to binary interaction between a mass-losing red-giant star and a hot companion (typically a white dwarf), which ionizes the cool wind from the giant. Symbiotic stars are thought to be detached systems Mürset and Schmid (1999), with accretion onto the hot component occurring from the wind rather than via Roche-lobe overflow. Systems that show a stellar spectrum in the IR are classified as S-type systems, while those that show dust emission are denoted D-type.
In a seminal paper Schmid Schmid (1989) determined that the Å emission lines that are observed in 50% of symbiotic systems arise from Raman scattering of the Å O vi resonance doublet by neutral hydrogen. Raman scattering is the inelastic analogue of Rayleigh scattering: the frequency of the scattered photon is different to that of the incident photon, and the scatterer is left in an altered quantum mechanical state. In this case the O vi photons scatter in the far-red wing of Ly and the scattering H0 atom is left in the state. By conservation of energy the frequency of the Raman photon, , is given by
| (2) |
where is the frequency of the Ly transition and is the frequency of the parent photon.

The asymmetry of the scattering geometry, with O vi photons produced near the hot star scattering in the cool star’s wind, coupled with the dipole nature of the scattering event, leads naturally to linear polarization Schmid and Schild (1990). Extensive surveys of symbiotic systems (Schmid and Schild (1994); Harries and Howarth (1996a)) revealed that the Raman lines often have a complex structure, typically comprising two or three peaks in both intensity and polarization accompanied by a 90∘ position angle (PA) flip and/or PA rotation (see, e.g., Figure 1). The symbiotics show large line polarizations (up to %), with the strongest and most highly polarized lines found in D-type (dusty) Mira systems.
Numerical modelling of the Raman-line formation process (Schmid (1996); Harries and Howarth (1997); Lee and Lee (1997)) indicates that the PA of the blue wing of the Raman-line polarization is perpendicular to the plane containing the binary line-of-centres and the observer’s line of sight. The models further demonstrate that the magnitude of the line polarization () is also a simple function of orbital phase
| (3) |
where is the angle between the observer’s sightline and the binary line-of-centres, and is a scale factor which accounts for geometrical and physical parameters (interbinary distance, stellar radii; mass-loss rate, velocity law, etc). By observing the change in line polarization with time, it is possible to derive orbital parameters (e.g., period, inclination, PA of line-of-nodes) with analogous methods to those used for visual binaries. The first ‘spectropolarimetric orbit’, that of SY Mus (Figure 2; Harries and Howarth (1996b)), was followed by those of AG Dra and Z And (Schmid and Schild (1997a, b)), while follow-up observations yielded orbits of four additional systems (CD, Hen 1242, M1-21, V455 Sco) Harries and Howarth (2000), thereby doubling the number of known orbits with d.

It has been shown by Mürset & Schmid (Mürset and Schmid (1999)) that there is a strong correlation between orbital period and spectral type of the cool component, with the majority of systems lying close to a straight line relating the spectral subtype to the orbital period. For a given subtype no systems are found with substantially shorter periods. The minimum period locus is given by
| (4) |
where is the M-class subtype and is in days (see Figure 3a). Mürset & Schmid proposed that this period limit is related to the red giant radius, which was found to be for most systems (where is the distance from the primary to the inner Lagrangian point). Essentially this means that for binary to appear as a symbiotic it must be close enough for significant wind accretion onto the hot component, but wide enough that the binary is detached (Figure 3b). Our systems with spectropolarimetric orbits conform to this relation, excepting CD, which has an exceptionally early spectral-type for its cool component (K7).
The spectropolarimetric approach to orbit determination has unique advantages. First, because the observed quantities can be determined to a small fraction of the orbital amplitudes (e.g., PA to in 180∘), the approach is extremely efficient – e.g., in the favourable case of SY Mus, we were able to determine correct orbital characteristics from just four observations, whereas the same information from traditional radial-velocity techniques required many observing nights Schmutz et al. (1994). Secondly, the amplitude of variation of the polarization is independent of orbital period, so that adequately sampled datasets are capable of yielding accurate orbital characteristics for systems with periods of from a few months to many years (unlike normal spectroscopic methods). Our group, along with Schmid’s at ETH Zürich, are continuing to obtain data on various symbiotics with the aim of establishing periods for many more S-type systems, and obtaining the first reliable D-type orbit. The latter goal is obviously long-term, since D-type systems are likely to have periods of many decades!
3 The geometry of stellar winds
Massive stars shed mass via high-speed, radiation-driven winds. Mass-loss rates of to 10-4 M⊙ yr-1 are typical, with terminal speeds of 1000–3000 km s-1. Stellar wind models are often used to fit recombination line profiles (such as H) in order to determine mass-loss rates. This approach essentially reduces to ‘counting’ recombinations, based on the standard assumptions of homogeneity and sphericity. Departures from either will lead to an overestimate of the true mass-loss rate: a wind that is clumpy on small scales, or is global distorted, will have an increased rate of recombinations (which is a density-squared process) per unit mass, so a structured wind will produce greater line emission than a smooth wind with the same mass-loss rate.
So how applicable is the assumption of sphericity? The winds cannot be imaged directly, but fortunately polarimetry provides an indirect probe of the geometry of the wind near to the star. Continuum photons from the star will pass through the ionized wind, and some will be electron-scattered which introduces linear polarization to the starlight. The nett polarization will be zero for a spherical distribution of electrons, but will be non-zero for any geometry that is not circularly symmetric with respect to the observer’s line of sight. The recombination line emission, which is produced further out in the wind, will ‘see’ a lower electron-scattering column, and will therefore be less polarized than the continuum. Spectropolarimetry of a non-spherical wind should therefore show a polarized continuum (on the order of a few tenths of a percent) with the magnitude of the polarization dropping at the emission line wavelengths, as the polarized continuum is diluted by unpolarized line emission. This known is the ‘line effect’. As an illustration I have plotted polarization spectra of two Wolf-Rayet (W-R) stars in Figure 4: note the obvious decline in continuum polarization magnitude across the emission lines, a sure indication that the stellar winds in these objects depart from spherical symmetry.

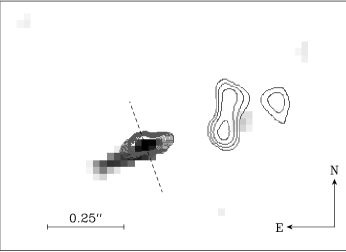
For WR137 we have other indicators that wind may be asymmetric. This WC star has an O-star binary companion in an eccentric orbit with a period of years. At periastron the interaction of the winds from the two components provides the necessary conditions for the condensation of warm carbonaceous dust grains, which produce a near-IR excess Williams et al. (2001). There is an intimate relationship between the solar-radius-scale geometry of the stellar wind from polarization, and the larger scale distribution of newly formed dust (many hundreds of AU) – see Figure 5 and Harries et al. (2000). The link between near-star geometry and a large-scale nebula has also been established for the Luminous Blue Variable (LBV) AG Car Schulte-Ladbeck et al. (1994). Spectropolarimetry of this object shows a strong line effect at H, along with substantial variation (%) in continuum polarization. The PA of the intrinsic polarization is aligned with the major axis of the AG Car ring nebulae and perpendicular to its jet, indicating that the resolved circumstellar environment is already present within a few stellar radii of the central object.
The magnitude of the continuum polarization () for a given stellar wind geometry and viewing angle () may, in the optically thin limit, be computed analytically Brown and McLean (1977):
| (5) |
where is the angle-averaged electron-scattering optical depth of the envelope and is a shape factor. The degeneracy between the stellar wind geometry and the viewing angle means that studying objects on an individual basis is rather difficult, but if a large enough sample is obtained it is possible to disentangle the two statistically. We gathered a spectropolarimetric data set of 16 W-R stars using the 4-m William Herschel Telescope (WHT) and the ISIS spectrograph Harries et al. (1998). A statistical analysis of these data using Monte-Carlo based K-S tests enabled us to show that about 15% of W-R stars show a global departure from spherical symmetry. The level of the intrinsic polarization is consistent with an equator-to-pole density ratio of 2–3. We postulated that the line-effect systems represented the most rapidly rotating W-R stars, in which the rotation was having a significant affect on the wind dynamics.
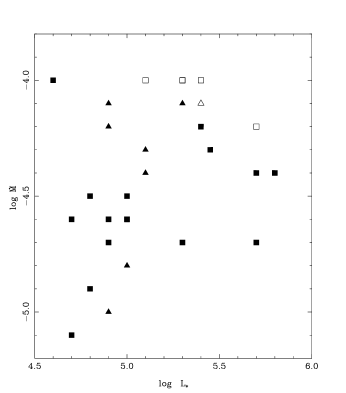
Interestingly the line-effect systems are clustered towards high mass-loss rates and high-luminosity (Figure 6). Although at first sight this appears to suggest that this may be the root cause for the wind asymmetry, one should note that these quantities are very dependent on small and large-scale structure, as noted above. In other words the high mass-loss rates and luminosities determined by the models may be a result of applying spherically symmetric models. Mass-loss rates derived from thermal radio emission, which are the least model-dependent, show good agreement with those derived from the optical recombination lines. This does not mean that the mass-loss rate values are correct in an absolute sense, since both the radio continuum and the recombination lines scale as density-squared, but the agreement does indicate that the degree of wind asymmetry is similar at the radii for optical depth of both the optical and the radio .
Since departures from spherical symmetry appear to be relatively common for the W-R stars, and also occur in LBVs, it seemed natural to search for evidence for global structure in the winds of O-supergiants. We obtained H spectropolarimetry of a sample of 20 Northern, and combined these data with -band spectropolarimetry obtained with the 4-m United Kingdom Infrared Telescopes and low resolution optical spectropolarimetry from Pine Bluff Observatory Harries et al. (2002). Somewhat surprisingly, the spectropolarimetry revealed that the single O-supergiants typically have intrinsic polarizations of % (which corresponds to an equator:pole asymmetry of approximately less than 1.25). It appears that the wind line-driving mechanism in rapidly-rotating O supergiants (whose winds are optically thin) is relatively insensitive to rotation compared to the optically-thick line-driving mechanism of W-R outflows.
W-R stars are also known to have small-scale clumps that appear to accelerate slowly from the star (e.g. Lepine et al. (1996)), and there is spectroscopic evidence for similar structures in the O supergiant Puppis Eversberg et al. (1998). These migrating density structures could potentially be identified polarimetrically, but numerical models of density enhancements propagating through the wind predict polarizations of close to 0.1%–0.2% Harries (2000), which is uncomfortably close to the current limits on the absolute precision of polarimetric observations. It is clear that very precise techniques will be needed to probe these clumps in the winds of O supergiants.
4 Pre-main-sequence stars
The broad picture of low-mass star formation, from the collapse of a gravitationally unstable molecular cloud, through to a pre-main-sequence star surrounded by a dusty accretion disc, is well-established. During the final, classical T Tauri star (CTTS) phase magnetospheric accretion is thought to occur, with the star’s magnetic field disrupting the disc and channelling the material onto the surface, where its kinetic energy is liberated at hot spots. However, the situation for intermediate and high-mass star formation is much more confused, with a lack of clear-cut evidence for circumstellar discs. In the previous sections I have shown that line spectropolarimetry can be a powerful probe of the circumstellar geometry, and we are now in the process of applying spectropolarimetric techniques to pre-main-sequence (PMS) stars.
We have obtained a large sample of H polarization spectra Herbig Ae/Be stars Vink et al. (2002). The two classes of star show a dichotomy in spectropolarimetric characteristics. The Herbig Be stars typically show the classical depolarization line effect, which is indicative of a large volume of H emitting material embedded in an asymmetric envelope. The Herbig Ae stars on the other hand show a more complex polarization through the line, with some stars showing significant polarized H emission. This suggests that Herbig Ae stars have compact sources of H emission, possibly magnetospheric accretion streams, with H photons scattering in the surrounding asymmetric medium. It is not completely clear whether the scatterers here are dust or electrons, although thermal motions of electrons should lead to significant smearing of the line polarimetry, which is not observed. Our results indicate that the magnetospheric accretion paradigm for low-mass star formation may extend to higher masses.

A significant investment has been made in photopolarimetric studies of classical T Tauri stars (CTTS), which may show continuum polarizations of a few percent e.g. Bastien (1982, 1985); Menard and Bastien (1992); Gullbring and Gahm (1996). This polarization is variable, perhaps due to changes in the illumination of the scattering envelope due to hot spots Wood and Whitney (1998). Since it was thought that the line and continuum photons from the central object were scattered by the same dusty envelope the expectation was that there should be no line effect. However our recent observations of RY Tau (Figure 8, Vink et al. (2003)) show a dramatic change in the polarization through H. It appears that RY Tau is not exceptional in this regard: in our recent survey 9 out of 10 CTTS showed a detectable change in polarization across H Vink et al. (2005a). These observations are qualitatively consistent with scattering of a compact source of H photons off a circumstellar disc.
A more detailed interpretation of the spectropolarimetry requires numerical modelling. As a first attempt we have examined the polarimetric signature of dipolar scattering of a compact line source off optically-thin and optically-thick dusty discs Vink et al. (2005b) using the Monte-Carlo radiative-transfer code torus Harries (2000). We find that the PA dependence of the line profile is an indicator on the extent of the disc, with a double PA rotation through the line corresponding to a disc with a negligible inner hole, and a single PA rotation indicating a substantial evacuated area around the central star. By interpreting the observations in the context of these numerical simulations we will begin to place strong constraints on the circumstellar environment of PMS across the mass spectrum.

5 The future
Spectropolarimetric capabilities are already available on 8-m class telescopes. For example, VLT/FORS offers both circular and linear spectropolarimetry, but at its maximum resolution is insufficient for most of the line polarization work described here (although the broad emission lines in supernovae can be resolved). Similarly the Keck/LRIS combination is limited essentially to continuum studies and is used predominantly for extragalactic research. The two 8-m Gemini telescopes are due to be fitted with facility polarization modulator units (GPOL), which will eventually provide a number of their optical and near-IR instruments, including a high-dispersion echelle spectrograph, with a polarimetric capability. The Prime Focus Imaging Spectrograph (PFIS) on the 10-m South African Large Telescope will provide a medium resolution () spectropolarimetric capability, and is ideally suited to stellar work.
Pleasingly it appears that spectropolarimetry is now viewed as a standard mode by spectrograph developers. The proliferation of spectropolarimetry in the 8-m telescope age will lead to exciting new advances in stellar astrophysics, for example in the investigation of the link between rotation and outflow asymmetries and structure in massive stars and asymmetries in core collapse supernovae, which can show a line effect (Cropper et al. (1988); Wang et al. (2003)), and may have viewing-angle-dependent observed luminosities. Rotation and asymmetry obviously play a key role in the collapsar model for gamma ray burst progenitors MacFadyen and Woosley (1999), and high-resolution linear spectropolarimetry of the burst afterglows should yield valuable insights. Extending the spectropolarimetric study of W-R stars into the low-metallicity environment of the Magellanic clouds would provide a good test of line-driving theories. The move to longer wavelengths will also lead to new discoveries, for example by probing the circumstellar environments of highly obscured objects, such as Class I protostars that are still embedded in their nascent molecular clouds.
References
- Donati et al. (2001) Donati, J.-F., Wade, G. A., Babel, J., Henrichs, H. f., de Jong, J. A., and Harries, T. J., MNRAS, 326, 1265–1278 (2001).
- Jardine et al. (2002) Jardine, M., Collier Cameron, A., and Donati, J.-F., MNRAS, 333, 339–346 (2002).
- Mürset and Schmid (1999) Mürset, U., and Schmid, H. M., A&AS, 137, 473–493 (1999).
- Schmid (1989) Schmid, H. M., A&A, 211, L31–L34 (1989).
- Schmid and Schild (1990) Schmid, H. M., and Schild, H., A&A, 236, L13–L16 (1990).
- Schmid and Schild (1994) Schmid, H. M., and Schild, H., A&A, 281, 145–160 (1994).
- Harries and Howarth (1996a) Harries, T. J., and Howarth, I. D., A&AS, 119, 61–90 (1996a).
- Schmid (1996) Schmid, H. M., MNRAS, 282, 511–529 (1996).
- Harries and Howarth (1997) Harries, T. J., and Howarth, I. D., A&AS, 121, 15–44 (1997).
- Lee and Lee (1997) Lee, K. W., and Lee, H., MNRAS, 292, 573–+ (1997).
- Harries and Howarth (1996b) Harries, T. J., and Howarth, I. D., A&A, 310, 235–238 (1996b).
- Schmid and Schild (1997a) Schmid, H. M., and Schild, H., A&A, 321, 791–802 (1997a).
- Schmid and Schild (1997b) Schmid, H. M., and Schild, H., A&A, 327, 219–223 (1997b).
- Harries and Howarth (2000) Harries, T. J., and Howarth, I. D., A&A, 361, 139–152 (2000).
- Schmutz et al. (1994) Schmutz, W., Schild, H., Muerset, U., and Schmid, H. M., A&A, 288, 819–828 (1994).
- Williams et al. (2001) Williams, P. M., Kidger, M. R., van der Hucht, K. A., Morris, P. W., Tapia, M., Perinotto, M., Morbidelli, L., Fitzsimmons, A., Anthony, D. M., Caldwell, J. J., Alonso, A., and Wild, V., MNRAS, 324, 156–166 (2001).
- Harries et al. (2000) Harries, T. J., Babler, B. L., and Fox, G. K., A&A, 361, 273–282 (2000).
- Schulte-Ladbeck et al. (1994) Schulte-Ladbeck, R. E., Clayton, G. C., Hillier, D. J., Harries, T. J., and Howarth, I. D., ApJ, 429, 846–856 (1994).
- Marchenko et al. (1999) Marchenko, S. V., Moffat, A. F. J., and Grosdidier, Y., ApJ, 522, 433–439 (1999).
- Brown and McLean (1977) Brown, J. C., and McLean, I. S., A&A, 57, 141–+ (1977).
- Harries et al. (1998) Harries, T. J., Hillier, D. J., and Howarth, I. D., MNRAS, 296, 1072–1088 (1998).
- Harries et al. (2002) Harries, T. J., Howarth, I. D., and Evans, C. J., MNRAS, 337, 341–355 (2002).
- Lepine et al. (1996) Lepine, S., Moffat, A. F. J., and Henriksen, R. N., ApJ, 466, 392–+ (1996).
- Eversberg et al. (1998) Eversberg, T., Lepine, S., and Moffat, A. F. J., ApJ, 494, 799–+ (1998).
- Harries (2000) Harries, T. J., MNRAS, 315, 722–734 (2000).
- Vink et al. (2002) Vink, J. S., Drew, J. E., Harries, T. J., and Oudmaijer, R. D., MNRAS, 337, 356–368 (2002).
- Bastien (1982) Bastien, P., A&AS, 48, 153–164 (1982).
- Bastien (1985) Bastien, P., ApJS, 59, 277–291 (1985).
- Menard and Bastien (1992) Menard, F., and Bastien, P., AJ, 103, 564–572 (1992).
- Gullbring and Gahm (1996) Gullbring, E., and Gahm, G. F., A&A, 308, 821–827 (1996).
- Wood and Whitney (1998) Wood, K., and Whitney, B., ApJL, 506, L43–L45 (1998).
- Vink et al. (2003) Vink, J. S., Drew, J. E., Harries, T. J., Oudmaijer, R. D., and Unruh, Y. C., A&A, 406, 703–707 (2003).
- Vink et al. (2005a) Vink, J., Harries, T., Drew, J., Oudmaijer, R., and Unruh, Y., MNRAS, in press (2005a).
- Vink et al. (2005b) Vink, J., Harries, T., and Drew, J., MNRAS, in press (2005b).
- Cropper et al. (1988) Cropper, M., Bailey, J., McCowage, J., Cannon, R. D., and Couch, W. J., MNRAS, 231, 695–722 (1988).
- Wang et al. (2003) Wang, L., Baade, D., Höflich, P., and Wheeler, J. C., ApJ, 592, 457–466 (2003).
- MacFadyen and Woosley (1999) MacFadyen, A. I., and Woosley, S. E., ApJ, 524, 262–289 (1999).