A study of high velocity molecular outflows
with an up-to-date sample
††thanks: Table 1 is only available in electronic at the CDS via anonymous ftp to
cdsarc.u-strasbg.fr (130.79.125.5) or via http://cdsweb.u-strasbg.fr/Abstract.html
A statistical study of the properties of molecular outflows is performed based on an up-to-date sample. 391 outflows were identified in published articles or preprints before February 28, 2003. The parameters of position, morphology, mass, energy, outflow dynamics and central source luminosity are presented for each outflow source. Outflow lobe polarity is known for all the sources, and 84% are found to be bipolar. The sources are divided into low mass and high mass groups according to either the available bolometric luminosity of the central source or the outflow mass. The pace of discovery of outflows over the past seven years has increased much more rapidly than in previous periods. Surveys for outflows are still continuing. The number of high-mass outflows detected (139) has considerably increased, showing that they are commonly associated with massive as well as low mass stars. Energetic mass ejection may be a common aspect of the formation of high mass as well as low mass stars. Outflow masses are correlated strongly with bolometric luminosity of the center sources, which was obtained for the first time. There are also correlations between the central source luminosity and the parameters of mechanical luminosity and the thrust or force necessary to drive the outflow. The results show that flow mass, momentum and energy depend on the nature of the central source. Despite their similarity, there are differences between the high mass and low mass outflows. Low mass outflows are more collimated than high mass outflows. On average, the mass of high mass sources can be more than two orders of magnitude larger than those of low mass outflows. The relation between flow mass and dynamical time appears to differ for the two types of outflows. Low mass sources make up 90% of outflows associated with HH objects while high mass outflows make up 61% of the sources associated with H2O masers. Sources with characteristics of collapse or infall comprise 12% of the entire outflow sample. The spatial distribution of the outflow sources in the Galaxy is presented and the local occurrence rate is compared with the stellar birth rate.
Key Words.:
star: formation – stars: winds – ISM: jets and outflows – ISM: kinematics and dynamics1 Introduction
As one of the most exciting discoveries in astronomy in the past three decades, high velocity molecular outflows continue to attract great attention from researchers. Since their first discovery in 1976 (Zuckerman et al. 1976; Kwan & Scoville 1976; Zuckerman & Palmer 1975), outflows have been detected at a high rate. 67 had been discovered by 1984 (Lada 1985), 144 by 1989 (Fukui 1989), and 264 by 1996 (Wu et al. 1996).
Outflows were thought to be the earliest observable signatures of star formation. Although evidence of mass loss for young stars had been detected previously in the optical spectrum (Herbig 1960; Kuhi 1964), a better understanding of such mass loss in early evolutionary phases was only acquired after the discovery of molecular outflows in the material surrounding the embedded young stellar objects (YSOs). Molecular outflows show various characteristics such as radio and optical jets, atomic hydrogen stellar wind, molecular hydrogen jets and interstellar masers. The stars eject mass in energetic flows during formation (Lada 1985; Lizano et al. 1988; Natta et al. 1988; Lane 1989; Felli et al. 1992; Russell et al. 1992; Matzner & Mckee 1999; Bally et al. 2001; Reipurth et al. 2002). In the 1990s, progress was made in observing and understanding the collapse of protostars (Zhou 1992; Evans 1999; Myers et al. 1996). According to theoretical models, collapses should occur before outflow (Shu et al. 1987). However, nearly all the candidates of collapsing protostars are found in outflow sources.
When advancement of observational techniques allowed the detection of high velocity molecular outflows by high J transitions, extremely high-velocity molecular outflows or highly collimated jet-like outflows were studied extensively (Koo 1989; Bachiller et al. 1991; Choi et al. 1993; Narayanan & Walker 1996).
More recently, considerable progress in outflow detection has been made in distant and complex high-mass star formation regions (Beuther et al. 2002c; Zhang et al. 2001; Shepherd & Churchwell 1996b; Wu et al. 1999). In the surveys of high-mass star formation regions conducted by Beuther et al. (2002c) and Zhang et al. (2001), the outflow detection rates reached 80% and 90%, respectively. Recent studies show that the sources in these surveys are either precursors of ultracompact (UC) HII regions, or are at very early evolutionary stages (Molinari et al. 2002; Beuther et al. 2002b).
The outflow parameters and their correlations have been investigated (Rodríguez et al. 1982; Bally & Lada 1983; Cabrit & Bertout 1992; Shepherd & Churchwell 1996a; Ridge & Moore 2001). Mechanisms of outflow collimation and the forces driving the outflows have been proposed as well. However, the correlation between morphology, physical parameters and the central source conditions are still not well understood. For example, it is not clear if the collimation is correlated with the driving force. The correlation among bolometric luminosity of the center source, the required force and mechanical luminosity was investigated by Bally & Lada (1983) and Rodríguez et al. (1982). As the correlation was discovered to be weak, a larger sample is required.
To further understand the mechanisms of high velocity outflows, we conducted an analysis based on an up-to-date sample. Our calculations and conclusions are presented in this paper.
The used data in this paper are heterogeneous. The outflows were detected at different stages of the young stellar objects: high mass sources from pre-UCHII region to UCHII region and low mass sources from Class 0 to FU Orionis. The observational sensitivity and the calculation method also varied from source to source. However, we believe that our sample is sufficiently large to provide the overall physical characteristics of outflows. Sect. 2 presents the sample, the catalogue and a brief analysis. The morphology analysis in Sect. 3. Sect. 4 discusses the physical parameters. The associated objects or phenomena of outflows are discussed in Sect. 5. Sect.6 describes the spatial distribution of outflows. We give a summary in Sect. 7.
2 The catalogue
2.1 The sample
We compiled outflow sources mapped mainly in emission lines of low transitions ( and ) of CO showing evidence of large scale red and blue lobes. The catalogue of 1996 (Wu et al. 1996) included 28 sources without CO maps (with superscript a in the source name). We exclude those sources that have not been mapped so far. If an outflow was detected with CO or higher transition lines, it is noted in the table accordingly. Some authors detected molecular outflows with other molecular species, such as SiO, CS, HCO+ (e.g. Megeath & Tieftrunk 1999; Wolf-Chase et al. 1998; Garay et al. 1998; Hofner et al. 2001). These species are not included in this catalogue.
The sources presented in this new catalogue were identified as high velocity molecular outflows in published findings or in preprints published before February 28, 2003. There are 397 sources; 391 show single outflows, 6 were observed as single outflows but were shown later to be of multiple sources. These six were presented in the catalogue, but are not included in our analysis.
2.2 The tables
Table 1a and 1b list the high velocity molecular outflows and their parameters. Some of the outflows have been investigated by multiple authors, and have been mapped more than once. For these sources several entries are listed. Each entry corresponds to the references listed in the last column of Table 1b. There are 24 columns for each entry. Column 1-13 are in Table 1a, and the remaining columns are in Table 1b. The sources are presented in order of right ascension.
Table 1a contains the basic parameters of the outflows:
-
•
Column 1 (No.) is the sequence number of the outflow.
-
•
Column 2 (Name) the source name and the alternative name if any.
-
•
Column 3 () and 4 () are the right ascension and declination (1950.0).
-
•
Column 5 () and 6 () are the galactic longitude and latitude.
-
•
Column 7 () and 8 () are the distance from the sun and altitude from the Galactic plane.
-
•
Column 9 () lists the full line-width at 0.1-0.2K above the baseline. For extremely high velocity sources, an additional line-width measured at tens of milli-kelvins is provided.
-
•
Column 10 (Po.) shows the polarity of the outflow. Here, ‘Bi’ represents bipolar outflow; ‘MB’ and ‘MR’ indicate blue and red monopolar outflows, ‘Multi’ means multiple outflows and ‘Iso’ isotropic outflows.
-
•
Column 11 () and 12 () present the size and the collimation factor, respectively. To calculate the collimation factor, we first consider an outflow as an ellipsoid. Then we measure the area and maximum angular extent (the major radius ) of the outflow, and calculate the minor radius. The ratio of the major and minor radii is the collimation factor (Bally & Lada 1983). The value underlined in column 12 is quoted from references where the same method was employed.
-
•
Column 13 () shows the bolometric luminosity of the center source which is the deriving source or its candidate, indentified by infrared photometry or by IRAS data.
The physical parameters are listed in Table 1b (column 14-24), mainly derived from lower level CO lines (CO , ). If the parameters were calculated with CO or higher levels, we note them with ‘c’. For extremely high velocity outflows we only list the total velocity range.
-
•
Columns 14 and 15 contain source numbers and their names corresponding to Table 1a column 1 and 2.
- •
-
•
The momentum (), kinetic energy () and dynamic time () of the outflows are listed in column 17, 18 and 19, respectively (Lada 1985).
- •
- •
-
•
Column 23 (IIH2WI) presents the phenomena associated with the outflows. ‘II’ stands for UCHII regions, ‘H’ for optical jet or HH objects, ‘2’ for H2 jet, ‘W’ for water maser, and ‘I’ for infall or collapse candidates.
-
•
Column 24 (Ref.) presents the references.
2.3 Classification
The bolometric luminosity of the center source of the catalogued outflows ranges from one tenth to more than times solar luminosity (). We adopt as a criterion to distinguish between high-mass sources and low-mass sources. Young high-mass stellar sources are brighter than at minimum. On the H-R diagram, of low-mass and intermediate mass sources is mostly below (Levreault 1985, and references therein). The criterion of was similarly employed in the comparative study of different mass molecular outflows or cores (Shepherd & Churchwell 1996a; Fukui 1989; Wu et al. 2001).
Many sources have more than one set of parameters derived from different observations, therefore we classify them according to the following considerations. First we only classified sources whose multiple measurements of masses have consistent values either larger or smaller than 1000 . In the classified sources, 292 sources have available measurements, of which 120 (41 %) have , and 172 (59 %) have . The rest of the sources have no available , but some have available outflow gas masses. Of the 113 sources with and with available masses, 94 (82%) have ; for 138 sources with and with available masses, 111 (80%) have . Sources whose masses observed by different authors have values both larger or smaller than were not taken into account in the above calculation. Thus, the two percentages cited above are lower limits. Further statistics show that the outflow mass is correlated with (see Sect. 4.1). For sources without but with mass available, we use as a criterion to classify them. Among these sources there are 19 with and 51 with . We refer to the 139 sources with (120) or (19) as the high mass group and the 223 sources with (172) or (51) as the low mass group in the following text. Currently we have not found the mass or bolometric luminosity for 29 sources. These sources need further examination.
2.4 Development of outflow detections
New outflows have been detected and surveyed at an accelerated rate in the past two decades. There are now 397 identified sources (including 6 unresolved outflows). The number of sources is seven times greater than that catalogued in 1985 (which had at most 55 mapped) (Lada 1985), 244 more than that of 1989 (Fukui 1989), and 159 more than that of 1996 (Wu et al. 1996).
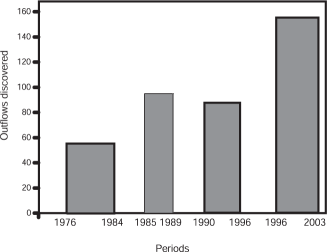
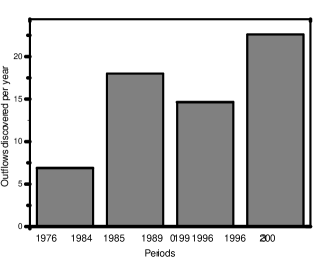
Fig. 1a is the diagram of the number of outflows mapped in four periods, which is defined with the available catalogues of outflows. Period I is from 1976 to 1984 with 55 detected outflows (Lada 1985); Period II is from 1985 to 1989, with 95 outflows (Fukui 1989); Period III is from 1990 to 1995, with 88 outflows (Wu et al. 1996); Period IV is from 1996 to 2003 with 159 outflows (this work). The number of detected outflows has increased, especially in period IV (see Fig. 1a). Fig. 1b is the average number of mapped outflows in these four periods. The average number of outflows per year are 6.9, 19, 14.6 and 22.7 for the four periods respectively. The trend of increasing number of detected outflows is evident, showing the development of outflow detection in recent years.
In period II mainly low mass outflows were added (Fukui 1989), while in period IV the number of high mass sources increased rapidly. Among the sources detected up to 1995, high mass sources occupy only 31% (65 of 210 outflow sources in the high mass group with the same classification). Now there are 139 in the high mass group among 362 sources with available or . The ratio is 38%. The results show that high velocity molecular outflows are common in high mass star formation regions considering the fewer samples of high mass stars. It may suggest that high mass stars still form through an accretion-outflow dynamic process, like the formation process of low mass stars.
Is the percentage of high mass here beyond that expected from the IMF? Here 38% is the ratio of sources in the ‘high mass group’ to the total number of sources in both the high and low mass groups. Part of the ‘high mass group’ are actually intermediate mass sources. Considering the sources with , the percentage drops to 23% (83/362). The percentage of sources associated with UCHII regions (23% (90/391))is also lower than 38%. This percentage still exceeds what is expected from the IMF. But observed IMFs are derived from counting main-sequence stars in solar neighborhood (Kroupa et al. 1990; Salpeter 1955), According to Fig. 9, massive outflows are easier to detect at increasing distance. Outside the 2 kpc circle, most outflows belong to the high mass group, while within 1 kpc, there are only 10% (16/167) high mass outflows.
A notable trend in outflow research is that interferometers are being applied to measure the outflow regions. Massive outflows have been observed with higher spatial resolution and sensitivity in regions such as IRAS 05358+3543, G196.16 and NGC 7129 (Beuther et al. 2002a; Shepherd et al. 1998; Fuente et al. 2001).
3 Morphology and collimation
The polarity was known for all the outflows. 327 (84%) sources show bipolar structure; 50 (13%) sources are mono-polar, of which 28 are red polar. There are 12 (3%) multi-polar sources; if a source was detected as bipolar first but was later found to have multiple polarities we count it as multi-polar. Two sources are still isotropic (No. 231 M8E and No. 391 MWC 1080). Compared with the sources cataloged before (Wu et al. 1996; Lada 1985), the number of multi-polar sources has increased (there is only one in the previous periods) and the number of isotropic sources decreased (4 in Period I, 3 in Period III), which can be attributed to the enhanced spatial resolution of the detection equipment.
The collimation factor is used to investigate the morphology of outflows. Different methods were employed to analyze collimation properties of outflows (Cabrit & Bertout 1992; Levreault 1985). In this paper the collimation factor was obtained according to Bally & Lada (1983) . Here we analyze the relationship between the collimation factor, the bolometric luminosity of the central source and the angle sizes.
As shown in Table 1a, there are 213 sources with available collimation factors. The average value of the collimation factor for all the sources is 2.45, with a standard deviation of 1.74, which is almost the same as that catalogued in period I and III (Lada 1985; Wu & Huang 1998). The average collimation values for high mass and low mass group members are 2.05 and 2.81, with a standard deviation 0.96 and 2.16 respectively. The above values are similar to those in period III, 1.99 and 2.54 for these two groups according to the same statistical method (Wu & Huang 1998). These results show that the low mass outflows are better collimated than the high mass ones. Although the overall instrumental angular resolution in period IV has increased,
the observed collimation has not improved much as a whole. This is likely due to the increased number of massive outflows.
Figure 2 is the plot of vs. . Solid triangles indicate low mass sources and squares indicate high mass ones. The solid line is a linear fit of the plots: ; the correlation coefficient is poor, . There is a slight difference between high mass and low mass outflow collimations. To analyze the effect of angle size on the collimation factor, we plot vs. the angular size in Fig. 3. It shows that there is no obvious correlation between collimation factor and angular size. To further investigate the relation between and , an analysis was made of all sources whose angle size is five times larger than the beam size. Figure 4 plots the vs. the for these sources. The solid line is the linear least-square fit: ; the correlation coefficiency is also poor, . The average values of for the sources with large angle sizes are 2.16 with a standard deviation 0.91 for high mass sources and 3.00 with a standard deviation 2.02 for low mass sources. Both are better than those before the effect of beam size was removed ( and for the two group sources). It shows again that the collimation degree tends to be lower with increasing bolometric luminosity of the centre source. However, the weak correlation between and remains for sources with large angle sizes, as Fig. 2 shows. This may be related to the driving processes of the outflows. Outflows driven by wide-angle wind may be less collimated than those driven by jets. Now it is believed that low mass outflows are driven by bow shocks (Lee et al. 2000; Chernin & Masson 1995; Raga & Cabrit 1993; de Young 1986) while wide-angle wind may drive massive outflows (Molinari et al. 2002). Low angular resolution also made it difficult to see the fine structure of multi-flows. For example, IRAS 05358+3543, detected as one outflow, was separated into at least three outflows by the Plateau de Bure interferometer (Beuther et al. 2002a, c), including one highly collimated outflow. However, this is not to say that instruments determine the values of collimation. Of the sources depicted in Fig. 3, some small angle size outflows still have good collimation.
The correlation between and is not as obvious as that between outflow mass and bolometric luminosity (see next section). Both Fig. 2 and 4 show that for collimation there is no definite dependance on the bolometric luminosity of the driving sources. Besides the sensitivity and resolutions of the observation equipment, several effects may affect the measurement of collimation degree of the outflows. For example, changing the projection along the line of sight can change the value of the apparent collimation factor for the same bipolar outflow to be smaller or larger than the intrinsic degree of collimation (Wu & Huang 1998). Several factors may influence the intrinsic degree of collimation. Physical conditions of the environment will affect flow morphology. Recently a numerical simulation showed that environmental structure may determine the collimation degree of observed outflows of massive YSOs (Bonnell & Bate 2002). Evidence was also found for the existence of an aligned magnetic field in the outflow regions (Greaves et al. 2001; Houde et al. 2001). Lastly, collimation may also be related to the evolution stage of the central object, and to the acceleration or deceleration phase of the flow itself (Cabrit & Bertout 1986, 1990; Shu et al. 1987). The outflows in Class 0 objects with a cold black body spectral energy distribution (SED) are more collimated than those in Class I objects whose SED is wider than that of a black body and whose positive indices show a more evolved status (Bachiller 1996; Bontemps et al. 1996; Gueth & Guilloteau 1999).
4 Physical parameters
Although the physical parameters of outflows have wide ranges, we believe that statistics derived from a large sample should still reveal general characters and correlations of the parameters of the outflows and indicate their driving mechanisms. ranges from 0.01 to 3.98 pc; mass from to ; momentum from to ; energy: to ; dynamic times from to ; mechanical luminosity from to ; force from to ; mass loss rate from to . (Notice that the limits of different parameters may not come from the same source.) The property value ranges are wider than those of the sources measured in a single survey (Bally & Lada 1983; Levreault 1985; Fukui 1989; Ridge & Moore 2001; Zhang et al. 2001; Beuther et al. 2002c); these results from the fact that multiple surveys for different mass objects are included in our sample. Our sample also includes the most massive and the smallest outflows (see Sect. 4.2). However sources with parameters near the limit are rare.
We estimate the maximum possible errors that different considerations in deriving physical parameters may bring. The outflow emission at line wings is often accepted as being optically thin. Nevertheless, some authors deal with it using a derived or assumed optical depth, which may bring a factor of about 5 to the final value of outflow mass, momentum, kinetic energy and so on (Snell et al. 1984; Goldsmith et al. 1984; Shepherd & Churchwell 1996a; Garden et al. 1991; Yu et al. 1999). Different authors used different abundance ratios. Usually this will affect the derived masses by a factor of less than 2 (Ridge & Moore 2001). Occasionally it could be larger, from (Rodríguez et al. 1982) to (Garden et al. 1991). We accept a factor of 4 as the abundance error. Some authors use 1.36 as the mean atomic weight of the mixture of hydrogen and helium (see Garden et al. (1991)), while others only consider pure hydrogen molecular gas (see Snell et al. (1984)). Therefore an uncertainty of 0.36 is introduced. Projection effects affect momentum and energy by factors of 2 and 3 respectively (Goldsmith et al. 1984). Our experience shows that different velocity ranges () of the determined outflow emission add uncertainty to the results. The excitation temperature, , is determined by the relative line intensities of at least two different transitions (Garden et al. 1991). It is usually assumed or defined as the brightness temperature of the CO line peak. ranging from 10 to 15 K for low mass sources (Goldsmith et al. 1984; Snell et al. 1980), and from 30 to 50 K for high mass sources (Shepherd & Churchwell 1996a, b; Beuther et al. 2002c; Wu et al. 2004), causes a maximum uncertainty of about . To investigate how different telescope beam sizes affect the outflow physical parameters, we pick out the sources whose angular diameters are larger than 5 beam sizes of the telescope used. 113 of these sources have available and . the linear fit of and is: , . Comparing the relation here to that of all the 235 sources with available and , which we present in Sect. 4.1, we find that: The slope of beam sizes sample (0.51) is a little smaller than that of all (0.56), mainly because the majority of outflows more massive than disappeared in the beam sizes sample due to their greater distances. The correlation coefficients of the beam sizes sample (0.73) is also a little worse ( for all), because the beam sizes sample is less than half of the whole set. However, the above two deviations are not significant. Thus we are able to conclude that the telescope beam size affects little the outflow physical parameters. We also examine the differences which different CO transition may cause. The mass derived from CO and are expected to be within a factor of 2 to 3 of the actual values (Margulis & Lada 1985), while this difference mainly comes from the optical depth difference which is already accented in our uncertainties. As a result, the outflow mass, , has an uncertainty factor of 6.4; the outflow force, , 6.7; the outflow luminosity, , 7.1. The bolometric luminosity, , listed in column 13, primarily derived from far-infrared observations such as IRAS, should be fairly accurate (Lada 1985). Even if there were more than one YSO within the IRAS beam, the emission of the most massive YSO will be the main contribution to the total FIR flux according to the mass-luminosity relation (Casoli et al. 1986). Cabrit & Bertout (1992) listed of 16 outflow sources. We compared these values to those listed in our Table 1a, and found that the uncertainty is within 23 except for Orion-A ((110) and 2.1)and S140 ((0.59.0) and 5). For most cases, the variation of luminosities provided by different authors in our sample is about 2 to 3, except for a few high mass sources. The errors estimated above are much less than the scatter of the data themselves.
4.1 Relation between the outflow mass and the bolometric luminosity of the center sources
A plot of outflow mass relative to the bolometric luminosity of driving sources shows that the two parameters are physically related. The mass of the outflow is a fundamental parameter. Its relationship to the luminosity of the central source is essential to investigate the nature of the outflows.
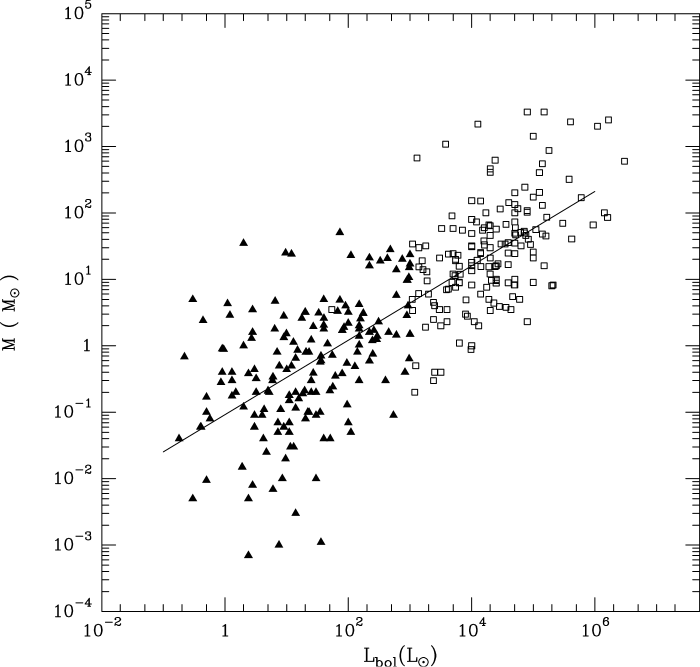
Figure 5 plots the mass of outflows vs. the bolometric luminosities of center sources . It shows that the flow mass increases with the luminosity as a power law. The outflows with higher luminosity values tend to have larger flow masses and vice versa. The least square linear fit in log-log space shown in the figure is with the correlation coefficient . The strong correlation between outflow mass and luminosity is an interesting result which is the first demostration of such a clear correlation. It presents essential clues to the origin and properties of outflows. The correlation suggests that the outflow mass is linearly correlated with the bolometric luminosity of the center source. The outflow however could not be driven directly by radiation pressure if the photons emitted from the center objects are scattered once before they escape (Bally & Lada 1983, see also Sect. 4.2). This is a classic example in which two parameters are correlated because individually each one is correlated to a third underlying parameter. In our case, it could be that the bolometric luminosity is correlated to the accretion rate (Kenyon et al. 1990; Ohashi et al. 1991; Mundy et al. 1992; Greene et al. 1994), which in turn is correlated to the mass loss rate in the outflow, (Tomisaka 1998; Shu et al. 1994; Contopoulos & Sauty 2001; Fernández & Comerón 2001) and the mass loss rate in the outflow sources is what determines the mass swept up in the outflow lobes (Snell et al. 1980; Ho et al. 1982; Bally & Lada 1983; Goldsmith et al. 1984). So although the radiation energy that the source provided is not able to drive such an outflow mass, they are still correlated.
4.2 Relation between the outflow mechanical luminosity, required force and the bolometric luminosity of the center sources
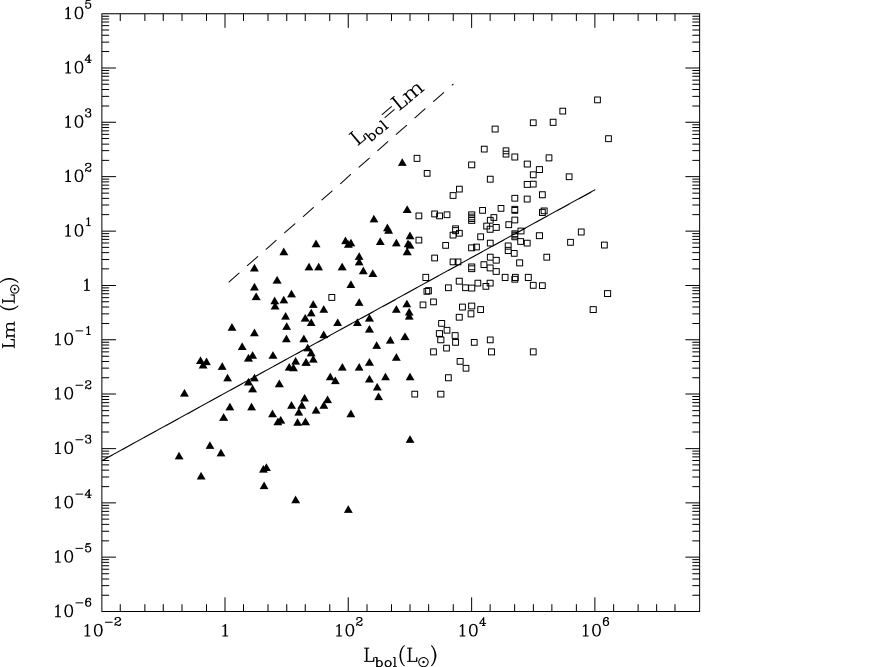
To investigate the relationship between outflows and their central sources, we further plot the mechanical luminosity () of outflows vs. bolometric luminosity () of the center stellar objects, shown in Fig. 6. The dashed line shows the equation . The plot shows that for all sources, is less than . The closest point to the dashed line is outflow No. 21, the source L1448 U-star. Bachiller & Cernicharo (1990) pointed out that it was near the upper edge of the populated zone in the mechanical power versus stellar luminosity diagram by Lada (1985). Now that the size of the sample is much larger, the closest point is still located at the upper edge. The lowest point represents outflow No. 337, the source GN21.38.9. This is the lowest-mass Bok globule according to Duvert et al. (1990).
In Fig. 6, the solid line is a linear least-square fit: . The correlation coefficient is 0.69. One can see that the two lines are not parallel. The average deviation between the two lines is larger for the high mass group than the low mass ones. The average values of the ration are and for the low mass and high mass group sources, respectively.
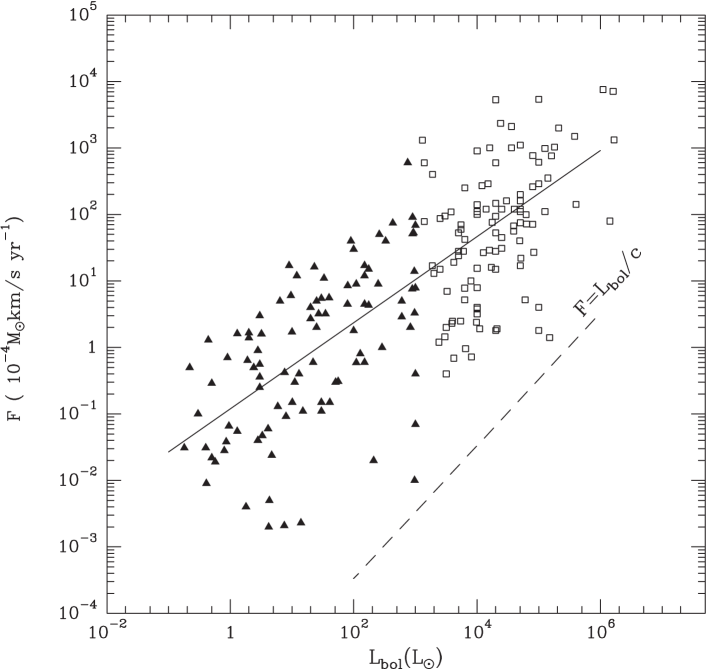
Figure 7 is the plot of the force required to drive the outflow against the bolometric luminosity of the central source. The dashed line shows . All the outflows are above the line, which means that the radiation pressure of the central sources would not be enough to drive the outflows if the radiation photons from the central source were scattered once. The two plotted parameters are still correlated. The solid line presents the least square fit for the force of the flow as a function of the bolometric luminosity: . The correlation coefficient is 0.72.
Bally & Lada (1983) mapped a sample of sources using a single telescope; they discovered a weak correlation between the mechanical luminosity, the required driving force of the outflow and the bolometric luminosity of the central source. The correlation means that the energy and momentum of an outflow is determined by the central luminosity or mass and the physical driving engines are similar for all the sources (Bally & Lada 1983). The above authors also pointed out that the scatter of the plots could be understood as the result of several selection effects. The uncertainties in determining luminosities of central sources can cause significant scattering. A large part of the scatter may be due to the geometrical velocity determination.
To test the correlation between the mechanical luminosity, the force and the luminosity of the central source, the increased sample size is expected to ensure that the scatter in - plane will be more than that in the - plane (Bally & Lada 1983). Here we have a sample 25 times the size of theirs; the correlation coefficient of the line fit for the - (0.72) is just slightly better than that for - (0.69). The standard deviation from the fitted line of - is about the same as that of - or without a significant difference. This may be caused by various uncertainties in our sample, which are mentioned in Sect. 4, while the sample of Bally & Lada (1983) came from a single survey. The parameter ranges of our sample are wider than the sample in Bally & Lada (1983). For example, outflow mass is , while theirs is from .
The mass entrainment rate () is also correlated linearly to (Wu et al. 2004). This is further evidence showing the dependence of outflow on its driving source.
4.3 Dynamic time
4.3.1 The average age
The dynamic time scale, , is available for 275 sources. The time scales range from 400 yr (see NGC2024 FIR6, Richer 1990) to (see L1551NE, Moriarty-Schieven & Wannier 1991). The average value is and for the high mass and low mass group respectively. To investigate why the dynamical timescale of high mass sources appears longer than that of low mass sources, we examined the sources with yr. There are 21 such sources, among which 14 belong to the high mass group and 7 belong to the low mass group. We list all the sources with in Table 2.
Among 14 high mass sources, 10 are UC HII or bright far infrared sources, which are more evolved among massive YSOs. Another reason why the high mass group has a higher average age is the observation resolution: 14 of the above 21 sources have large distances kpc, while medium (1015m) or small telescopes (35m) were employed to observe 13 of them; among these 13 sources, 12 are high mass sources.
4.3.2 The relation between outflow mass and dynamic time
The plot of the outflow mass against the dynamic time is shown in Fig. 8.
For 98.5% (271/275) of the sources the dynamic timescales are between years, including 99% (155/157) of the low mass sources, and 98%(116/118) of the high mass ones. For the low mass group, the flow mass seems to increase with time while there is no such simple trend for the high mass group. Linear fitting shows , and a poor . The correlation is much stronger for the low mass group, , and . Thus the flow processes may be different for the two groups.
5 Associated phenomena
Numerous associated objects were detected and investigated. Ninety (23%) sources have associated HII or centimeter continuum emission regions, 136 (35%) have optical jets or HH objects, 92 (24%) have H2 jet and 190 (49%) have H2O masers. Among 136 sources with HH objects or optical characters, 14 (10%) are in the high mass group. In the 190 sources with water masers, 75 (39%) are in the low mass group. There are 45 (12%) outflows with collapses (the percentage in the high mass group is 20%), nearly all of the collapse candidates detected so far. According to Shu et al. (1987), the collapse should occur earlier than bipolar outflow in star formation stages. However, nearly all of the collapses were detected in outflow sources. This may be because the infall material near the embedded sources is shielded by surrounding gas and dust, thus is difficult to observe until the outflow later expels the surrounding material so that the internal region is observable.
6 Spatial distribution and occurrence rate
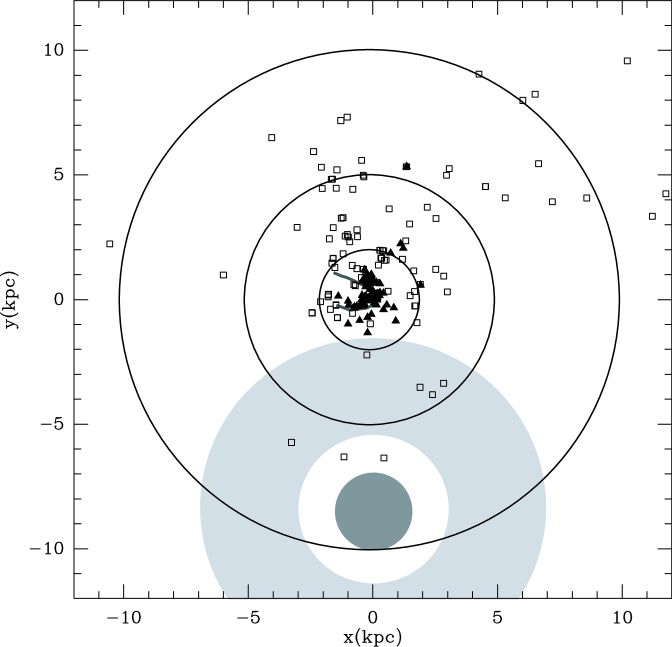
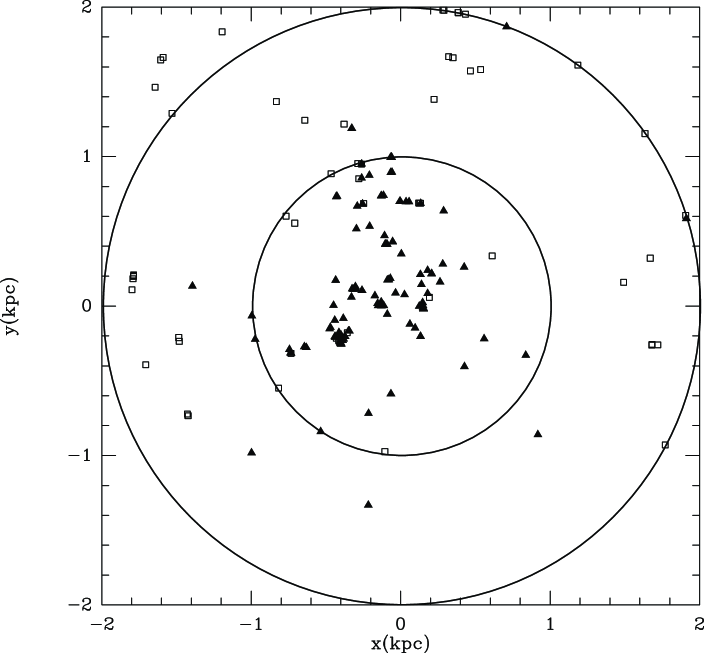
The three dimensional spatial distribution of the sources projected on the coordinate plane is given in Fig. 9. The sun is at the origin, with the X axis pointing to the 90 degree longitude direction of the IAU Galactic coordinate, the Y axis passing through the Galactic Center and the Z axis pointing to the north Galactic pole. High mass sources are represented by clear squares and low mass ones by filled triangles. Figure 9a shows the sources projected on the Galactic plane; Fig. 9b is the same frame as Fig. 9a but shows only the inner 2 kilo-parsecs from the sun. Figure 9c and Fig. 9d are projections onto the X-Z and Y-Z planes, respectively.
A prominent feature seen in the plots is that there are more sources between to than in the rest (; see Table 1a). This is largely attributed to the fact that most observations were performed on sources that can be seen in the northern hemisphere. There do exist spatial structures that are asymmetrically distributed with respect to the sun in the local distance, e.g. the neutral interstellar gas (Frisch & York 1983). Such asymmetry mirrors the distribution of the nearby O and B stars associated with the Gould Belt (Stothers & Frogel 1974). The contour of is shown in Fig. 9a as a thick line (Frisch & York 1983). A molecular disk model with radius 1.5kpc and a molecular ring with radius 3-7 kpc are also given in Fig. 9a (Liszt & Burton 1978; Scoville & Sanders 1987). Multiple components along the line of the sight towards these molecular rings where is less than may be another reason that makes it difficult to detect or to identify molecular outflows in these regions.
There are 230 sources in the catalogue within one kilo parsec of the sun. The occurrence rate can be estimated as , where t is the average lifetime (in years) of the outflows. For years, which is the average value of the 230 sources within one kiloparsec, the birth rate is .
Among the 230 sources within 1 kpc of the sun there are 171 sources with available bolometric luminosity (see Table 3). Taking the upper and lower limit of masses of the evolution tracks on the observed H-R diagram according to bolometric luminosity (Levreault 1985, and references therein), the average mass of these sources was estimated to be as an upper limit, and as a lower limit (see Table 3).
The birth rate measured for the number of stars, , is equal to measured as a stellar mass upper limit; for the lower limit, it is (see Table 3). Both are similar to the local star formation rate , or , depending on whether there is any compression in the spiral shock wave or not (Kaufman 1979). These results suggest that high-velocity outflows are common in star formation.
7 Summary
In this paper, the searches of molecular outflow sources are reviewed. Our Catalogue includes 391 high velocity molecular outflows and their basic parameters. We classified them into two groups according to the available bolometric luminosity or to the outflow mass. We analyzed the progress of molecular outflow searches and divided the history of outflow search into four periods: I.1976-1984, II. 1985-1989, III. 1990-1995 and IV. 1996-2003. The characters of different periods and the developmental trend are discussed. The morphology, collimation and physical parameters of outflows were investigated. We also studied the correlation between outflows and their central sources. Finally the spatial distribution and birth rate of young stars are presented and discussed. For convenience, the main statistical results are listed in Table. 4.
Our main results are as follows:
-
1.
The catalogued outflows have been classified into high mass and low mass groups according to the bolometric luminosity of the center sources and the outflow masses. The pace of outflow identification has accelerated in the past two decades. The number of outflows detected per year tends to increase, that is, 7 in Period I but 23 in Period IV. The number of low mass sources increased fast during period II. In period IV, the number of high mass outflows increased rapidly, suggesting that the outflow phenomenon is also common in high mass star formation regions. Data acquired recently suggest high mass star formation processes may also go through mass accreting and ejecting, similar to those processes in low mass star formation.
-
2.
Polarity was known for all the 391 sources, 84% of which are bipolar. Red mono-polar outflows are found to be equally abundant compared to the blue ones within the statistical uncertainty. This suggests that monopolarity of the outflows is intrinsic and is a result of the driving source being partially submerged in the molecular cloud. The number of multiple sources has increased and isolated ones decreased since the last catalogue (Wu et al. 1996), which shows the improvement of the detection technology.
-
3.
We analyzed the collimation of the outflows. The number of sources with known collimation factors has increased from 26 in period I to 213 in period IV. The current average value of the collimation factors is slightly larger than that in period I. Although the resolution of the equipment used in period IV has generally improved, the number of high mass outflows observed increased in this period. As high mass outflows have in general lower collimation factor values, the average collimation value only changed slightly.
-
4.
The collimation of low mass sources is better than that of high mass ones as a whole. Different outflow driving mechanisms may explain such differences. Moreover, projection effects, physical conditions of the environment and evolutionary states also affect the morphology of outflows.
-
5.
The relationship between physical parameters of the outflow and its central source is examined. Analysis shows that outflow masses are correlated strongly with bolometric luminosities of young stellar sources. This relation, a typical example of an indirect correlation of two quantities, is obtained for the first time.
-
6.
Similar linear correlations exist between flow mechanical luminosity, the force required to drive the outflow and the bolometric luminosity in logarithmic scales. The weak correlation found by Bally & Lada (1983) in an early survey is confirmed.
The mass, momentum and energy of the outflows depend on the luminosity of the central source. These relationships between the parameters of the outflows and the driving sources suggest that the energetic outflows originate from their central source. Although the radiation pressure could not drive the outflow directly if the photons emitted from the central source scatter once, these correlations confirm the relationship between outflows and their central stellar objects.
-
7.
Outflow mass and dynamic time tends to be correlated for low mass sources while for high mass ones there was no such correlation. This together with the differences between the low mass and high mass group sources shown by v.s. (Fig. 6) and vs. (Fig. 7) is consistent with the presence of different driving mechanisms.
-
8.
Objects associated with outflows were investigated. 136 outflows have associated HH objects; 10% of those are among the high mass group; 190 outflows have water masers, 39% belong to the low mass group. 12% of the outflow sources have ongoing collapse of infall detected.
-
9.
The spatial distribution of known outflows is not symmetric with respect to the sun because the southern hemisphere has fewer identified sources, largely due to less observation. The occurrence rate within 1kpc from the sun is , where is a typical lifetime of outflow in years. For an outflow dynamic time of years the birth rate is , close to the local star birth rate.
Higher angular resolution and sensitivity are necessary to further resolve the velocity structure and survey the distant sources. If a large number of outflows with more accurate morphology are found, we may better understand the physical nature of the energetic processe occuring during early stellar evolution.
Acknowledgements.
We would like to thank the anonymous referee for constructive suggestions and helpful comments. We are very grateful to J. Wu, J. Wang, C. Yang, M. Wei, W. Zhou and L. Zhu for their assistance in the data collection and data checking. We thank Hongping Du and the editor for help with our English expressions. This project is supported by the grants from NSFC No. 10133020, 10128306 and 10203003, and by G1999075405 of NKBRSF.References
- Bachiller (1996) Bachiller, R. 1996, ARA&A, 34, 111
- Bachiller & Cernicharo (1990) Bachiller, R. & Cernicharo, J. 1990, A&A, 239, 276
- Bachiller et al. (1991) Bachiller, R., Martin-Pintado, J., & Planesas, P. 1991, A&A, 251, 639
- Bally et al. (2001) Bally, J., Johnstone, D., Joncas, G., Reipurth, B., & Mallén-Ornelas, G. 2001, AJ, 122, 1508
- Bally & Lada (1983) Bally, J. & Lada, C. J. 1983, ApJ, 265, 824
- Beuther et al. (2002a) Beuther, H., Schilke, P., Gueth, F., et al. 2002a, A&A, 387, 931
- Beuther et al. (2002b) Beuther, H., Schilke, P., Menten, K. M., et al. 2002b, ApJ, 566, 945
- Beuther et al. (2002c) Beuther, H., Schilke, P., Sridharan, T. K., et al. 2002c, A&A, 383, 892
- Bonnell & Bate (2002) Bonnell, I. A. & Bate, M. R. 2002, MNRAS, 336, 659
- Bontemps et al. (1996) Bontemps, S., André, P., Terebey, S., & Cabrit, S. 1996, A&A, 331, 858
- Cabrit & Bertout (1986) Cabrit, S. & Bertout, C. 1986, A&A, 307, 313
- Cabrit & Bertout (1990) Cabrit, S. & Bertout, C. 1990, A&A, 348, 530
- Cabrit & Bertout (1992) Cabrit, S. & Bertout, C. 1992, A&A, 261, 274
- Casoli et al. (1986) Casoli, F., Combes, F., Dupraz, C., Gerin, M., & Boulanger, F. 1986, A&A, 169, 281
- Chernin & Masson (1995) Chernin, L. & Masson, C. R. 1995, ApJ, 455, 182
- Choi et al. (1993) Choi, M., Evans, N. J. I., & Jaffe, D. T. 1993, ApJ, 417, 624
- Contopoulos & Sauty (2001) Contopoulos, I. & Sauty, C. 2001, A&A, 365, 165
- de Young (1986) de Young, J. S. 1986, ApJ, 307, 62
- Duvert et al. (1990) Duvert, G., J.Cernicharo, Bachiller, R., & Gómez-González, J. 1990, A&A, 233, 190
- Evans (1999) Evans, N. J. 1999, ARA&A, 37, 311
- Felli et al. (1992) Felli, M., Palagi, F., & Tofani, G. 1992, A&A, 255, 293
- Fernández & Comerón (2001) Fernández, M. & Comerón, F. 2001, A&A, 380, 264
- Frisch & York (1983) Frisch, P. C. & York, D. G. 1983, ApJ, 271, 59
- Fuente et al. (2001) Fuente, A., Neri, R., Martín-Pintado, J., et al. 2001, A&A, 366, 873
- Fukui (1989) Fukui, Y. 1989, ESO Workshop on Low Mass Star Formation and Pre-Main Sequence Objects, ed. B. Reipurth, 95
- Garay et al. (1998) Garay, G., Kohnenkamp, I., Bourke, T. L., guez, L. F. R., & Lehtinen, K. K. 1998, ApJ, 509, 768
- Garden et al. (1991) Garden, R. P., Hayashi, M., Hasegawa, T., Gatley, I., & Kaifu, N. 1991, ApJ, 374, 540
- Goldsmith et al. (1984) Goldsmith, P. F., Snell, R. L., Hemeon-Heyer, M., & Langer, W. D. 1984, ApJ, 286, 599
- Greaves et al. (2001) Greaves, J. S., Holland, W. S., & Ward-Thompson, D. 2001, ApJ, 546, L53
- Greene et al. (1994) Greene, T. P., Wilking, B. A., André, P., Young, E. T., & Lada, C. J. 1994, ApJ, 434, 614
- Gueth & Guilloteau (1999) Gueth, F. & Guilloteau, S. 1999, A&A, 343, 571
- Herbig (1960) Herbig, G. 1960, ApJS, 337, 4
- Ho et al. (1982) Ho, P. T. P., Moran, J. M., & Rodríguez, L. F. 1982, ApJ, 262, 619
- Hofner et al. (2001) Hofner, P., Wiesemeyer, H., & Henning, T. 2001, ApJ, 549, 425
- Houde et al. (2001) Houde, M., Thomas, P. G., Pierre, B., Ruisheng, P., & Hiroshige, Y. 2001, ApJ, 547, 311
- Kaufman (1979) Kaufman, M. 1979, ApJ, 232, 707
- Kenyon et al. (1990) Kenyon, S. J., Hartmann, L. W., Strom, K. M., & Strom, S. E. 1990, AJ, 99, 869
- Koo (1989) Koo, B. C. 1989, ApJ, 337, 318
- Kroupa et al. (1990) Kroupa, P., Tout, C. A., & Gilmore, G. 1990, MNRAS, 244, 76
- Kuhi (1964) Kuhi, L. V. 1964, ApJ, 140, 1409
- Kwan & Scoville (1976) Kwan, J. & Scoville, N. 1976, ApJ, 210, L39
- Lada (1985) Lada, C. J. 1985, ARA&A, 23, 267
- Lane (1989) Lane, A. P. 1989, ESO Workshop on Low Mass Star Formation and Pre-Main Sequence Objects, ed. B. Reipurth, 89
- Lee et al. (2000) Lee, C., Mundy, L. G., Reipurth, B., Ostriker, E. C., & Stone, J. M. 2000, ApJ, 542, 925
- Levreault (1985) Levreault, R. M. 1985, Molecular Outflows and Mass Loss in Pre-Main Sequence Stars, Tech. Rep. 85-1, Astronomy Dept.Univ. of Texas
- Levreault (1988) Levreault, R. M. 1988, ApJS, 67, 283
- Liszt & Burton (1978) Liszt, H. S. & Burton, W. B. 1978, ApJ, 226, 790
- Lizano et al. (1988) Lizano, S., Heiles, C., Rodriguez, L. F., et al. 1988, ApJ, 328, 763
- Margulis & Lada (1985) Margulis, M. & Lada, C. J. 1985, ApJ, 299, 925
- Matzner & Mckee (1999) Matzner, C. D. & Mckee, C. F. 1999, ApJ, 526, 109
- Megeath & Tieftrunk (1999) Megeath, S. T. & Tieftrunk, A. R. 1999, ApJ, 526, L113
- Molinari et al. (2002) Molinari, S., Testi, L., Rodríguez, L. F., & Zhang, Q. 2002, ApJ, 570, 758
- Moriarty-Schieven & Wannier (1991) Moriarty-Schieven, G. H. & Wannier, P. G. 1991, ApJ, 373, L23
- Mundy et al. (1992) Mundy, L. G., Wootten, A., Wilking, B. A., Blake, G. A., & Sargent, A. I. 1992, ApJ, 385, 306
- Myers et al. (1996) Myers, P. C., Mardones, D., Tafalla, M., Williams, J. P., & Wilner, D. J. 1996, ApJ, 465, 133
- Narayanan & Walker (1996) Narayanan, G. & Walker, C. K. 1996, ApJ, 466, 884
- Natta et al. (1988) Natta, A., Giovanardi, C., Palla, F., & Evans, N. J. 1988, ApJ, 327, 817
- Ohashi et al. (1991) Ohashi, N., Kawabe, R., Hayashi, M., & Ishiguro, M. 1991, AJ, 102, 2054
- Raga & Cabrit (1993) Raga, A. C. & Cabrit, S. 1993, A&A, 278, 267
- Reipurth et al. (2002) Reipurth, B., Heathcote, S., Morse, J., Hartigan, P., & Bally, J. 2002, AJ, 123, 362
- Richer (1990) Richer, J. S. 1990, MNRAS, 245, 24P
- Ridge & Moore (2001) Ridge, N. A. & Moore, T. J. T. 2001, A&A, 378, 495
- Rodríguez et al. (1982) Rodríguez, L. F., Carral, P., Moran, J. M., & Ho, P. T. P. 1982, ApJ, 260, 635
- Russell et al. (1992) Russell, A. P. G., Bally, J., Padman, R., & Hills, R. E. 1992, ApJ, 387, 219
- Salpeter (1955) Salpeter, E. E. 1955, ApJ, 121, 161
- Scoville & Sanders (1987) Scoville, N. Z. & Sanders, D. B. 1987, H2 in the Galaxy, in Interstellar Processes, ed. D. J. Hollenbach & H. A. Thronson (Jr, D. Reidel Publishing Com.), 21
- Shepherd & Churchwell (1996a) Shepherd, D. S. & Churchwell, E. 1996a, ApJ, 472, 225
- Shepherd & Churchwell (1996b) Shepherd, D. S. & Churchwell, E. 1996b, ApJ, 457, 267
- Shepherd et al. (1998) Shepherd, D. S., Watson, A. M., Sargent, A. I., & Churchwell, E. 1998, ApJ, 507, 861
- Shu et al. (1994) Shu, F., Najita, J., Ostriker, E., et al. 1994, ApJ, 429, 781
- Shu et al. (1987) Shu, F. H., Adams, F. C., & Lizano, S. 1987, ARA&A, 25, 23
- Snell et al. (1980) Snell, R. L., Loren, R. B., & Plambeck, R. L. 1980, ApJ, 239, L17
- Snell et al. (1984) Snell, R. L., Scoville, N. Z., Sanders, D. B., & Erickson, N. R. 1984, ApJ, 284, 176
- Stothers & Frogel (1974) Stothers, R. & Frogel, J. A. 1974, AJ, 79, 456
- Tomisaka (1998) Tomisaka, K. 1998, ApJ, 502, L163
- Wolf-Chase et al. (1998) Wolf-Chase, G. A., Barsony, M., Wootten, H. A., et al. 1998, ApJ, 501, L193
- Wu & Huang (1998) Wu, Y. & Huang, M. 1998, Chin. Phys. Lett, 15, 388
- Wu et al. (1996) Wu, Y., Huang, M., & He, J. 1996, A&AS, 115, 283
- Wu et al. (2001) Wu, Y., Wu, J., & Wang, J. 2001, A&A, 380, 665
- Wu et al. (1999) Wu, Y., Yang, C., Li, Y., et al. 1999, Science in China(Ser. A), 42, 732
- Wu et al. (2004) Wu, Y., Zhang, Q., Chen, H., et al. 2004, submitted by AJ
- Yu et al. (1999) Yu, K., Billawala, Y., & Bally, J. 1999, AJ, 118, 2940
- Zhang et al. (2001) Zhang, Q., Hunter, T. R., Brand, J., et al. 2001, ApJ, 552, L167
- Zhou (1992) Zhou, S. 1992, ApJ, 394, 204
- Zuckerman et al. (1976) Zuckerman, B., Kuiper, T. B. H., & Kuiper, E. N. R. 1976, ApJ, 209, 137
- Zuckerman & Palmer (1975) Zuckerman, B. & Palmer, P. 1975, ApJ, 199, 35
| Outflow No. | Outflow Name | kpc | Group | Telescope used | Ref. | |
|---|---|---|---|---|---|---|
| 009 | 00494+5617 | 2.2 | 24 | H | 14m | 3 |
| 014 | 02310+6133 | 3.8 | 51.5 | H | 13.7m | 381 |
| 015 | 02461+6147 | 4.2 | 35 | H | 3m() | 380 |
| 040 | B5-IRS4 | 0.35 | 24 | L | 7m | 21 |
| 052 | L1551NE | 0.16 | 60 | L | 12m | 128 |
| 126 | 05490+2658 | 2.1 | 37 | H | 14m | 3 |
| 130 | 05553+1631 | 2.5 | 46 | H | 14m | 3 |
| G192.16 | 2.0 | 27 | H | 12m | 194 | |
| 131 | CB39 | 0.6 | 30 | L | 14m | 178 |
| 139 | S255 | 2.5 | 50 | H | 14m | 117 |
| 162 | 07028-1100 | 1.4 | 24 | L | 13.7m | 421 |
| 166 | WB89 1135 | 6.42 | 37.9 | H | 15m | 196 |
| 173 | WB89 1275 | 6.38 | 27.8 | H | 15m | 196 |
| 237 | 18150-2016 | 1.8 | 24 | H | 4m | 260 |
| 281 | 19471+2641 | 2.62 | 21 | H | 10m() | 203 |
| 325 | 21015+6757 | 0.44 | 24 | L | 3m() | 397 |
| 336 | V645 Cyg | 5.6 | 50 | H | 5m() | 8 |
| 337 | GN21.38.9 | 0.75 | 30 | L | 10m | 150 |
| 350 | 21432+4719 | 1.0 | 22 | L | 45m | 258 |
| 360 | 22142+5206 | 4.5 | 23 | H | 45m | 187 |
| 374 | 22475+5939 | 4.7 | 29 | H | 12m | 199 |
| 382 | MBM55 | 0.18 | 22 | H | 12m | 100 |
| Source Number | 0 | 20 | 50 | 49 | 36 | 8 | 8 |
|---|---|---|---|---|---|---|---|
| Upper limit | 1.0 | 1 | 1.5 | 3 | 5 | 9 | 15 |
| lower limit | 0.2 | 0.5 | 1.0 | 1.5 | 3 | 5 | 9 |
| Item | Result | Section | Paragraph |
|---|---|---|---|
| Outflows cataloged | 391+6 | 2.1 | 2 |
| High group ( or ) | 139 | 2.3 | 2 |
| low group ( or ) | 223 | 2.3 | 2 |
| Sources detected in Period I, II, III, IV | 55, 95, 88, 159 | 2.4 | 2 |
| High group in Period I, IV | 31%, 38% | 2.4 | 3 |
| Sources with to | 23% | 2.4 | 4 |
| Sources with UC HII regions | 23% | 2.4 | 4 |
| Bipolar sources | 327(84%) | 3 | 1 |
| Monopolar sources | 50(13%) [28 red, 22 blue] | 3 | 1 |
| Multipolar sources | 12(3%) | 3 | 1 |
| Isotropic sources | 2 | 3 | 1 |
| Sources with available Rcoll | 213 | 3 | 3 |
| Average coll | 2.45 1.74 | 3 | 3 |
| Average coll of high group | 2.05 0.96 | 3 | 3 |
| Average coll of low group | 2.81 2.16 | 3 | 3 |
| Bolometric luminosity range | 0.1- | 2.3 | 1 |
| Uncertain factor of | 6.4 | 4 | 2 |
| Uncertain factor of | 6.7 | 4 | 2 |
| Uncertain factor of m | 7.1 | 4 | 2 |
| range | 0.01 to 3.98 pc | 4 | 1 |
| Mass range | to | 4 | 1 |
| Momentum | to | 4 | 1 |
| Energy | to ergs | 4 | 1 |
| Mechanical luminosity | to | 4 | 1 |
| Force | 4 | 1 | |
| Mass loss rate | 4 | 1 | |
| Dynamical time available sources | 275 | 4.3.1 | 1 |
| Range of dynamical time | to yr | 4.3.1 | 1 |
| Dynamical time of the 99% sources | yr | 4.3.2 | 2 |
| Average dynamical time of high group | 4.3.1 | 1 | |
| Average dynamical time of low group | 4.3.1 | 1 | |
| Sources with yr | 21 [14 in high group] | 4.3.1 | 1 |
| Sources associated with HH objects | 136 (35%) [90% in low group] | 5 | |
| Sources associated with H2 jet | 92 (24%) | 5 | |
| Sources associated with H2O masers | 190 (49%) [115 (61%) in high group] | 5 | |
| Collapse candidates | 45 (12%) | 5 | |
| Sources within 1 kpc | 230 | 6 | 3 |
| Sources within 1 kpc ( available) | 171 [16(9%) in high group] | 6 | 4 |
a
 b
b


a
 b
b

c
 d
d