Peculiar Velocities in the Zone of Avoidance:
Determining the Distance to the Norma cluster
Abstract
Deep , and photometry of the low Galactic latitude Norma cluster has been obtained with the 1.4-m InfraRed Survey Facility (IRSF) and with SOFI on the NTT. Together with spectroscopy taken at the Anglo-Australian Observatory using 2dF, the near-infrared Fundamental Plane of the Norma cluster will be used to determine the distance to this cluster and to assess its location within the Great Attractor overdensity. Potential systematic uncertainties related to the determination of peculiar velocities in the Zone of Avoidance are discussed in some detail. In particular the effects (uncertainties, systematics and scatter) of extinction and star-crowding on the derived magnitudes at low latitudes are investigated in great detail. We present a first look at the emerging -band Fundamental Plane of the Norma cluster. We expect an uncertainty of 3% ( km s-1 at the distance of the Norma cluster) in our final Fundemental Plane distance estimate based on 76 galaxies.
1Dept. of Astronomy, University of Cape Town, Rondebosch 7700, South Africa
2Depto. de Astronomía, Universidad de Guanajuato, Apdo. Postal 144, Guanajuato, GTO 36000, México
3Dept. of Physics, University of Durham, South Road, Durham DH1 3LE, United Kingdom
4Dept. of Physics & Astronomy, University of Leicester, University Road, Leicester, LE1 7RH, UK
5Dept. of Physics & Astronomy, Box 1504, Arizona State University, Tempe, AZ, 85287-1504, USA
6Dept. of Physics & Astronomy, York University, 4700 Keele Street, Toronto, ON, M3J 1P3, Canada
1. The Norma cluster and the Great Attractor
The Norma cluster (ACO 3627, Abell et al. 1989) is a rich and nearby galaxy cluster at low Galactic latitude () = ( km s-1). Kraan-Korteweg et al. (1996) and Woudt (1998) showed it to be the nearest massive rich cluster in the local Universe and comparable in its properties to the well-studied Coma cluster. Were it not for the obscuration by the Milky Way (AB 10) the prominence of Norma would have been apparent a century ago and it might have taken the first place as the best-studied cluster in the local Universe. Following the recognition as a nearby rich cluster, however, the Norma cluster has been subjected to dedicated multi-wavelength observations: detailed studies of its X-ray properties have now been made by Böhringer et al. (1996) and Tamura et al. (1998), the effects of the intercluster medium on the gas contents of spiral galaxies in the Norma cluster by Vollmer et al. (2001), substructure and dynamics by Woudt (1998), and a derivation of its optical and near infrared (NIR) luminosity function is in preparation (Woudt et al., in prep.).
A further major point of interest lies in its location at (or close to) the bottom of the potential well of the Great Attractor. Many years after the initial discovery of the GA (Dressler et al. 1987; Lynden-Bell et al. 1988) there still remains some ambiguity regarding the extent and nature of the GA – as was evident by various lively discussions at this meeting upon the simple question ‘What is the Great Attractor?’.
One of our aims in studying the Norma cluster is a highly acccurate distance determination through a NIR Fundamental Plane (FP) analysis with which we want to pin down the position of the the Norma cluster within the GA overdensity, determine its – and possibly the whole GA’s – movement with respect to the Cosmic Microwave Background (CMB), and see whether the Shapley Concentration (Scaramella et al. 1989; Allen et al. 1990) at () ( km s-1) exerts a non-negligible attraction on the GA (see, e.g., Kocevski et al. and Lucey, Radburn-Smith & Hudson, these proceedings).
2. Peculiar velocities in the Zone of Avoidance
Dedicated galaxy surveys in the ZoA over the last one and a half decades across the electromagnetic spectrum – ranging from X-ray (ROSAT, XMM-Newton), optical, near-infrared (2MASS, DENIS), far-infrared (IRAS) to radio wavelengths (HIPASS)111The reader is referred to the three dedicated conference volumes on galaxy surveys in the Zone of Avoidance for a comprehensive overview of the various surveys (ASP Conf. Ser., Vol. 67 (1994), Vol. 218 (2000) and this volume). – have led to an almost complete reduction of the ZoA in the distribution of galaxies, even in redshift-space (e.g., Henning, Kraan-Korteweg & Staveley-Smith, and Koribalski, these proceedings).
Despite these advances, a broad Zone of Avoidance in peculiar velocity data has remained at low Galactic latitudes. This is mostly due to the difficulty in determining the Galactic foreground extinction to the desired level of accuracy. In addition, it is not well understood (quantitatively) what the effects are of star-crowding on photometry, i.e., how accurately one can subtract the foreground stars from the underlying galaxy? Both effects (extinction and star-crowding) could lead to large systematic uncertainties in peculiar velocities derived from, e.g., surface brightness fluctuation, Tully-Fisher, and FP analyses. An early example of an extremely high peculiar velocity measurement for the Norma cluster ( km s-1) using the -band Tully-Fisher relation had its origin in low-number statistics as well as large systematic photometric errors (Mould et al. 1991; see discussion in Woudt 1998).
Several important structures in the local Universe lie at low Galactic latitude, e.g. the GA, the Perseus-Pisces Supercluster and the IC342/Maffei group (Buta & McCall 1999). In order to assess their significance in terms of the velocity field generated by them, it is necessary to obtain reliable distance estimates to the cores of these overdensities. The application of the FP requires reliable measurements of photometric parameters, i.e. and . At low Galactic latitude the two key issues are the sizable and uncertain Galactic extinction and the large level of foreground stellar contamination. It is therefore important to study extinction and star-crowding (Buta & McCall 1999) quantitatively, at least for groups and clusters subjected to a modest amount of extinction in high galaxy-density regions (e.g., the GA region). Prime examples of such clusters are the Norma cluster (Kraan-Korteweg et al. 1996; this paper) and CIZA J1324.6-5736 (Ebeling, Mullis & Tully 2002; Mullis et al., these proceedings).
3. The near-infrared Fundamental Plane of the Norma cluster
We have selected a sample of 76 early-type galaxies in the Norma cluster from which the , , and FP will be constructed. Spectroscopy for these galaxies has been obtained using the 2dF spectrograph at the Anglo Australian Observatory. One of the main advantages of using the near-infrared FP for low-latitude clusters is that the colour information of the observed elliptical galaxies allows a direct measure of the foreground extinction (see Sect. 3.3) which, within errors, is not sensitive to the adopted Galactic extinction law (e.g., Cardelli, Clayton & Mathis 1989).
With our large sample of 76 galaxies we expect to be able to determine the distance of the Norma cluster to a few per cent – in the absence of systematic uncertainties – given that the distance to an individual galaxy using the near-infrared FP is accurate to 18% (Mobasher et al. 1999).
3.1. Near-infrared photometry with SIRIUS and SOFI
We have obtained near-infrared photometric observations of the Norma cluster at two different observing sites using two complementary approaches, namely pointed observations (in the -band) of selected early-type galaxies using SOFI on the NTT within the Abell radius (1.75∘) of the Norma cluster (4 nights in June 2000), and a simultaneous , and -band survey of the central 1/3 Abell radius () of the Norma cluster using SIRIUS on the InfraRed Survey Facility (IRSF; Nagayama et al. 2003) at the Sutherland site of the SAAO (three weeks in June/July 2001 and July 2002). A detailed description of the SOFI and IRSF observations will be presented elsewhere. Here we present a preliminary analysis of these data, demonstrating the feasibility of obtaining accurate photometry at low Galactic latitude.
Despite the availability of 2MASS photometry (Jarrett et al. 2000) for most of the galaxies in our sample, the level of accuracy needed in determining peculiar velocities – particularly in the presence of high stellar densities (see Sect. 3.2) – requires deeper observations at high resolution (i.e., small pixel scales). Both SOFI and SIRIUS meet those requirements, with pixel scales of 0.29 and 0.45 arcsec/pixel, respectively, compared to the 2.0 arcsec/pixel of 2MASS. Table 1 gives an overview of the main characteristics of our SIRIUS and SOFI observations, in comparison to 2MASS.
| SOFI | IRSF | 2MASS | |
| Telescope size | 3.6 m | 1.4 m | 1.3 m |
| Filters | , , | , , | |
| Field of view | |||
| Pixel scale | /pix | /pix | /pix |
| Exp.time (total) | 300 s | 600 s | 7.8 s |
| Mean FWHM |
Note: Both the IRSF and 2MASS have simultaneous , and imaging capabilities.
Standard calibration was performed using the near-infrared standard stars of Persson et al. (1998). In addition, a large number of ‘calibration galaxies’ were observed (with magnitudes in the range of mag), primarily for the purpose of obtaining uniformity with other peculiar velocity surveys (e.g., Pahre 1999; Jones et al., these proceedings; Hudson, these proceedings). Apart from the obvious calibration issues, these galaxies were also used to test the effect of star-crowding on surface photometry by artificially adding star fields (observed around the Norma cluster) to high Galactic latitude galaxies (see Sect. 3.2).
Standard data reduction and analysis were all performed in IRAF222IRAF is distributed by the National Optical Astronomy Observatories, which are operated by the Association of Universities for Research in Astronomy, Inc., under cooperative agreement with the National Science Foundation.. In particular, we used the ELLIPSE task in IRAF to determine the surface brightness profiles for each galaxy. Both our IRSF and SOFI photometry of the standard galaxies compare very well with 2MASS (see the top half of Table 2); the IRSF, SOFI and 2MASS data are all on the same photometric system. For this initial comparison, we have used isophotal magnitudes at the radius of the mag/arcsec2 isophote as given by 2MASS.
| Calibration galaxies | |||
| (mag) | No. galaxies | ||
| 10 | (2MASS – IRSF) | ||
| 10 | (2MASS – IRSF) | ||
| 21 | (2MASS – SOFI) | ||
| Galaxies in the Norma cluster | |||
| (mag) | No. galaxies | ||
| 17 | (2MASS – IRSF) | ||
| 18 | (2MASS – IRSF) | ||
| 12 | (2MASS – SOFI) | ||
| 8 | (IRSF – SOFI) | ||
3.2. Star-crowding
In analysing the low Galactic latitude IC 342/Maffei group of galaxies, Buta & McCall (1999) have developed a routine (dubbed KILLALL) within the IRAF image reduction package for efficient star removal.
We have applied KILLALL to all our galaxies, albeit slightly modified; instead of letting KILLALL take out the galaxies by subtracting a median-filtered image, in our first iteration we model and subtract the galaxy (with ELLIPSE and BMODEL, using sigma-clipping to mask out most of the star light). During the second iteration – with the stars now well-determined and subtracted – an improved model of the galaxy is made (again with ELLIPSE and BMODEL, but this time no sigma-clipping is applied) and subtracted before running KILLALL a second time. A further iteration is possible if deemed necessary, but often two iterations are enough.
In order to test if KILLALL has removed all the superimposed foreground star light, we have added a stellar density similar to that found in the Norma cluster region to our calibration galaxies with well-determined magnitudes in order to test our procedures. At this point, the ‘calibration galaxies’ appear indistinguishable from the real Norma cluster galaxies of our selected sample of 76 early-type galaxies. The modified KILLALL routine is then applied to the star-added images and the resulting magnitude compared to the original value. An example (for NGC 4387) is shown in Figure 1.
| (mag) | FWHM | No. gal. | |||
|---|---|---|---|---|---|
| Star field #03 | 9 | ||||
| Star field #49 | 9 | ||||
| Star field #54 | 9 | ||||
| Star field #68 | 9 | ||||
| Star field #89 | 9 |
For each of the nine calibration galaxies, five different star fields across the Norma cluster were used and the mean offsets (original resulting magnitude following the KILLALL procedure) were calculated. The results of this procedure are given in Table 3. It is clear that for our high quality near-infrared data of the Norma cluster, contamination by foreground stars has a negligible effect on the surface photometry ( mag on average).
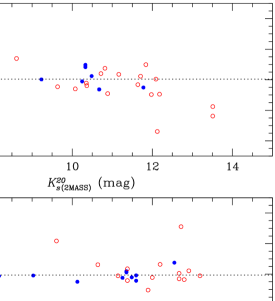
As mentioned in Section 2, 2MASS photometry is available for a large number of galaxies in the Norma cluster, although at a Galactic latitude of , the 2MASS extended source catalogue (2MASS XSC) is not complete. The prime reason for this is stellar confusion (see also Kraan-Korteweg & Jarrett, these proceedings). The stellar crowding also results in a much larger scatter in the 2MASS photometry at low Galactic latitude, primarily due to the limited angular resolution of 2MASS. In Figure 2, we show the comparison between 2MASS and IRSF photometry in the -band (upper panel) and -band (lower panel) for both the calibration galaxies (filled circles) and the Norma cluster galaxies (open circles). Even fairly bright galaxies in the Norma cluster can differ by mag, and for galaxies fainter than mag and mag the scatter increases rapidly.
The lower half of Table 2 shows the mean offsets between 2MASS and the IRSF/SOFI photometry for the galaxies in the Norma cluster. At first sight, 2MASS appears to be too faint by mag on average for the low-latitude galaxies. If this trend is confirmed by the full sample of 76 galaxies, it would imply a potential source of systematic uncertainty in the FP distance if low-latitude 2MASS photometry is to be compared with 2MASS high-latitude photometry. The internal comparison (IRSF-SOFI) shows a much smaller offset (based on only 8 galaxies!); the smaller offset is consistent with the results of the star-adding simulation.
3.3. Determining the Galactic foreground extinction
Burstein (2003) has given an extensive overview of the advantages and disadvantages of the use of the Burstein-Heiles (BH; Burstein & Heiles 1978) method and the DIRBE/IRAS (IR) reddening maps (Schlegel, Finkbeiner & Davis 1998) for predicting Galactic foreground reddening along the line-of-sight.
The Norma cluster lies uncomfortably close to the region and where the BH method predicts reddenings a factor 2 too high due to local variations in the gas-to-dust ratio (Lynden-Bell et al. 1988). In this paper we therefore only use the IR reddening predictions. As pointed out by Burstein (these proceedings), the limiting factor with any of these methods (BH and IR) is the angular resolution of the survey in question, given the patchiness of the Galactic dust distribution. The resolution of the Schlegel et al. IR reddening maps is set by the -pixels of the IRAS survey. This will lead to an observable bias if one is using individual elliptical galaxies (typically with diameters of , ignoring variations of the foreground reddening across the galaxy) to determine the line-of-sight reddening; both BH and IR methods tend to overpredict the reddening in high extinction areas, as the galaxies found in galaxy surveys are preferentially found in regions of smaller extinction. This effect is clearly illustrated by Nagayama et al. (2004) for line-of-sight reddenings towards elliptical galaxies in the PKS 1343601 cluster at km s-1).
Despite the relatively low (averaged) value of mag for the Norma cluster, we cannot rely solely on the IR reddening maps; line-of-sight reddenings will need to be determined based on the observed (i.e., reddened) near-infrared colours for each of the 76 early-type galaxies in our sample in order to locally calibrate the IR reddening maps.
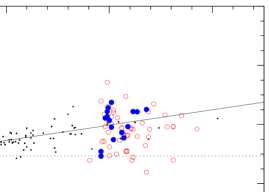
In Figure 3 we show the observed (k-corrected) colour of Burstein’s (2003) sample of giant ellipticals (gE) as a function of obtained from the IR reddening maps. 380 of the 402 gE galaxies have 2MASS photometry. Also shown are the 17 galaxies in the Norma cluster for which we have obtained IRSF photometry so far (filled circles), and those galaxies in our sample for which 2MASS photometry is available (, open circles). The mean extinction-corrected ()0 colour of the 380 gE galaxies is mag (illustrated by the horizontal dotted line). The solid line corresponds to , assuming a standard extinction law with (Cardelli et al. 1989).
The mean colour of the 16 galaxies with accurate IRSF photometry is mag (rejecting the outlying galaxy (WKK 6299) due to contamination of a very bright nearby star). This means that from our photometry we deduce a mean value of mag333Note that we have applied a correction for the change in the spectral energy distribution of a redshifted (and reddened) elliptical galaxy (McCall & Armour 2000; Fingerhut et al. 2003)., compared to mag derived from the IR reddening maps. The implied difference in between the IR reddening maps and the reddening derived from our photometry, is less than 0.01 mag. This confirms that for mag, the IR reddening maps are reasonably accurate (see also Burstein 2003; Burstein, these proceedings), although this clearly needs to be confirmed on a much wider scale.
3.4. Substructure
There are some indications that substructure/subclustering exists within the rich massive Norma cluster. X-ray observations (Böhringer et al. 1996) reported evidence for an X-ray subgroup close to the core of the cluster, while a dynamical analysis (e.g., using the Dressler-Shectman -test; Dressler & Shectman 1988) of the cluster based on 296 redshift-confirmed cluster members within the Abell radius () shows the presence of a spiral-rich subgroup away from the cluster core (Woudt 1998; Woudt et al., in prep). The latter might have had some influence on the large peculiar velocity derived by Mould et al. (1991).
Contamination in the FP analysis by subgroup members could result in a systematic offset. However, with a sample of 76 galaxies, and a thorough understanding of the dynamics of the Norma cluster, this effect will be limited, if not completely eliminated.
3.5. A first look at the Fundamental Plane of the Norma cluster
After the inventory of possible sources of systematic uncertainty and the quantitative analysis thereof, we can now turn our attention back to the original objective of this study: the near-infrared FP of the Norma cluster.
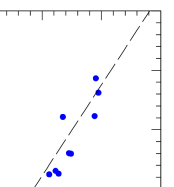
We have determined so far the photometric properties (, ) of 11 of the 76 galaxies. Combined with the 2dF spectroscopic measurement of (the velocity dispersion), the FP of the Norma cluster is emerging (see Fig. 4). Note that the photometric parameters have not yet been corrected for effects of seeing (the mean seeing of our IRSF observations is ) and so this diagram should not be regarded as final. However, this preliminary analysis indicates that the Norma cluster has a well-defined FP and that this cluster’s peculiar velocity (in the Cosmic Microwave Background restframe) is small. Note that the dashed line in Fig. 4 is not a fit to the data but shows a comparison with the Perseus cluster (Pahre, Djorgovski & de Carvalho 1998) which has a similar redshift to the Norma cluster.
4. Discussion
Following careful considerations of issues regarding the Galactic foreground extinction, star-crowding, and substructure within the Norma cluster, an accurate distance determination (accurate to km s-1) to the Norma cluster will follow from our near-infrared FP analysis of 76 early-type galaxies.
It appears that for low-latitude clusters subjected to a modest amount of extinction and star-crowding, the near-infrared FP can be successfully used to arrive at unbiased distance estimates. It will therefore be of great interest and importance to select suitable clusters for near-infrared FP studies to supplement, for example, the 6dF -survey (Jones et al., these proceedings) at low Galactic latitudes (). Of particular interest are clusters in and beyond the Great Attractor region, in order to weigh the relative contribution of the GA and the Shapley Concentration (see also Lucey et al. and Ebeling et al., these proceedings).
Acknowledgments.
PAW and APF kindly acknowledge financial support from the National Research Foundation. RCKK thanks CONACyT for their support (research grant 40094F) and the Australian Telescope National Facility (CSIRO) for their hospitality during her sabbatical. MLM thanks the Natural Sciences and Engineering Counsel of Canada for its continuing support. This research has made use of the NASA/IPAC Infrared Science Archive (2MASS) and the NASA/IPAC Extragalactic Database (NED), which are operated by the Jet Propulsion Laboratory, California Institute of Technology, under contract with the National Aeronautics and Space Administration.
References
Abell, G. O., Corwin, H. G. Jr., & Olowin, R. P. 1989, ApJS, 70, 1
Allen, D. A., Staveley-Smith, L., Meadows, V. S., et al. 1990, Nature, 343, 45
Böhringer, H., Neumann, D. M., Schindler, S., & Kraan-Korteweg, R. C., 1996, ApJ, 467, 168
Burstein, D. 2003, AJ, 126, 1849
Burstein, D., & Heiles, C. 1978, ApJ, 225, 40
Buta, R. J., & McCall, M. L. 1999, ApJS, 124, 33
Cardelli, J. A., Clayton, G. C., & Mathis, J. S. 1989, ApJ, 345, 245
Dressler, A., & Shectman, S. A. 1988, AJ, 95, 985
Dressler, A., Faber, S. M., Burstein, D., et al. 1987, ApJ, 313, 37
Ebeling, H., Mullis, C. R., & Tully, R. B. 2002, ApJ, 580, 774
Fingerhut, R. L., McCall, M. L., De Robertis, M., et al. 2003, ApJ, 587, 672
Jarrett, T.-H., Chester, T., Cutri, R., et al. 2000, AJ, 119, 2498
Kraan-Korteweg, R. C., Woudt, P. A., Cayatte, V., et al. 1996, Nature, 379, 519
Lynden-Bell, D., Faber, S. M., Burstein, D., et al. 1988, ApJ, 326, 19
McCall, M. L., & Armour, M. H. 2000, in Mapping the Hidden Universe: The Universe behind the Milky Way, eds. R. C. Kraan-Korteweg, P. A. Henning and H. Andernach, ASP Conf. Ser., Vol. 218, 1
Mobasher, B., Guzman, R., Aragon-Salamanca, A., & Zepf, S. 1999, MNRAS, 304, 225
Mould, J. R., Han, M. S., Roth, J., et al. 1991, ApJ, 383, 467
Nagayama, T., Nagashima, C., Nakajima, Y., et al. 2003, SPIE, 4841, 459
Nagayama, T., Woudt, P. A., Nagashima, C., et al. 2004, MNRAS, in press
Pahre, M. A. 1999, ApJS, 124, 127
Pahre, M. A., Djorgovski, S. G., & de Carvalho, R. R. 1998, AJ, 116, 1591
Persson, S. E., Murphy, D.C., Krzeminski, W., Roth, & M., Rieke, M.J., 1998, AJ, 116, 2475
Scaramella, R., Baiesi-Pillastrini, G., Chincarini, G., et al. 1989, Nature, 338, 562
Schlegel, D. J., Finkbeiner, D. P., & Davis, M. 1998, ApJ, 500, 525
Tamura, T., Fukazawa, Y., Kaneda, H., et al., 1998, PASJ, 50, 195
Vollmer, B., Cayatte, V., van Driel, W., et al., 2001, A&A, 369, 432
Woudt, P. A. 1998, PhD thesis, University of Cape Town