Turning cool star X-ray spectra upside down
Abstract
H1504+65 is a young white dwarf with an effective temperature of 200 000 K and is the hottest post-AGB star ever analysed with detailed model atmospheres. Chandra LETG+HRC-S spectra have revealed the richest X-ray absorption line spectrum recorded from a stellar photosphere to date. The line forming regions in this extremely hot photosphere produce many transitions in absorption that are also observed in emission in cool star coronae. We have performed a detailed comparison of Chandra spectra of H1504+65 with those of Procyon and Cen A and B. State of the art non-LTE model spectra for the hot white dwarf have enabled us to identify a wealth of absorption lines from highly ionised O, Ne and Mg. In turn, these features have allowed us to identify coronal lines whose origins were hitherto unknown.
keywords:
stars: atmospheres – stars: coronae X-rays: stars – stars: individual Procyon – stars: individual Cen – stars: individual \objectH150465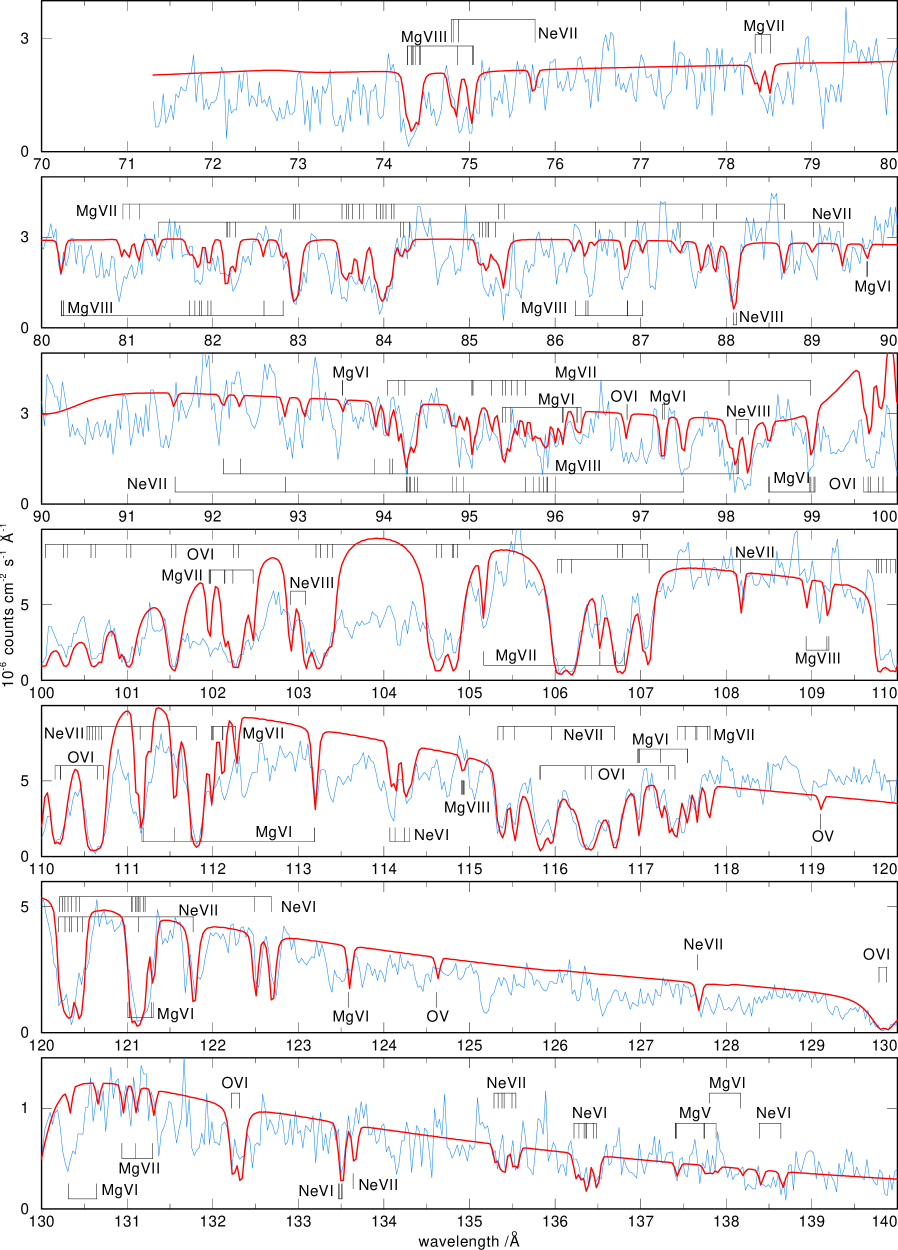

1 Introduction
High-resolution X-ray spectroscopy performed with Chandra and XMM-Newton allows very detailed studies of coronae about cool stars. While many individual emission lines were detected for the first time in stellar spectra by the Extreme Ultraviolet Explorer Satellite (EUVE; see, e.g., Drake et al.1996), the resolving power of of the EUVE spectrographs was a quite modest compared with that of present day X-ray observatories. In particular, the unprecedented resolution capabilities of the Chandra X-ray Observatory Low Energy Transmission Grating Spectrograph (LETG) in the 30-170 Å range () that overlaps with the EUVE Short Wavelength spectrometer (70-170 Å), have revealed many more weak spectral lines. Owing largely to a historical lack of attention to the 30-170 Å range, a large fraction of these remain unidentified. Identification of these features is desirable because they could be used as a spectroscopic diagnostics, because they potentially contribute to the flux of diagnostic lines currently employed, and because they contribute to the overall plasma radiative loss.
Two nearby stars that have illuminated the forest of lines in the 30-170 Å range are \object Cen (G2V+K1V) and \objectProcyon (F5IV). All three stars exhibit classical solar-like X-ray emitting coronae. Indeed, analogues of the relatively X-ray faint Sun are difficult to observe because they become unreachable with current instrumentation beyond a few parsecs, and \object Cen and \objectProcyon represent the nearest and brightest coronal sources with solar-like activity. Only a small fraction of the multitude of lines between 30-170 Å seen their Chandra LETG spectra could be identified based on current radiative loss models (Raassen et al. 2002, 2003). Drake et al.(in prep.) have estimated that these models underestimate the true line flux in the range 30-70 Å in these stars by factors of up to 5 or so.
The “missing lines” are predominantly transitions involving ground states in abundant elements such as Ne, Mg, Si, S and Ar—the analogous transitions to the Fe “L-shell” lines between -18 Å, together with Fe (the “M-shell”) transitions (Drake 1996, Jordan 1996). Some of these lines have been identified based on Electron Beam Ion Trap experiments (Beiersdorfer et al.1999, Lepson et al.2002, 2003). In the present paper we approach this problem from a new perspective, namely through a Chandra observation of the photosphere of the hottest white dwarf (WD) known, \objectH150465, and its quantitative analysis by means of detailed non-LTE model atmospheres.
H150465 has an effective temperature of 200 000 K. It belongs to the
PG1159 spectral class, which are hot, hydrogen-deficient (pre-) white
dwarfs. Their surface chemistry (typical abundances: He=33%, C=48%,
O=17%,
Ne=2%, mass fractions) suggests that they exhibit matter from
the helium-buffer layer between the H- and He-burning shells in the
progenitor AGB star (Werner 2001). This is likely because the PG1159
stars have suffered a late He-shell flash, a phenomenon that drives
the fast evolutionary rates of such famous stars like FG Sge and
Sakurai’s object. \objectH150465 is in fact a peculiar member of this class,
because it is also helium-deficient. Its atmosphere is mainly
composed of carbon and oxygen plus neon and magnesium (C=48%, O=48%,
Ne=2%, O=2%, mass fractions). \objectH150465 is a unique object, considering
its high and chemical surface composition, and we have
speculated that it represents the naked C/O core of a former red giant
(Werner et al.2004, W04).
Chandra LETG+HRC-S spectra from \objectH150465 have revealed the richest X-ray absorption line spectrum recorded from a stellar photosphere to date. We have recently performed a detailed analysis of this spectrum (W04, Fig. 1) and we use in the paper in hand the photospheric spectrum of \objectH150465 together with an appropriate model atmosphere to identify a number of emission lines in the coronae of \object Cen A, \object Cen B, and Procyon. The difference in particle densities in the WD photosphere and in the coronae amounts to many orders of magnitude (roughly ne= and cm-3, respectively), however, the temperature in the line forming regions of the WD (up to 300 000 K) is comparable to the low-temperature component of multi-temperature fits to coronae, required to account for the lines of low-ionisation stages (e.g. 630 000 K for Procyon; Raassen et al.2002). As a consequence, numerous lines from O vi, Ne vi-viii and Mg vi-ix are visible in the soft X-ray spectra of both, the cool star coronae (in emission) and the hot WD photosphere (in absorption). Lines from higher ionisation stages are formed in the high-temperature regions of the coronae (T of the order 1–2.5 million K for the stars studied in this paper), hence, their respective absorption line counterparts cannot be formed in the WD photosphere. Fig. 2 shows the temperature and particle density structure of a model for \objectH150465.
In the following, we first introduce briefly the characteristics of the objects studied here. We describe our model atmosphere calculation for the hot WD, concentrating on the atomic data employed. We then perform a detailed comparison of the absorption and emission line spectra and suggest a number of new line identifications for the cool star coronae.
| /Å (\objectH150465 model) | seen in | Ion | Transition | Source | Remark | ||
|---|---|---|---|---|---|---|---|
| 69.41, .47, .57 | A,B,P | Mg viii | 2p 2Po – | 3p 2D | G | Nist | N |
| 74.27, .32, .34, .37, .41, .43 | A,B,P | Mg viii | 2p2 4P – | 3d 4Do | M | Nist | N |
| 74.78, .81, .87 | A,B | Ne vii | 2p 3Po – | 4p 3D | M | Nist | N |
| 74.86, 75.03, .04 | A,B,P | Mg viii | 2p 2Po – | 3d 2D | G | Nist | R |
| (78.34), 78.41, 78.52 | A,B,P | Mg vii | 2p3 3P – | 3p 3Po | G | Kelly | N |
| 80.23, .25 | A,B,P | Mg viii | 2p2 2D – | 3d 2Do | Nist | R | |
| 80.95, 81.02, .14 | A,(B,P) | Mg vii | 2p3 3P – | 3p 3So | G | Kelly | N |
| 81.37 | (A),B,P | Ne vii | 2p 1Po – | 4p 1P | Kelly | N | |
| 81.73, .79, .84, .87, .94, .98 | A,B,P | Mg viii | 2p2 4P – | 3s 4Po | M | Nist | N |
| 82.17, .20, .27 | A,B,(P) | Ne vii | 2p 3Po – | 4d 3D | M | Kelly | N |
| (82.60), .82 | A,B,P | Mg viii | 2p 2Po – | 3s 2S | G | Nist | R |
| 83.51, .56, .59, .64, .71, .76 | A,B,P | Mg vii | 2p3 3P – | 3d 3Po | G | Kelly | R, N |
| 83.91, .96, .99, 84.02, .09, .11 | A,B,P | Mg vii | 2p3 3P – | 3d 3Do | G | Kelly | R, N |
| (84.19, .23,) .30 | A | Ne vii | 2p 3Po – | 4s 3S | M | Bashkin | R |
| 85.41 | (A,B,P) | Mg vii | 2p2 1D – | 3d 1Fo | M | Kelly | N |
| 86.82 | A,B,P | Ne vii | 2p2 1D – | 4d 1Fo | M | Kelly | N |
| 86.84, .85, 87.02 | A,B,P | Mg viii | 2p2 2D – | 3s 2Po | Nist | R, N | |
| 87.46 | A | Ne vii | 2s2 1S – | 3s 1Po | G | Nist | N |
| 87.72 | A | Mg vii | 2p2 1D – | 3d 1Do | M | Kelly | N |
| 88.08, 88.12 | A,B,P | Ne viii | 2s 2S – | 3p 2Po | M | Nist | R |
| 88.68 | (A),B,P | Mg vii | 2p2 1S – | 3d 1Po | M | Kelly | N |
| 89.64, .65 | A,(P) | Mg vi | 2p3 2Po – | 4s 2P | M | Kelly | N |
| 91.56 | P | Ne vii | 2p 1Po – | 4s 1S | Kelly | R | |
| 92.13, .32 | A,B,P | Mg viii | 2p2 2S – | 3s 2Po | Nist | R, N | |
| 92.85 | P | Ne vii | 2p2 1S – | 4d 1Po | M | Kelly | R |
| (93.89), 94.07, .10, (.27) | A,B,P | Mg viii | 2p 2P – | 3s 2Po | Nist | N | |
| 94.04, (.17, .24) | A,B,P | Mg vii | 2p3 5So – | 3s 5P | M | Kelly | N |
| 94.26, .27, .30, .31, .36, .39 | B | Ne vii | 2p 3Po – | 3p 3P | M | Bashkin | N |
| 95.03, .04 | B | Mg vii | 2p3 3Do – | 3s’ 3D | Kelly | N | |
| 95.26, .38, .42, .49, .56, .65 | (A,B,P) | Mg vii | 2p3 3P – | 3s 3Po | G | Kelly | N |
| (95.38, .42, .48) | (A,B,P) | Mg vi | 2p3 4So – | 3d 4P | G | Kelly | R |
| 95.75, .81, .89, .90, .91, 96.0 | A,B,P | Ne vii | 2p 3Po – | 3p 3D | M | Bashkin | N |
| /Å (\objectH150465 model) | seen in | Ion | Transition | Source | Remark | ||
|---|---|---|---|---|---|---|---|
| 96.08, .09 | (A,B,P) | Mg vi | 2p3 2Po – | 3d” 2D | M | Kelly | N |
| 97.50 | A,B,P | Ne vii | 2s2 1S – | 3p 1Po | G | Kelly | R |
| 98.11, .26 | A,B,P | Ne viii | 2p 2Po – | 3d 2D | Nist | R | |
| 98.50, .51 | B | Mg vi | 2p3 2Po – | 3d’ 2S | M | Kelly | N |
| 99.69 | B | O vi | 2s – | 6p | G | Kelly | N |
| 100.70, .90 | A | Mg vi | 2p3 2Do – | 3d 2F | M | Kelly | N |
| 101.49, .55 | B | Mg vi | 2p3 2Do – | 3d 2P | M | Kelly | N |
| 102.91, 103.08 | A,B,P | Ne viii | 2p 2Po – | 3s 2S | Nist | R | |
| 103.09 | (A,B,P) | Ne vii | 2p 1Po – | 3p 1D | Kelly | N | |
| 104.81 | B,P | O vi | 2s – | 5p | G | Kelly | R |
| 105.17 | A,(B) | Mg vii | 2p3 1Do – | 3s’ 1D | Kelly | N | |
| 106.03, .08, .19 | P | Ne vii | 2p 3Po – | 3d 3D | M | Kelly | R, N |
| (111.10, .16), .26 | A,B,P | Ne vi | 2p 2Po – | 3p 2D | G | Kelly | N |
| 111.15 | (A),B,P | Ne vii | 2p2 1D – | 3d 1Po | M | Kelly | N |
| 111.55, .75, .86 | B,(A,P) | Mg vi | 2p3 4So – | 3s 4P | G | Kelly | R |
| (115.33), .39, (.52) | A,B,P | Ne vii | 2p 3Po – | 3s 3S | M | Kelly | R |
| 115.82, .83 | B | O vi | 2s – | 4p | G | Kelly | R |
| 115.96 | B | Ne vii | 2p2 1D – | 3d 1Do | M | Kelly | N |
| (116.35), .42 | B | O vi | 2p – | 5d | Kelly | N | |
| 116.69 | B | Ne vii | 2p 1Po – | 3d 1D | Kelly | R | |
| 116.97, 117.22 | A | Mg vi | 2p3 2Po – | 3s’ 2D | M | Kelly | N |
| (117.33), .40 | B | O vi | 2p – | 5s | Kelly | N | |
| (117.43), .66, (.78) | P | Mg vii | 2p3 3So – | 3s 3P | Kelly | N | |
| (117.52), .64, (.81) | P | Mg vii | 2p3 3Po – | 3p 3P | Kelly | N | |
| 120.20, .27, .33, .35, .42, .48 | P | Ne vii | 2p2 3P – | 3s 3Po | Kelly | N | |
| 122.49, .69 | B,P | Ne vi | 2p 2Po – | 3d 2D | G | Kelly | R, N |
| 123.59 | P | Mg vi | 2p4 2D – | 3siv 2Do | Kelly | N | |
| 127.67 | B,P | Ne vii | 2p 1Po – | 3s 1S | Kelly | R | |
| 129.78, .87 | A,B,P | O vi | 2p – | 4d | Kelly | R | |
| 130.31, .64 | B | Mg vi | 2p4 2P – | 3sv 2Po | Kelly | N | |
| 130.94, 131.09, .30 | A,B,P | Mg vii | 2p3 3So – | 3p 3P | Kelly | N | |
| 132.22, .31 | A,B | O vi | 2p – | 4s | Kelly | N | |
| 150.09, .12 | B,P | O vi | 2s – | 3p | G | Kelly | R |
2 Observations
H150465 was observed with the Chandra LETG+HRC-S on September 27, 2000, with an integration time of approximately 25 ks. Flux was detected in the range 60Å–160Å. The spectrum is that of a hot photosphere, characterized by a continuum with a large number of absorption lines from highly ionized species: O v-vi, Ne vi-viii, and Mg v-viii. It rolls off at long wavelengths due to ISM absorption. The maximum flux is detected near 110Å. Between 105Å and 100Å the flux drops because of photospheric absorption from the O vi edge caused by the first excited atomic level. The edge is not sharp because of a converging line series and pressure ionization. Below 100Å the flux decreases, representing the Wien tail of the photospheric flux distribution. The complete spectrum with detailed line identifications was presented in W04.
The \object Cen A and B observation has been described in detail by Raassen et al. (2002) and we describe it here only in brief. \object Cen was observed with the LETG+HRC-S on December 25, 1999 with an exposure time of 81.5 ks, including dead time corrections to account for telemetry saturation during intervals of high background. The observation was designed such that the two stars were maximally separated in the cross-dispersion axis, with the dispersion axis positioned nearly perpendicular to the axis of the binary. At the time of the observation, the stars were separated by on the sky. The spectra were extracted with the standard CIAO bow-tie region, though the central two background regions interfered with the stellar spectra and only the outer regions were used for background subtraction.
The two Procyon observations studied here were obtained with the LETG+HRC-S as part of the Chandra on-orbit calibration programme and Emission Line Project. The observations were executed contiguously beginning on November 6, 1999 at 21:11:32 UT. The second observation began on 1999 November 16:59:48 UT. The effective exposure times for these observations were 69,643s and 69,729s, respectively, including dead time corrections.
Reduction of the HRC-S event lists for all the observations was initially based on standard pipeline products. Events were further filtered in pulse height in order to remove background events. The final reduced first order spectra were co-added in order to maximise the signal. In the case of Procyon, we also co-added the two separate observations.
3 Photospheric model for \objectH150465
We use here a photospheric spectrum from a line blanketed non-LTE model atmosphere constructed for \objectH150465 by W04. Model parameters are: =200 000 K, =8 [cm/s2], and C=48%, O=48%, Ne=2%, O=2%, (mass fractions). Details of model assumptions and calculations can be found in that reference and we restrict ourselves here to those characteristics which are of immediate relevance in our context. This primarily concerns the NLTE model atoms for neon and magnesium. They comprise 88 and 122 NLTE levels, connected with 312 and 310 radiative line transitions, respectively, in the ionization stages iv-ix. The final synthetic spectrum was computed considering fine structure splitting of levels and multiplets assuming relative LTE populations for levels within a particular term. We have tried to use the best available data for level energies and line wavelengths, compiling them from several sources. For the lines discussed here (Table 1), we used the following databases:
(i) National Inst. of Standards and Technology (NIST)111http://physics.nist.gov/,
(ii) Chianti database (Young et al.2003)222http://wwwsolar.nrl.navy.mil/chianti.html,
(iii) Kelly Atomic Line Database333http://cfa-www.harvard.edu/amdata/ampdata/kelly/
kelly.html.
However, in order to assemble the complete model atoms, other sources were essential, too:
(iv) Opacity Project (OP, Seaton et al.1994) TOPbase444http://legacy.gsfc.nasa.gov/topbase/home.html,
(v) University of Kentucky Atomic Line List555http://www.pa.uky.edu/∼peter/atomic/.
4 Comparison with \object Cen A and B, and \objectProcyon
We have performed a detailed comparison of the \objectH150465 photospheric absorption line spectrum with the coronal emission line spectra of \object Cen A, \object Cen B, and \objectProcyon. We have also used the model spectrum of \objectH150465 for this purpose. It turns out that not all lines predicted by the model, particularly the weaker ones, are readily identified in \objectH150465, which is at least in part due to the S/N of the Chandra spectrum. Another reason is heavy blending by lines from iron group elements, which are not considered in the model used here. It was shown that identification of weak lines suffers from iron and nickel line blends, which is a problem because the accurate positions of the majority of lines from Fe-group elements in the soft X-ray domain is unknown (W04). The use of our synthetic spectrum in addition to the \objectH150465 spectrum helps considerably to identify lines in the coronal spectra.
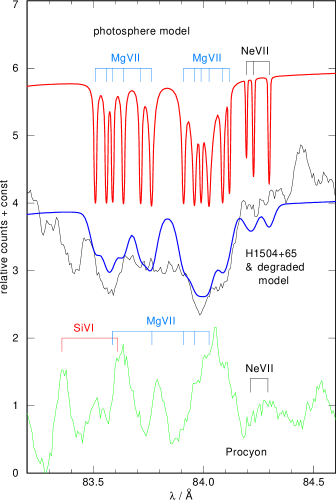
Table 1 summarizes the results of our comparison. Lines from 65 multiplets of O vi, Ne vi-viii, and Mg vi-viii are identified in both, \objectH150465 (or its model) and in at least one of the considered coronae. Many of these were already identified by Raassen et al.(2002, 2003), but the majority represents new identifications. Many, but not all, of the tabulated lines have lower levels which are either ionic ground states or metastable states (labeled G or M, respectively). As an example how the spectra compare, we show in Fig. 3 the spectra of Procyon and \objectH150465 in a wavelength region where a bunch of lines from two Mg vii and one Ne vii multiplet is located. All three multiplets, or at least some components of them, were identified by Raassen et al.(2002) in Procyon. They are also clearly seen as absorption features in the \objectH150465 spectrum. Over this, we have plotted the model spectrum, degraded to the Chandra spectral resolution, which can qualitatively reproduce the observed line features. Placed at the top of this Figure we show the original, non-degraded model spectrum, showing the diverse structure of the multiplets, whose components are not entirely resolved in Chandra spectra, neither of \objectH150465 nor of \objectProcyon.
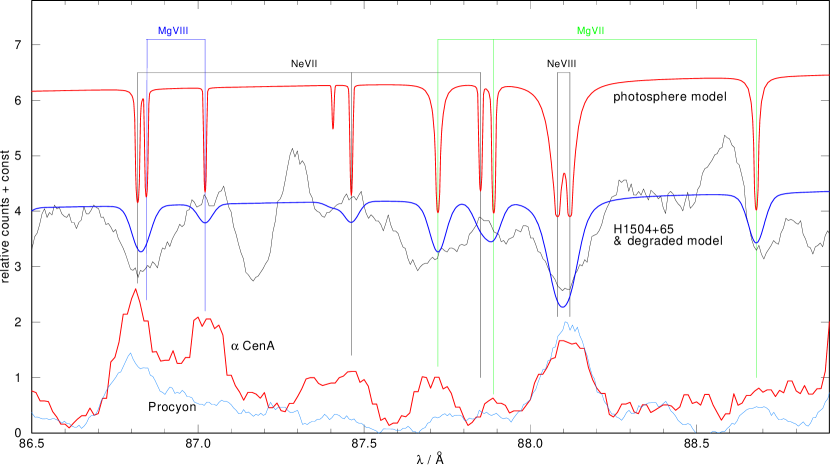
Fig. 4 shows a detail from the spectra of \objectProcyon and \object Cen A compared to \objectH150465 in another wavelength interval. It displays some new line identifications in the coronal spectra, see for example the 87.46Å resonance line of Ne vii in \object Cen A. The strongest emissions in \object Cen A stem from two Ne viii and Mg viii doublets, identified already in Raassen et al.(2003). But note that the Mg viii 86.84Å component is blended with the possibly stronger, newly identified Ne vii 86.82Å line.
Some of the lines newly identified lines do blend with other lines used for coronal diagnostics. The emissivity of the Fe viii lines at 130.94Å and 132.24Å in Procyon was computed by Raassen et al.(2002) using a three-temperature model. They stress that these line strengths are strongly underestimated, by factors 6 and 4 compared to the observation. The result of their differential emission measure (DEM) model underestimates the emissivity even more (factors 9 and 6). This can at least partially be explained by the fact that two components of a Mg vii triplet (at 130.94Å and 131.30Å) can contribute to the Fe viii line emissivities. A similar explanation may hold for the too-weak Fe ix 105.20Å line in the model. It is blended with a Mg vii singlet at 105.17Å.
Another example is the Mg viii 74.86Å line observed in \object Cen A and \object Cen B. Raassen et al.(2003) find that the line fluxes from their models are too small by about 40%. We think that the missing flux is contributed by a blend with a new neon line located at almost the same wavelength, Ne vii 74.87Å. Detailed emission measure modeling, which is beyond the scope of this paper, is needed to quantify these suggestions. Other blends with previously identified emission lines in the coronae of Procyon and Cen are indicated in Table 1.
5 Summary
We have performed a detailed comparison of Chandra soft X-ray spectra from the photosphere of the hottest known white dwarf, \objectH150465, with the corona spectra of \object Cen A, \object Cen B, and \objectProcyon. With the help of a detailed model spectrum for \objectH150465 we have found that a large number of lines from multiplets of O, Ne, and Mg are present in both the photospheric absorption line spectrum and the coronal emission line spectra. In the coronal spectra we have newly identified lines from about 40 multiplets of O vi, Ne vi-vii, and Mg vi-viii. Some of these lines are blends with previously known lines, which are in use for diagnostic purposes, hence, their contribution to the line flux must be considered in detailed spectral analyses.
A more complete version of this paper will be published in Astronomy & Astrophysics.
Acknowledgements.
Analysis of X-ray data in Tübingen is supported by the DLR under grant 50 OR 0201. JJD was supported by NASA contract NAS8-39073 to the Chandra X-ray Center.References
- [] Beiersdorfer P., Lepson J.K., Brown G.V., et al.1999, ApJL, 519, 185
- [] Drake J.J. 1996, in Cool Stars; Stellar Systems; and the Sun: 9, ed. R. Pallavicini, A.K. Dupree, ASP Conference Series, 109, 203
- [] Drake J.J., Laming J.M., Widing K.G. 1996, ApJ, 443, 393
- [] Jordan C. 1996, in Astrophysics in the Extreme Ultraviolet, IAU Coll. 152, ed. S. Bowyer, R.F. Malina, Dordrecht: Kluwer Academic Publ., p. 81
- [] Lepson J.K., Beiersdorfer P., Brown G.V., et al.2002, ApJ, 578, 648
- [] Lepson J.K., Beiersdorfer P., Behar E., Kahn S.M. 2003, ApJ, 590, 604
- [] Raassen A.J.J., Mewe R., Audard M., et al.2002, A&A 389, 228
- [] Raassen A.J.J., Ness J.-U., Mewe R., et al.2003, A&A, 400, 671
- [] Seaton M.J., Yan Y., Mihalas D., Pradhan A.K. 1994, MNRAS, 266, 805
- [] Werner K. 2001, in Low Mass Wolf-Rayet Stars: Origin and Evolution, ed. T. Blöcker, L.B.F.M. Waters, A.A. Zijlstra, Ap&SS, 275, 27
- [] Werner K., Rauch T., Barstow M.A., Kruk J.W. 2004, A&A, 421, 1169
- [] Young P.R., Del Zanna G., Landi E., Dere K.P., Mason H.E., Landini M. 2003, ApJS, 144, 135